 34
34peptides
spectra
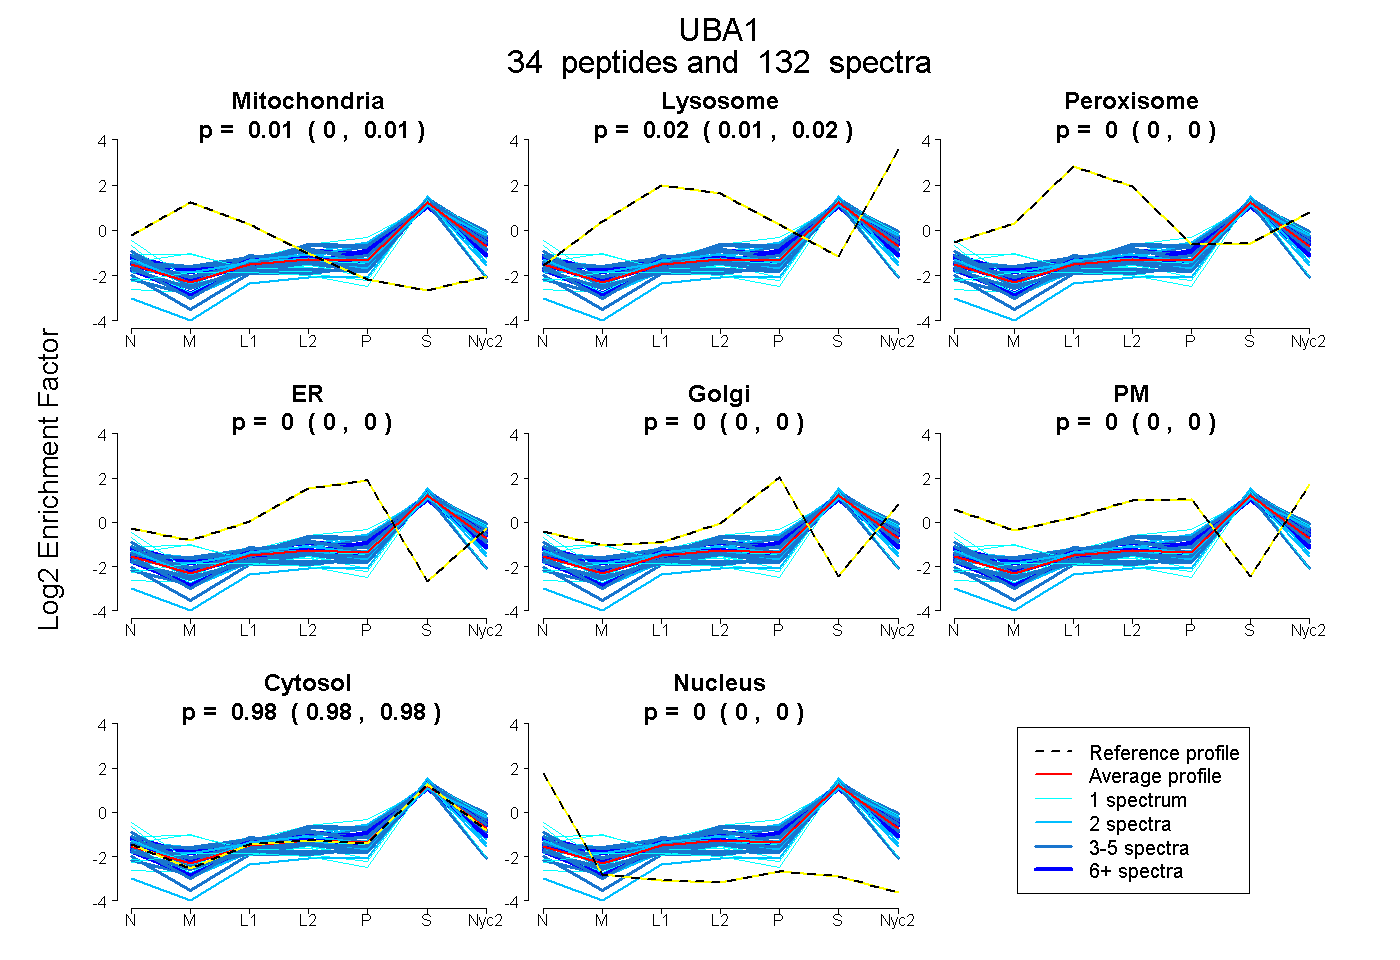
0.002 | 0.007
0.014 | 0.018
0.000 | 0.000
0.000 | 0.000
0.000 | 0.002
0.000 | 0.000
0.976 | 0.980
0.000 | 0.000
13peptides
spectra
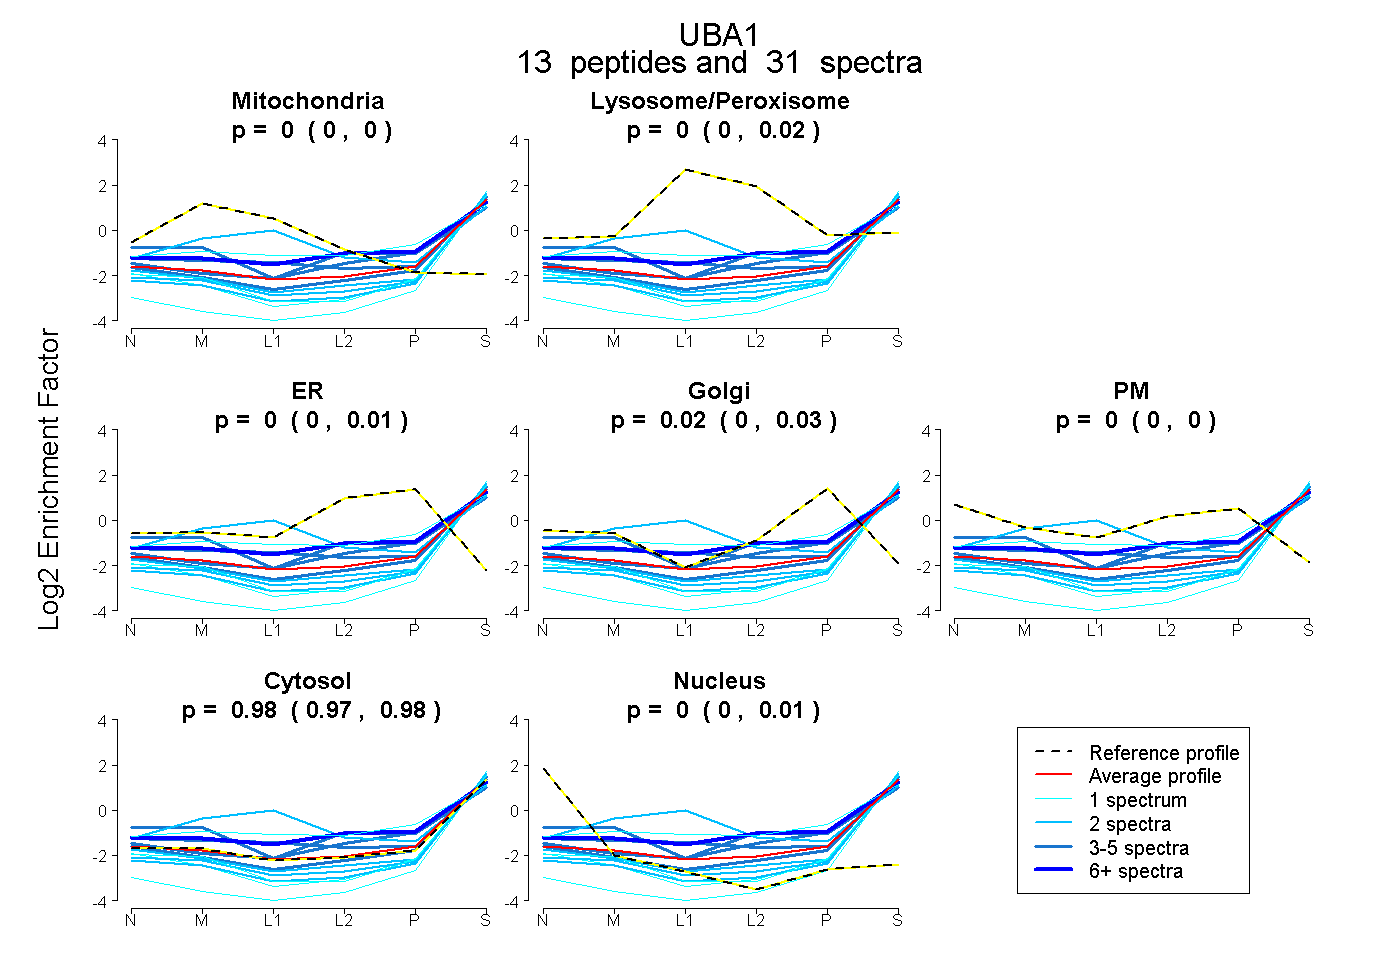
0.000 | 0.000
0.000 | 0.016
0.000 | 0.008
0.000 | 0.028
0.000 | 0.000
0.965 | 0.984
0.000 | 0.008
27peptides
spectra
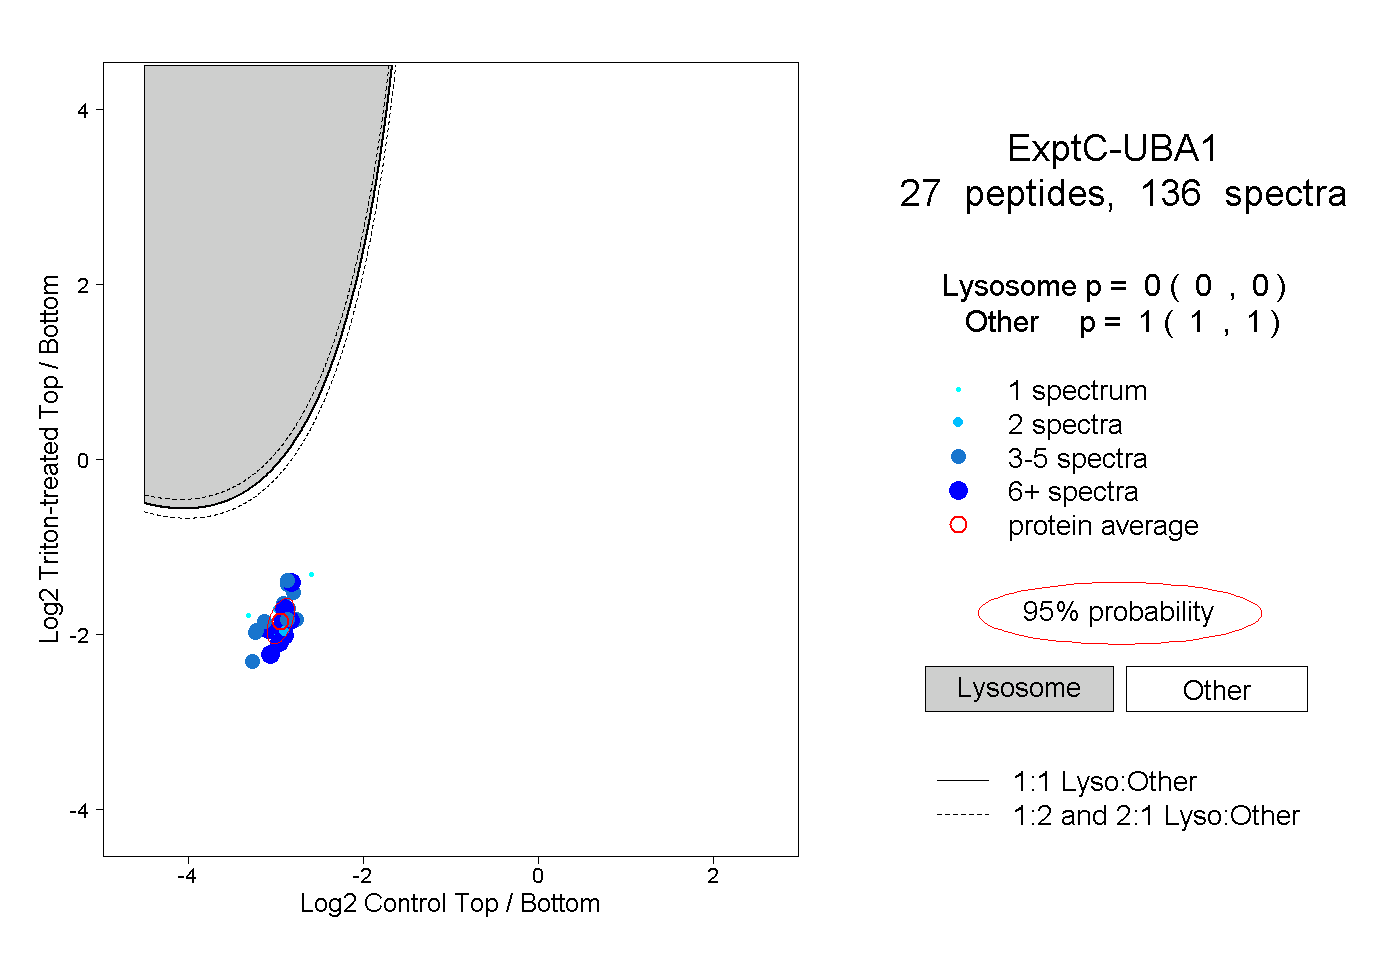
0.000 | 0.000
1.000 | 1.000
9peptides
spectra
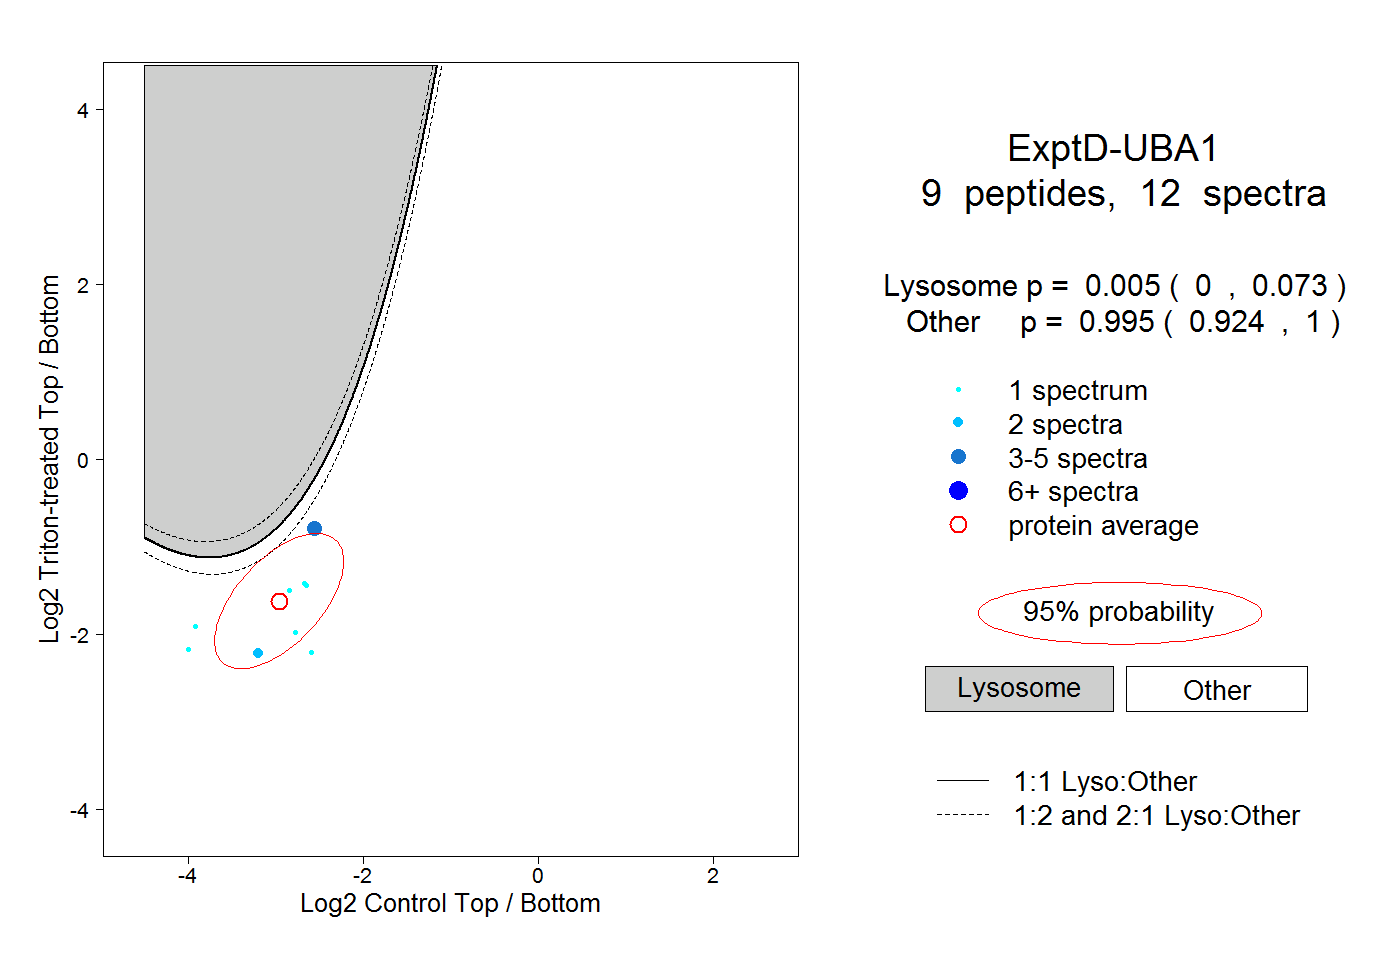
0.000 | 0.073
0.924 | 1.000