 12
12peptides
spectra
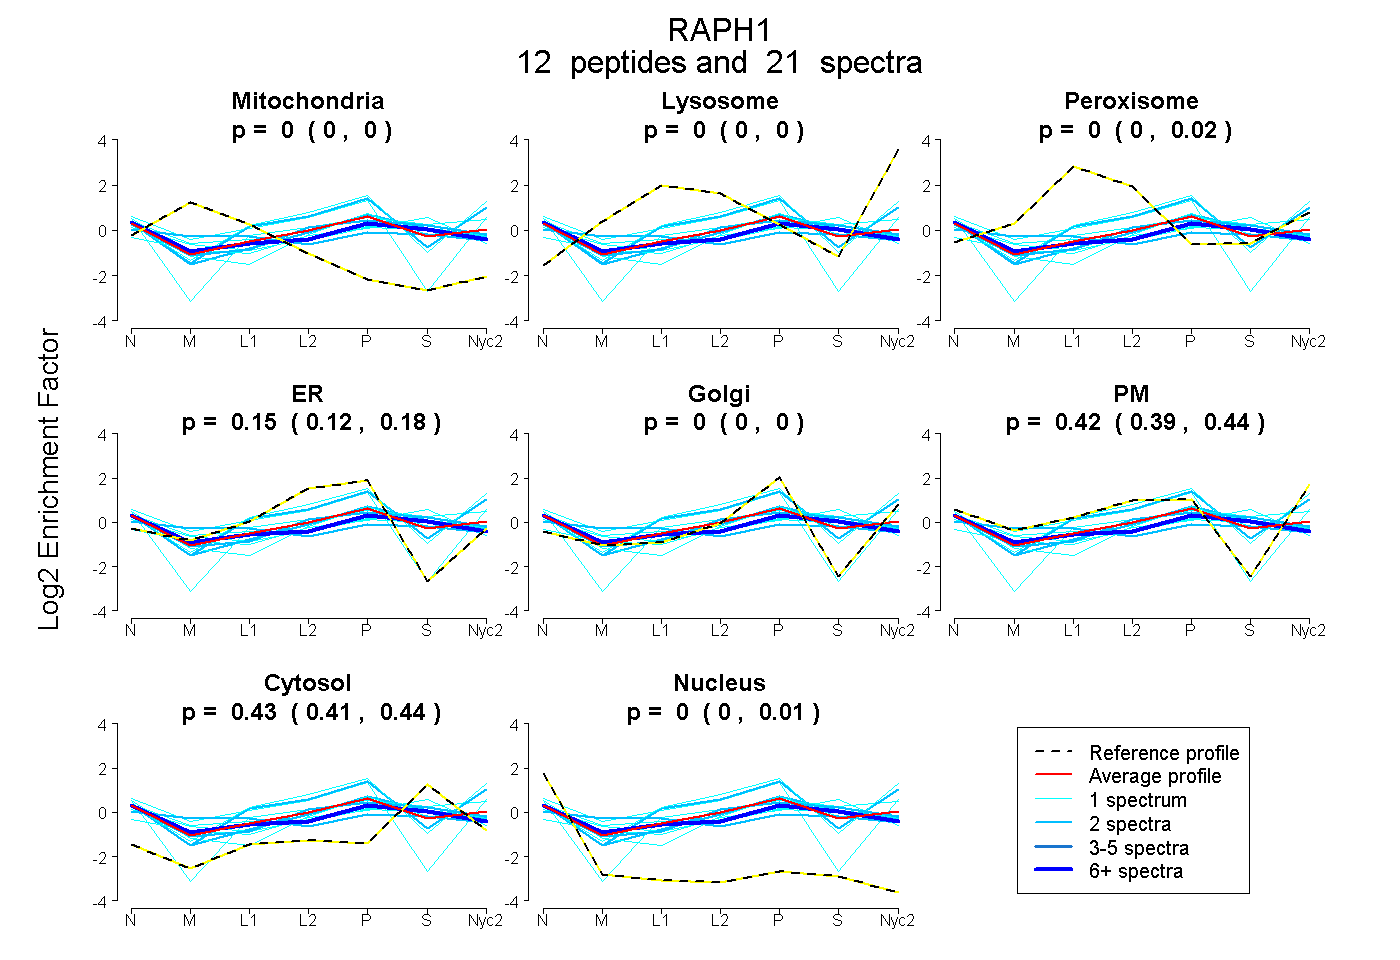
0.000 | 0.000
0.000 | 0.000
0.000 | 0.018
0.118 | 0.175
0.000 | 0.003
0.388 | 0.444
0.410 | 0.438
0.000 | 0.008
1peptide
spectrum
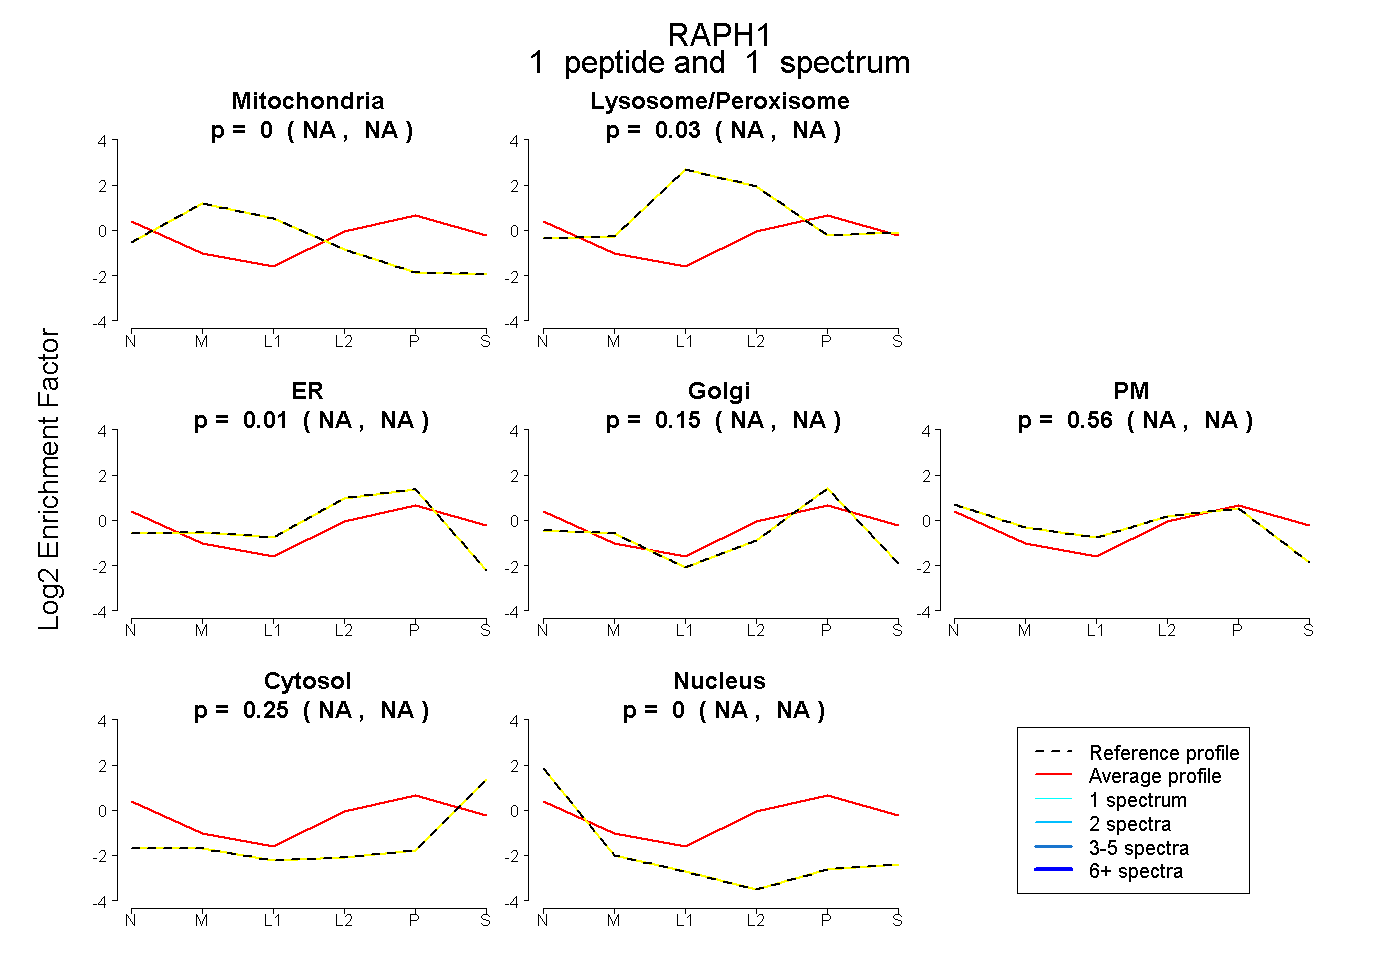
NA | NA
NA | NA
NA | NA
NA | NA
NA | NA
NA | NA
NA | NA
10peptides
spectra
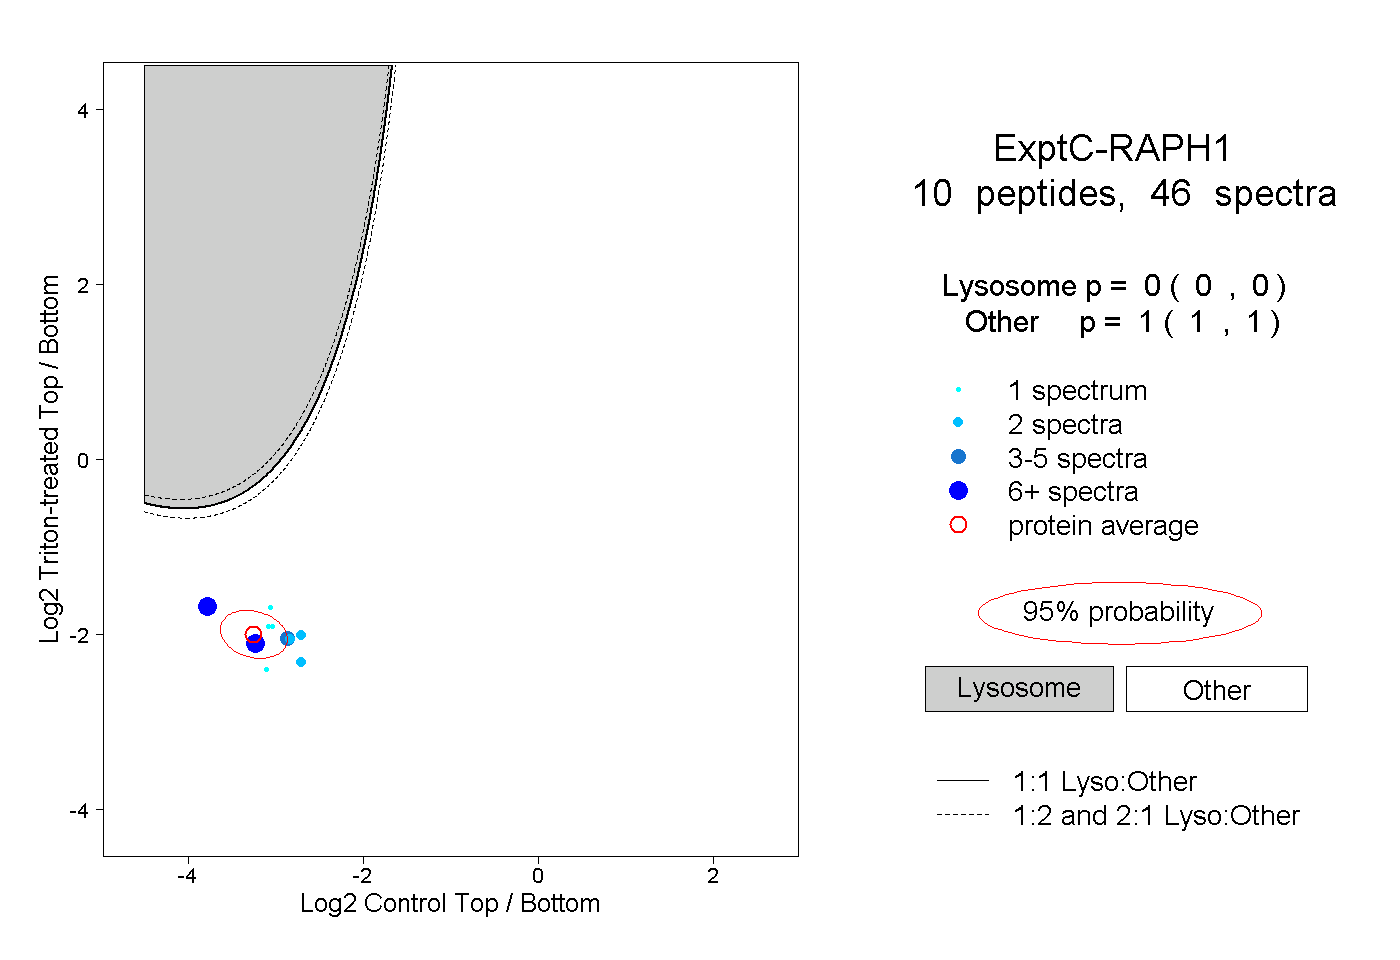
0.000 | 0.000
1.000 | 1.000
1peptide
spectra
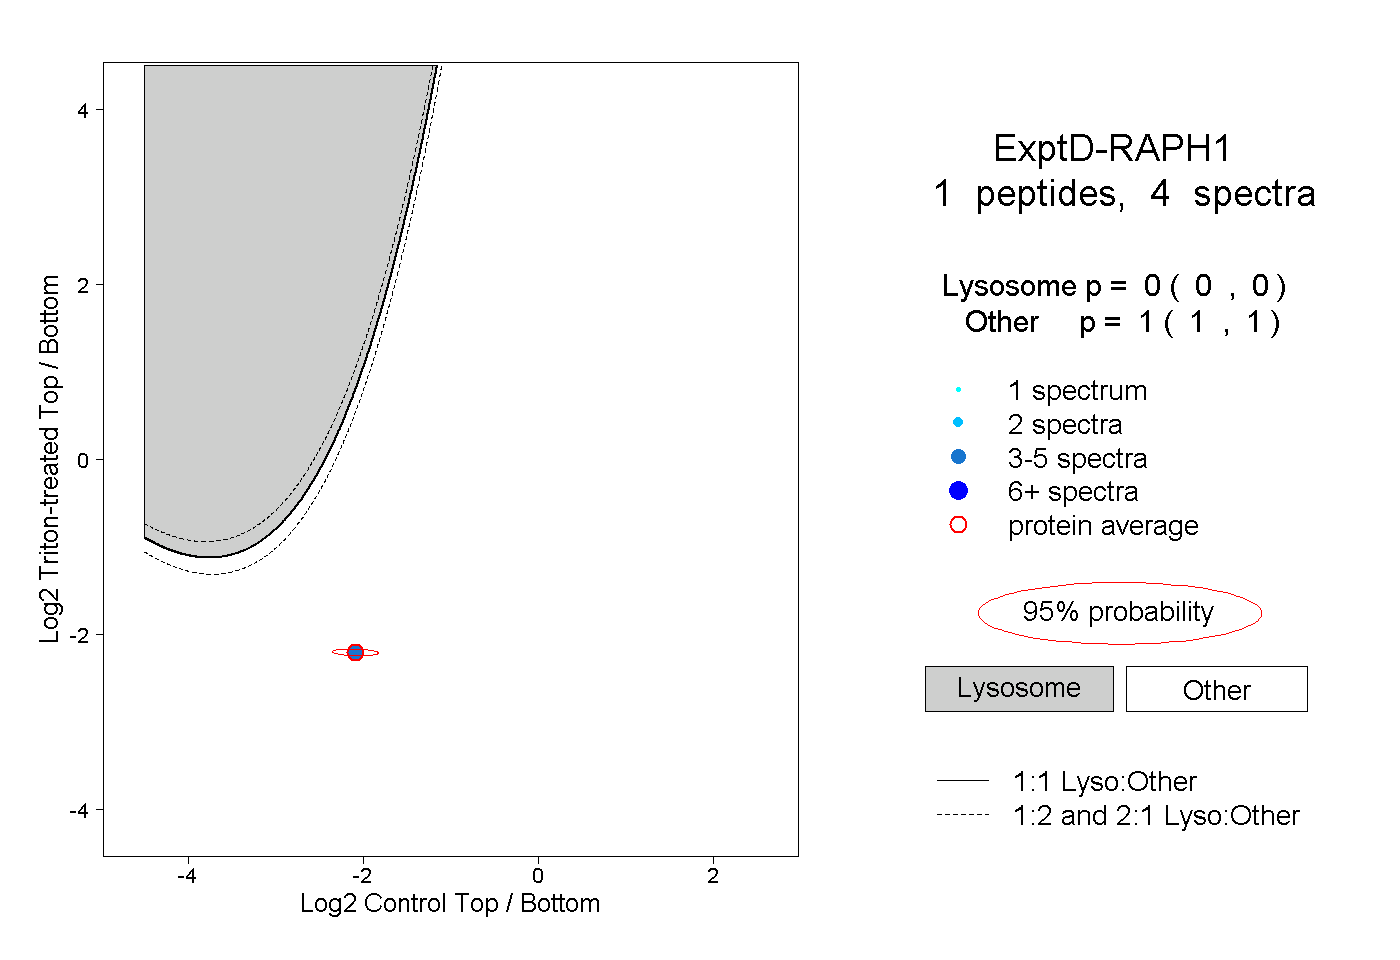
0.000 | 0.000
1.000 | 1.000