RAPH1
[ENSRNOP00000033491]
Main page
| | | Plot |
Mito |
Lyso |
|
Perox |
ER |
Golgi |
PM |
Cytosol |
Nucleus |
|
| Expt A |
 12
12
peptides |
21
spectra |
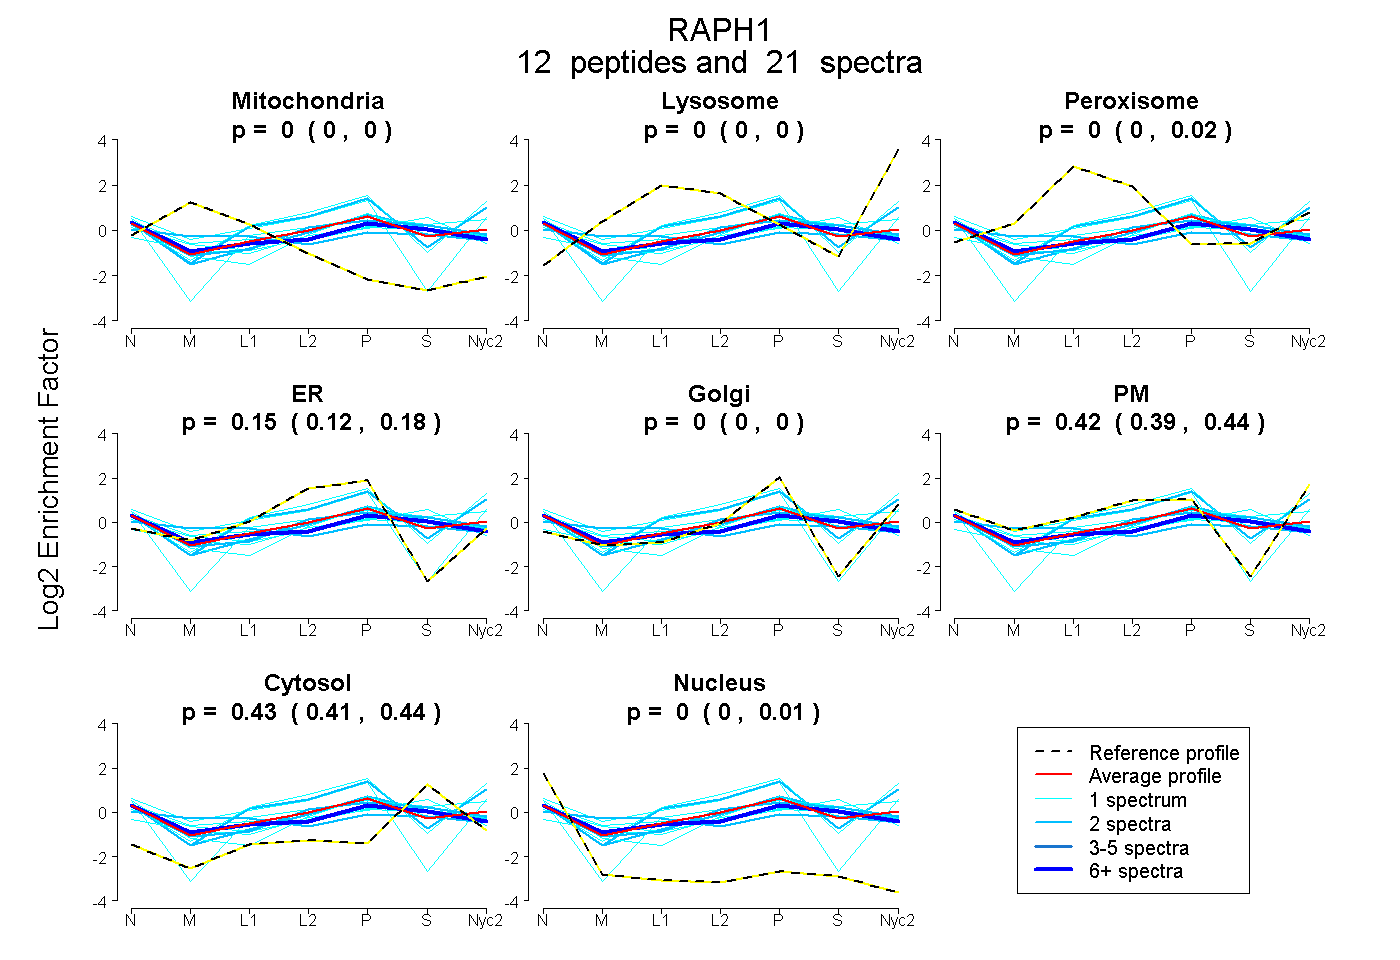 |
0.000
0.000 | 0.000 |
0.000
0.000 | 0.000 |
|
0.001
0.000 | 0.018 |
0.150
0.118 | 0.175 |
0.000
0.000 | 0.003 |
0.421
0.388 | 0.444 |
0.428
0.410 | 0.438 |
0.000
0.000 | 0.008 |
|
| | | Plot |
Mito |
|
Lyso or Perox |
|
ER |
Golgi |
PM |
Cytosol |
Nucleus |
|
| Expt B |
1
peptide |
1
spectrum |
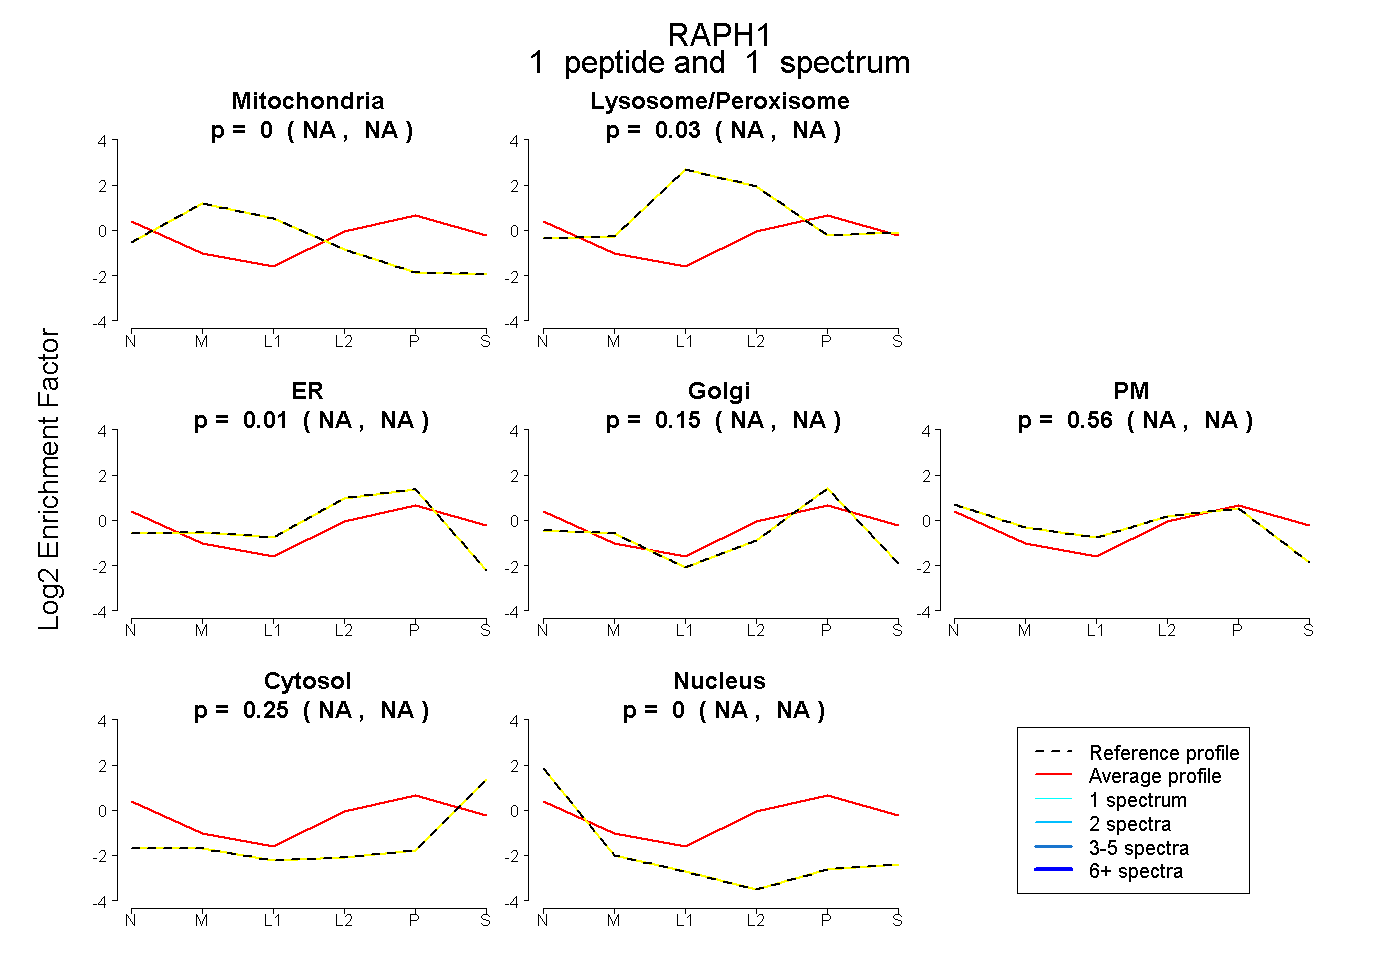 |
0.000
NA | NA |
|
0.030
NA | NA |
|
0.010
NA | NA |
0.153
NA | NA |
0.556
NA | NA |
0.251
NA | NA |
0.000
NA | NA |
|
| | | Plot |
|
Lyso |
|
|
|
|
|
|
|
Other |
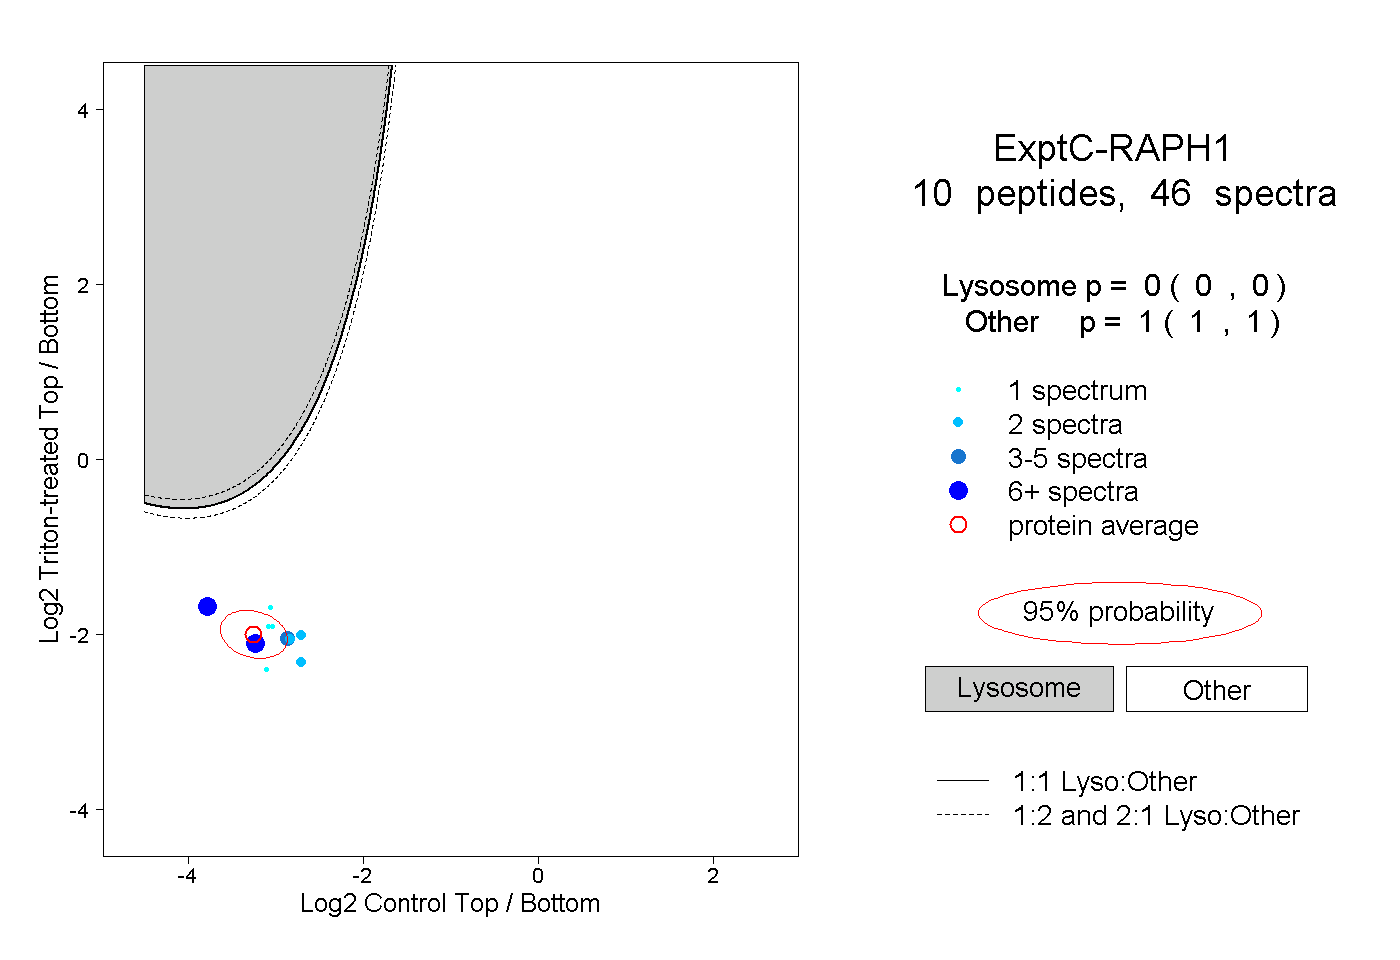
| Expt C |
10
peptides |
46
spectra |
 |
|
0.000
0.000 | 0.000 |
|
|
|
|
|
|
|
1.000
1.000 | 1.000 |
| 10 spectra, EAQVK |
|
0.000 |
|
|
|
|
|
|
|
1.000 |
| 2 spectra, NPQNYLLGK |
|
0.000 |
|
|
|
|
|
|
|
1.000 |
| 2 spectra, TASAGTVSDAEVR |
|
0.000 |
|
|
|
|
|
|
|
1.000 |
| 1 spectrum, LIFMER |
|
0.000 |
|
|
|
|
|
|
|
1.000 |
| 1 spectrum, ASGIYYVPK |
|
0.000 |
|
|
|
|
|
|
|
1.000 |
| 1 spectrum, HPQIQK |
|
0.000 |
|
|
|
|
|
|
|
1.000 |
| 23 spectra, GGSPGK |
|
0.000 |
|
|
|
|
|
|
|
1.000 |
| 2 spectra, FAPPAESGSPSK |
|
0.000 |
|
|
|
|
|
|
|
1.000 |
| 3 spectra, GTQLEESSK |
|
0.000 |
|
|
|
|
|
|
|
1.000 |
| 1 spectrum, KPPPTPQR |
|
0.000 |
|
|
|
|
|
|
|
1.000 |
| | | Plot |
|
Lyso |
|
|
|
|
|
|
|
Other |
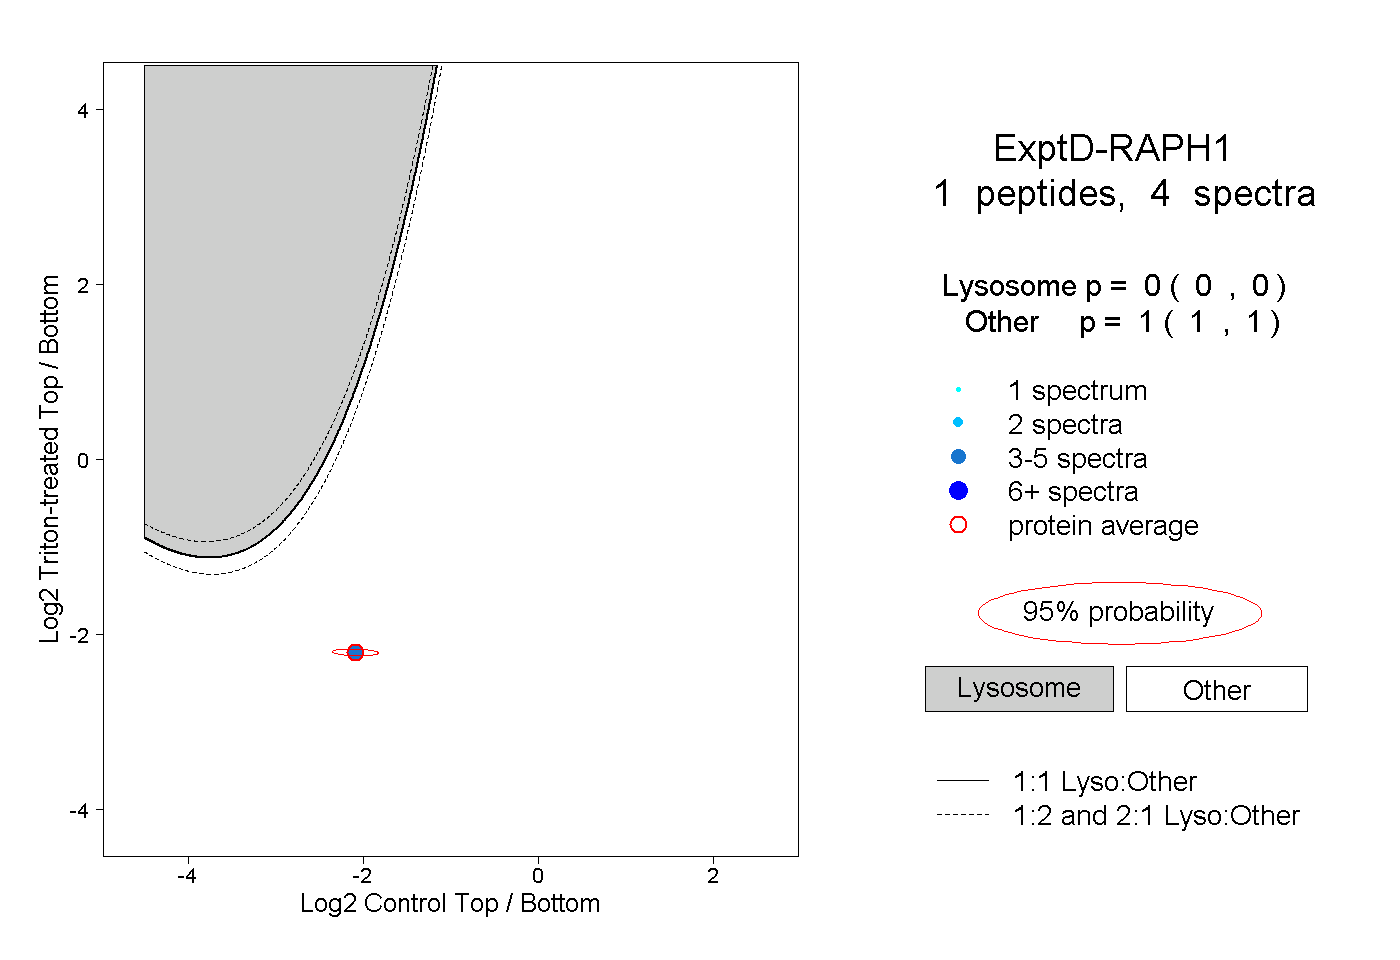
| Expt D |
1
peptide |
4
spectra |
 |
|
0.000
0.000 | 0.000 |
|
|
|
|
|
|
|
1.000
1.000 | 1.000 |