 12
12peptides
spectra
0.000 | 0.000
0.000 | 0.000
0.000 | 0.018
0.118 | 0.175
0.000 | 0.003
0.388 | 0.444
0.410 | 0.438
0.000 | 0.008
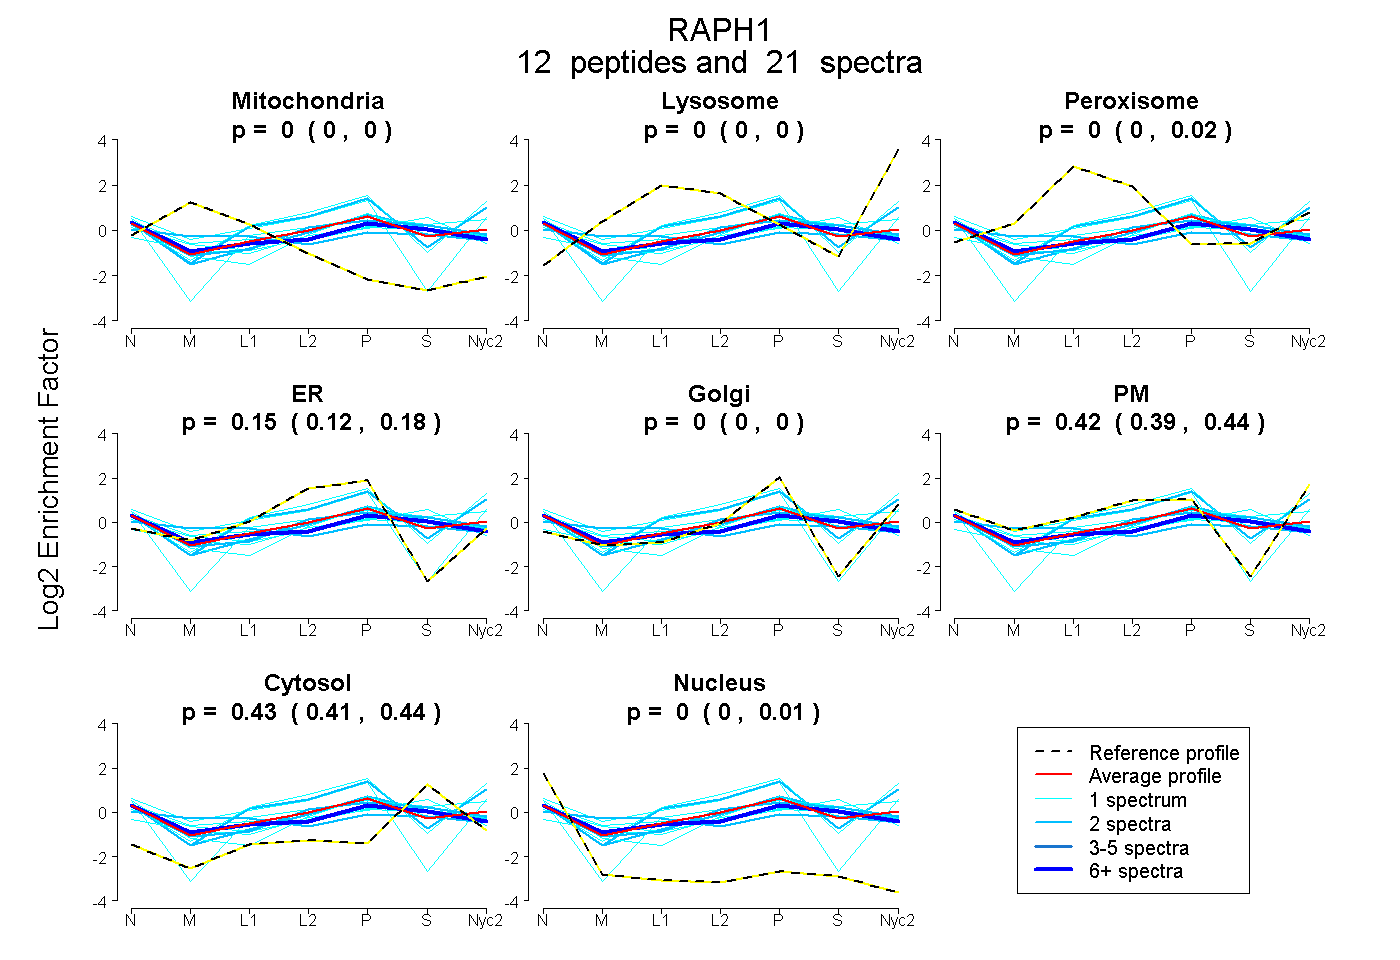
| Plot | Mito | Lyso | Perox | ER | Golgi | PM | Cytosol | Nucleus | |||||
| Expt A |
12 peptides |
21 spectra |
|
0.000 0.000 | 0.000 |
0.000 0.000 | 0.000 |
0.001 0.000 | 0.018 |
0.150 0.118 | 0.175 |
0.000 0.000 | 0.003 |
0.421 0.388 | 0.444 |
0.428 0.410 | 0.438 |
0.000 0.000 | 0.008 |
| 1 spectrum, GVSSSSTR | 0.000 | 0.000 | 0.000 | 0.036 | 0.000 | 0.424 | 0.540 | 0.000 | ||
| 1 spectrum, TESAYDWTSLSSSSIK | 0.030 | 0.000 | 0.046 | 0.194 | 0.000 | 0.137 | 0.593 | 0.000 | ||
| 2 spectra, TLHQWVNGIR | 0.000 | 0.000 | 0.005 | 0.167 | 0.000 | 0.329 | 0.499 | 0.000 | ||
| 1 spectrum, SSLSVQPGFLADLNR | 0.000 | 0.061 | 0.051 | 0.074 | 0.188 | 0.478 | 0.147 | 0.000 | ||
| 2 spectra, NPQNYLLGK | 0.211 | 0.000 | 0.111 | 0.000 | 0.134 | 0.168 | 0.375 | 0.000 | ||
| 1 spectrum, LIFMER | 0.000 | 0.000 | 0.000 | 0.000 | 0.278 | 0.280 | 0.393 | 0.049 | ||
| 1 spectrum, ASGIYYVPK | 0.100 | 0.000 | 0.088 | 0.049 | 0.026 | 0.292 | 0.418 | 0.027 | ||
| 1 spectrum, HPQIQK | 0.069 | 0.000 | 0.002 | 0.054 | 0.000 | 0.362 | 0.513 | 0.000 | ||
| 2 spectra, ETAEMADR | 0.000 | 0.000 | 0.000 | 0.224 | 0.030 | 0.248 | 0.494 | 0.004 | ||
| 6 spectra, YLCCDDAR | 0.004 | 0.000 | 0.092 | 0.088 | 0.062 | 0.261 | 0.432 | 0.061 | ||
| 1 spectrum, KPPPTPQR | 0.045 | 0.000 | 0.000 | 0.267 | 0.081 | 0.562 | 0.000 | 0.045 | ||
| 2 spectra, RPSVDSLVSK | 0.000 | 0.000 | 0.096 | 0.040 | 0.211 | 0.453 | 0.200 | 0.000 |
| Plot | Mito | Lyso or Perox | ER | Golgi | PM | Cytosol | Nucleus | ||||||
| Expt B |
1 peptide |
1 spectrum |
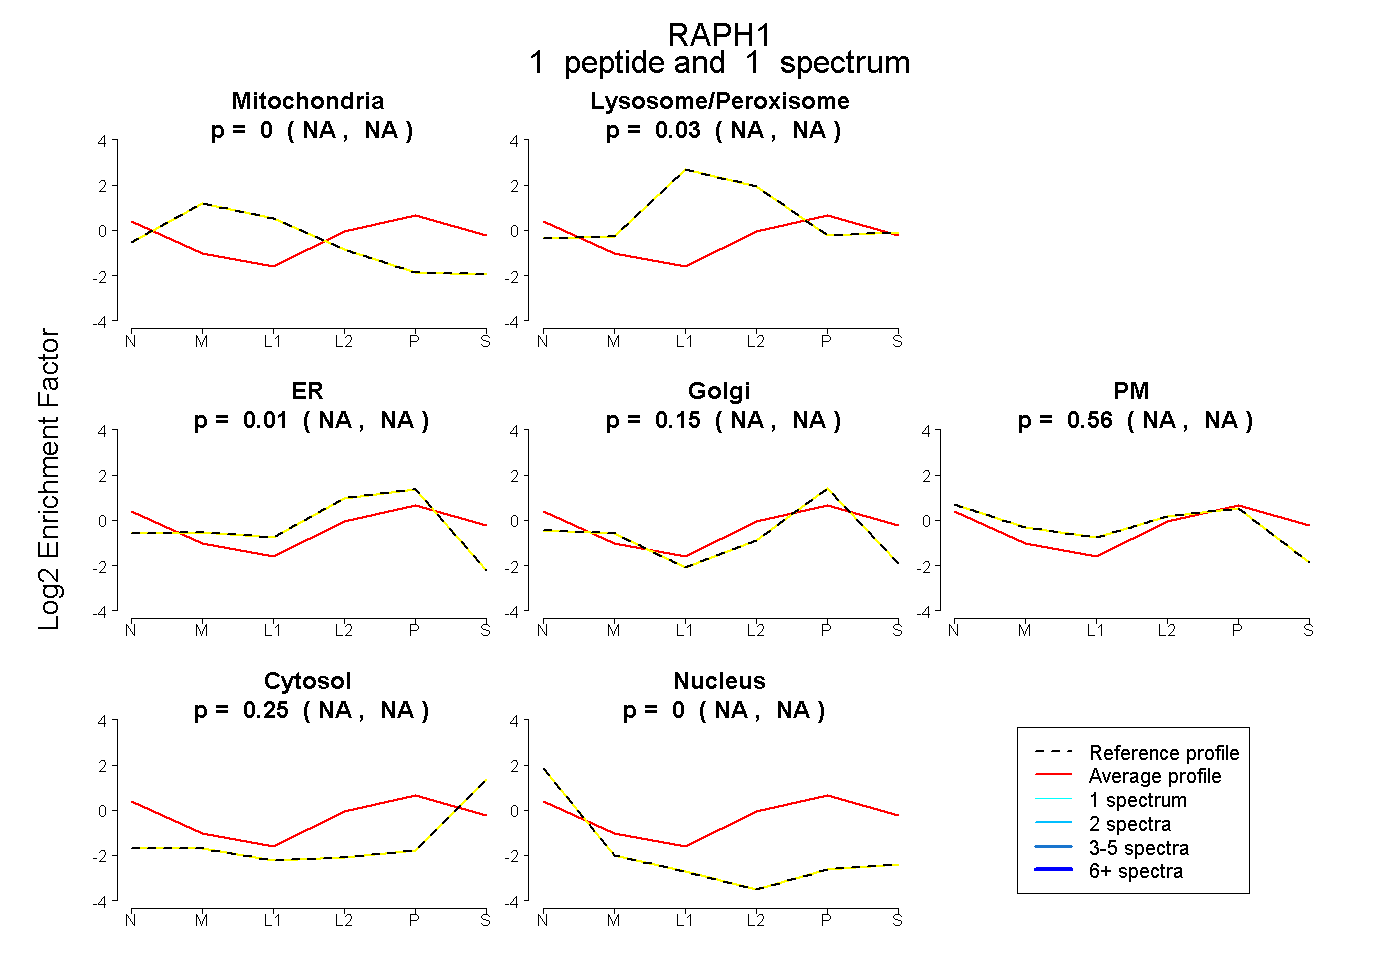 |
0.000 NA | NA |
0.030 NA | NA |
0.010 NA | NA |
0.153 NA | NA |
0.556 NA | NA |
0.251 NA | NA |
0.000 NA | NA |
|||
| Plot | Lyso | Other | |||||||||||
| Expt C |
10 peptides |
46 spectra |
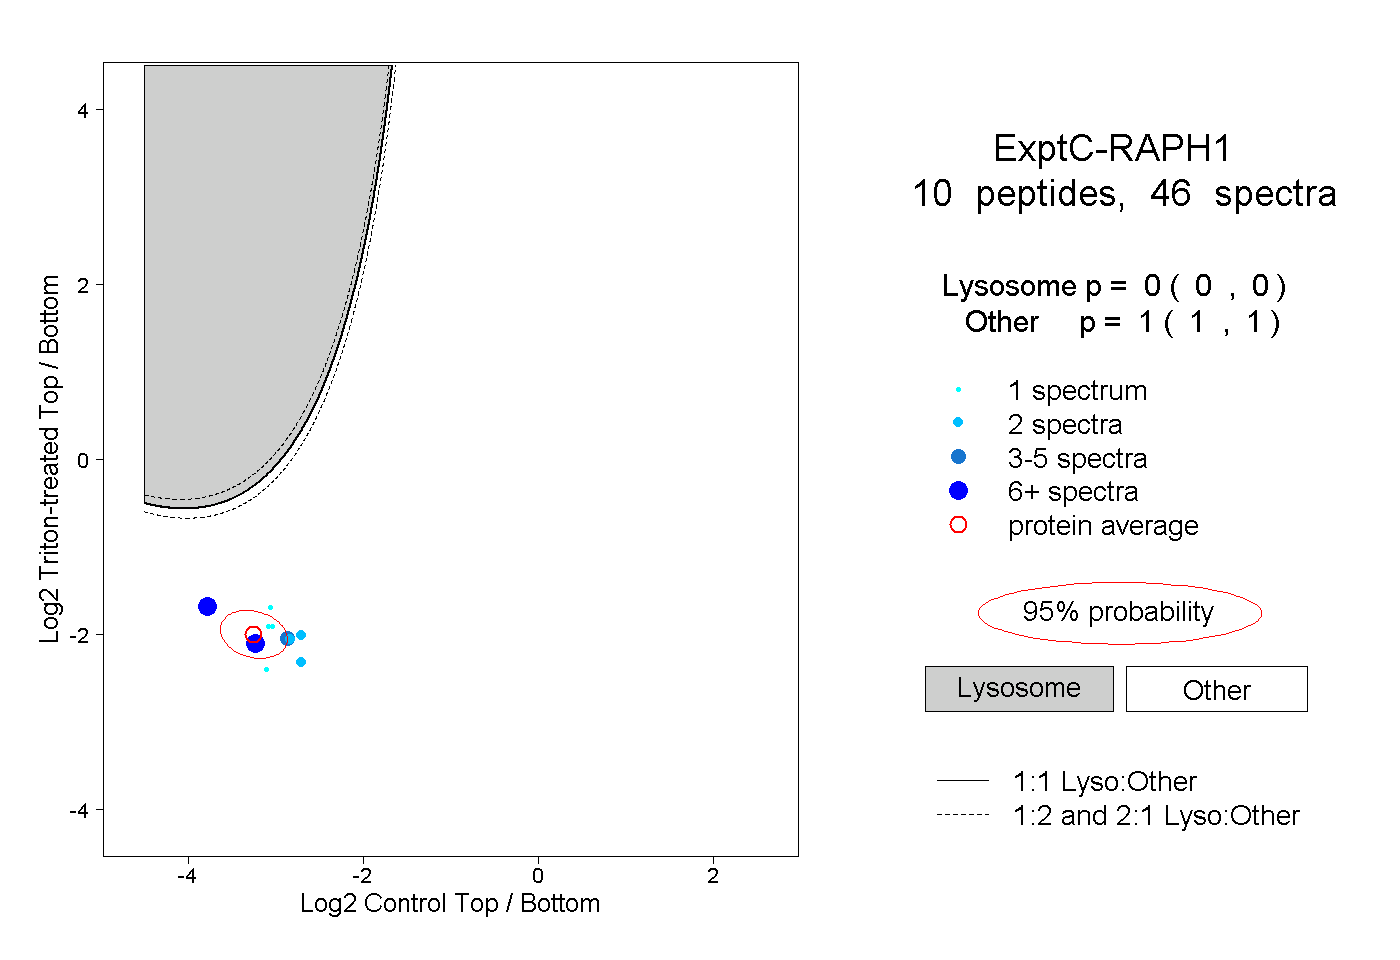 |
0.000 0.000 | 0.000 |
1.000 1.000 | 1.000 |
||||||||
| Plot | Lyso | Other | |||||||||||
| Expt D |
1 peptide |
4 spectra |
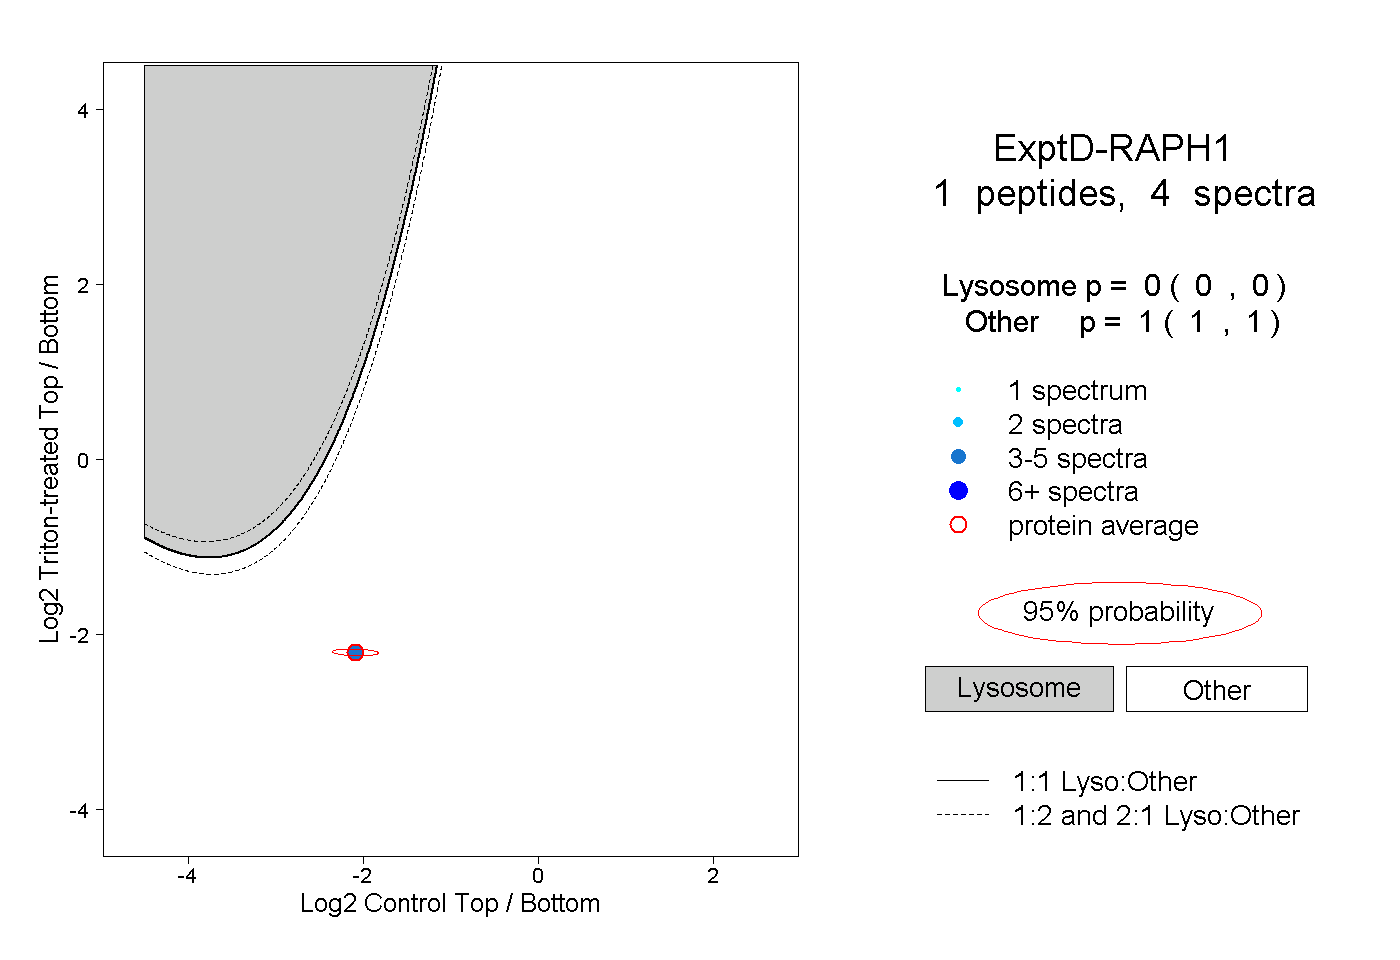 |
0.000 0.000 | 0.000 |
1.000 1.000 | 1.000 |