 27
27peptides
spectra
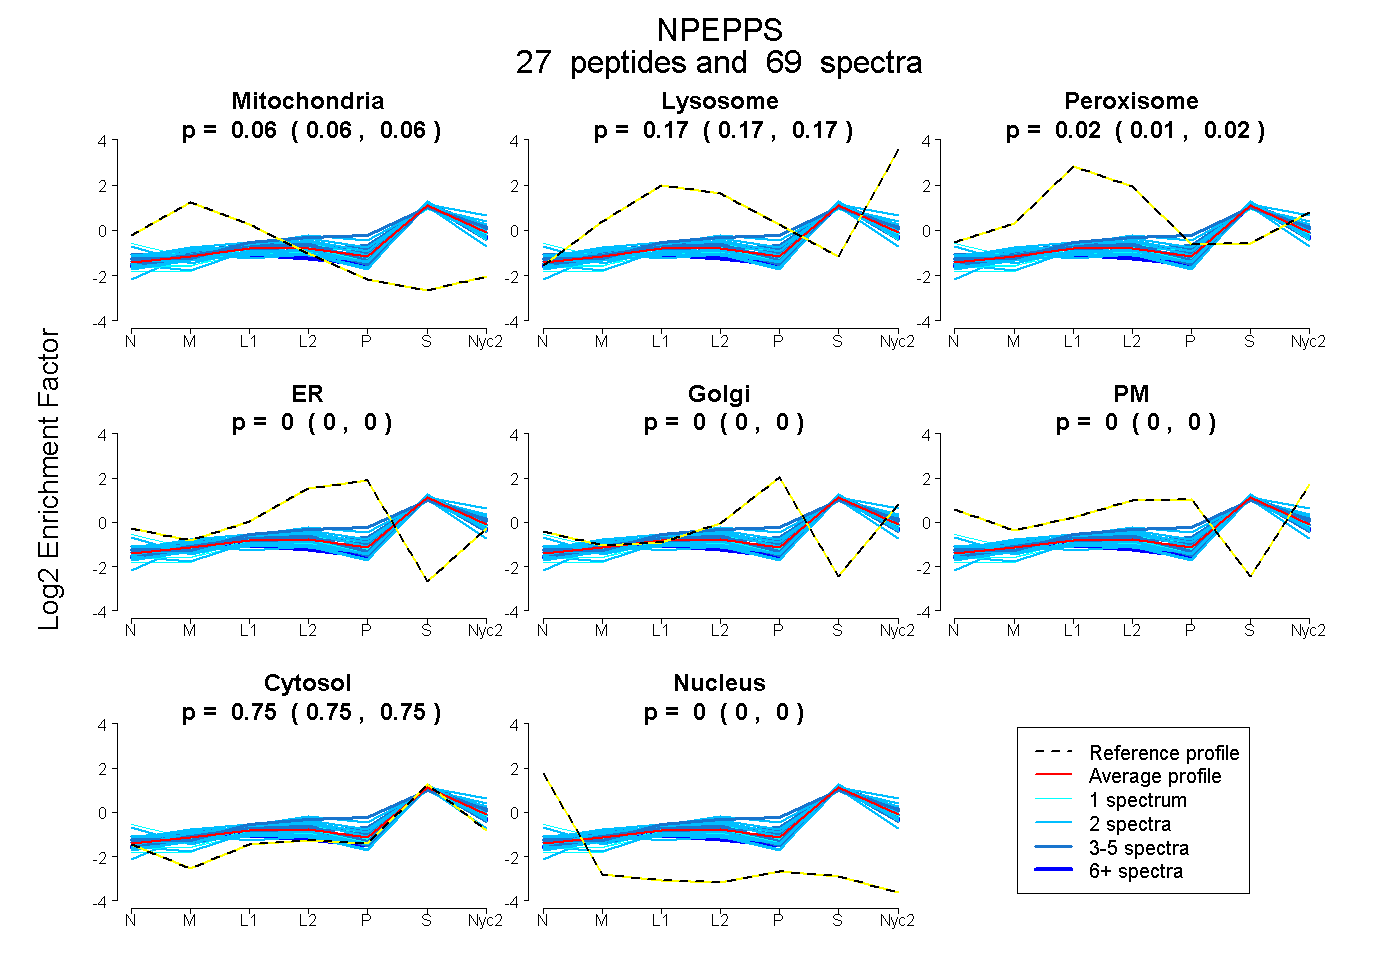
0.058 | 0.061
0.167 | 0.174
0.013 | 0.021
0.000 | 0.000
0.000 | 0.000
0.000 | 0.000
0.751 | 0.754
0.000 | 0.000
12peptides
spectra
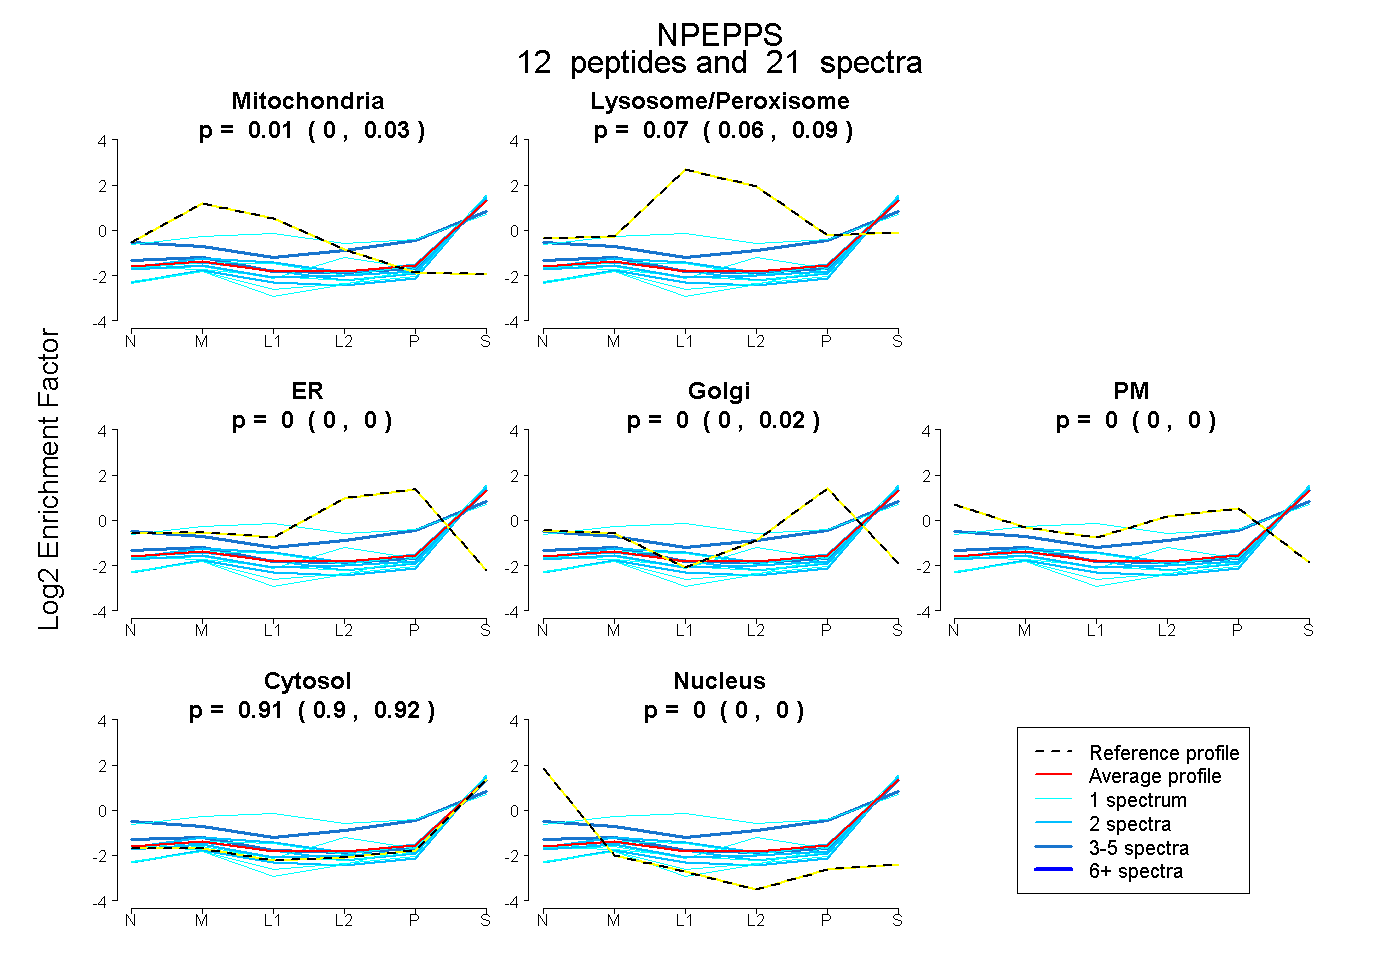
0.000 | 0.025
0.057 | 0.086
0.000 | 0.000
0.000 | 0.018
0.000 | 0.000
0.898 | 0.920
0.000 | 0.000
29peptides
spectra
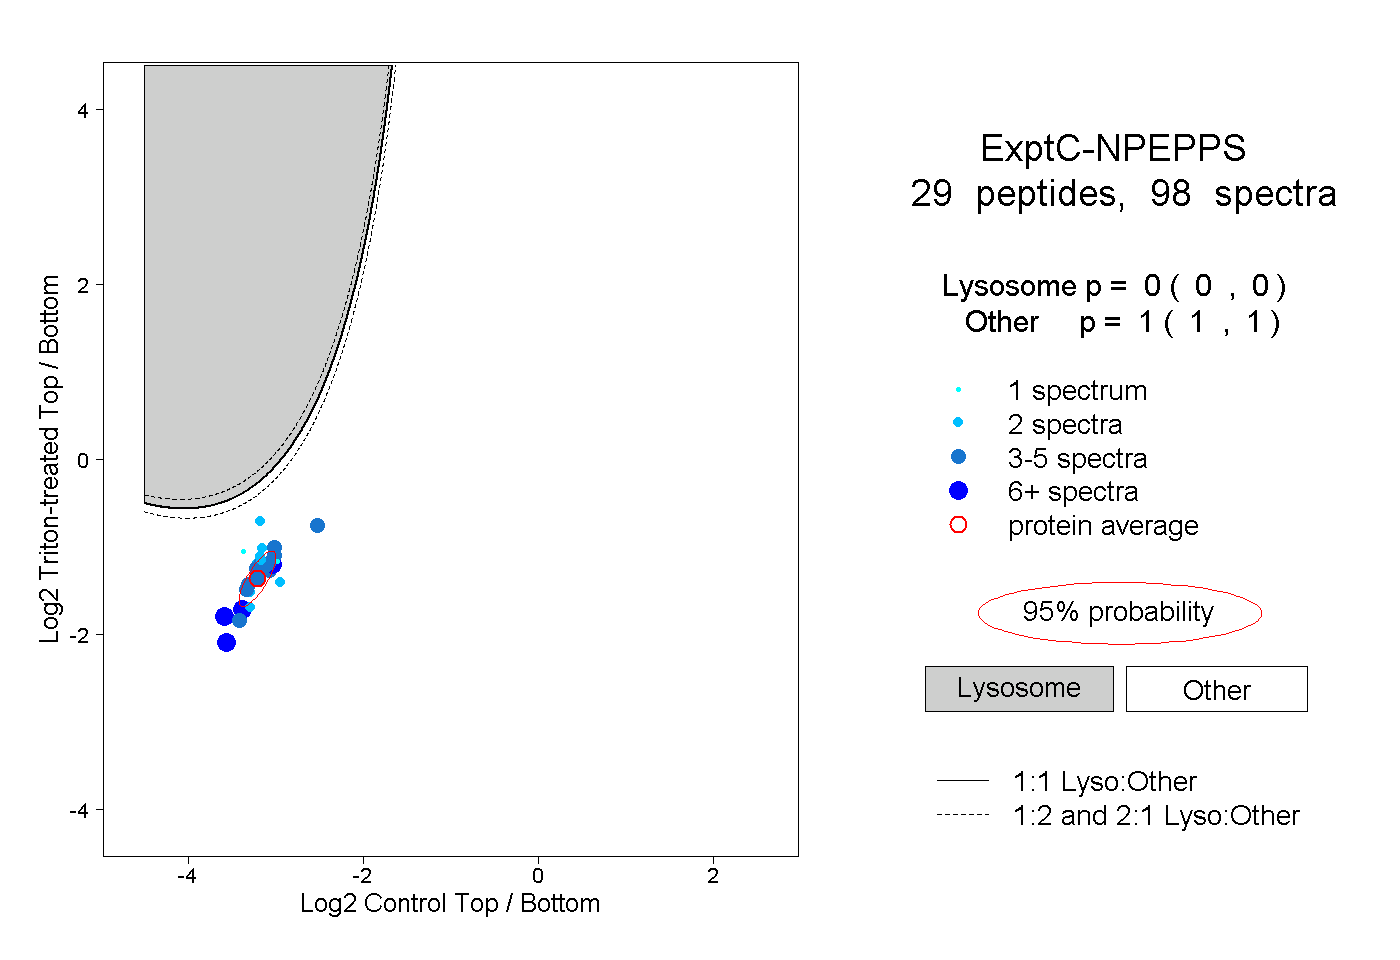
0.000 | 0.000
1.000 | 1.000
5peptides
spectra
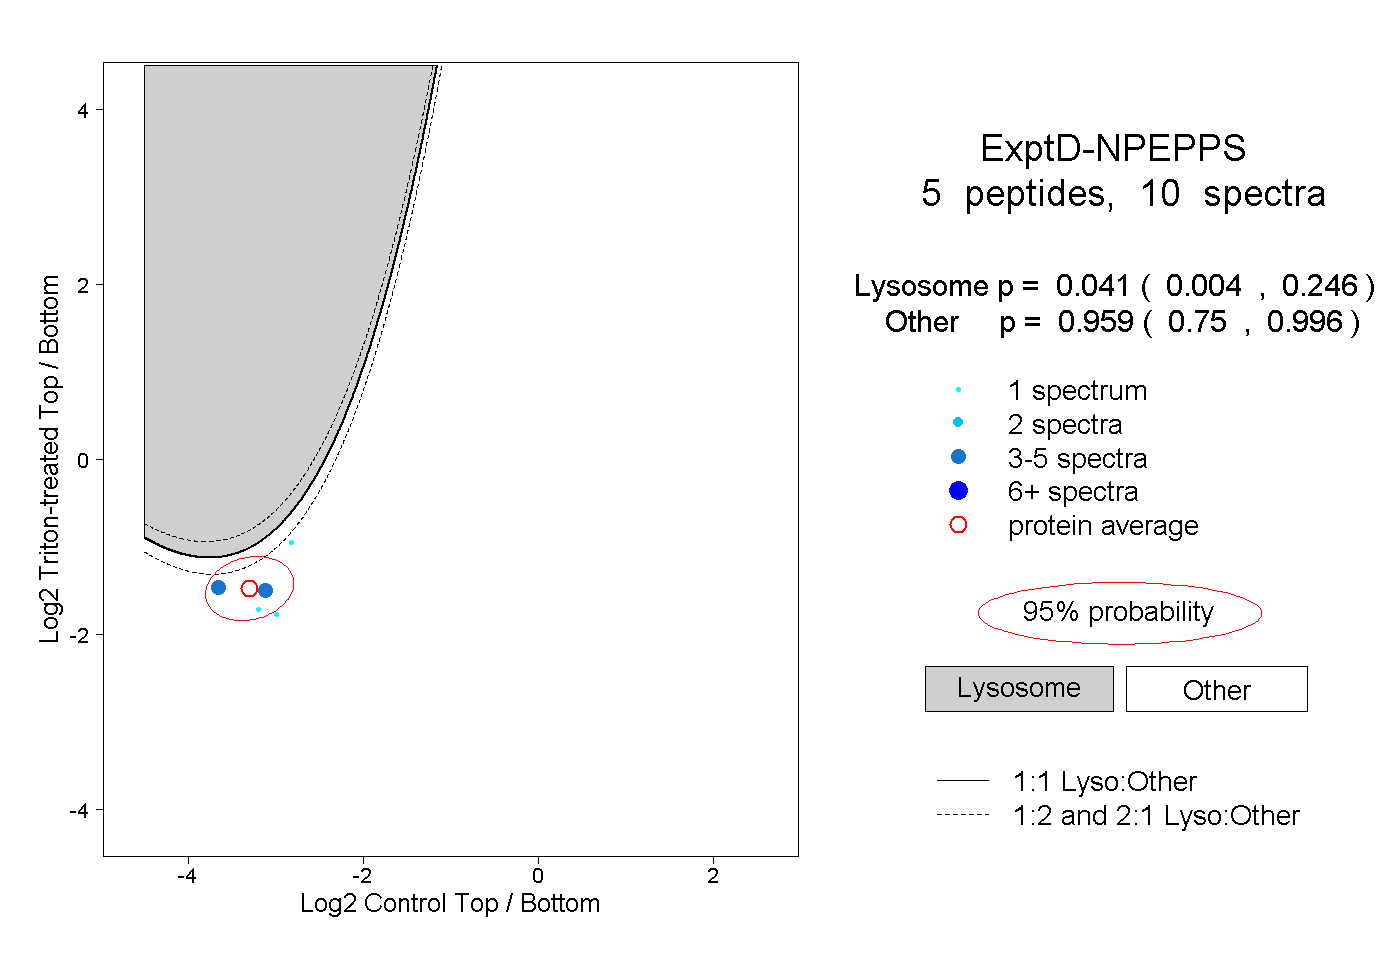
0.004 | 0.246
0.750 | 0.996