 27
27peptides
spectra
0.058 | 0.061
0.167 | 0.174
0.013 | 0.021
0.000 | 0.000
0.000 | 0.000
0.000 | 0.000
0.751 | 0.754
0.000 | 0.000
| Plot | Mito | Lyso | Perox | ER | Golgi | PM | Cytosol | Nucleus | |||||
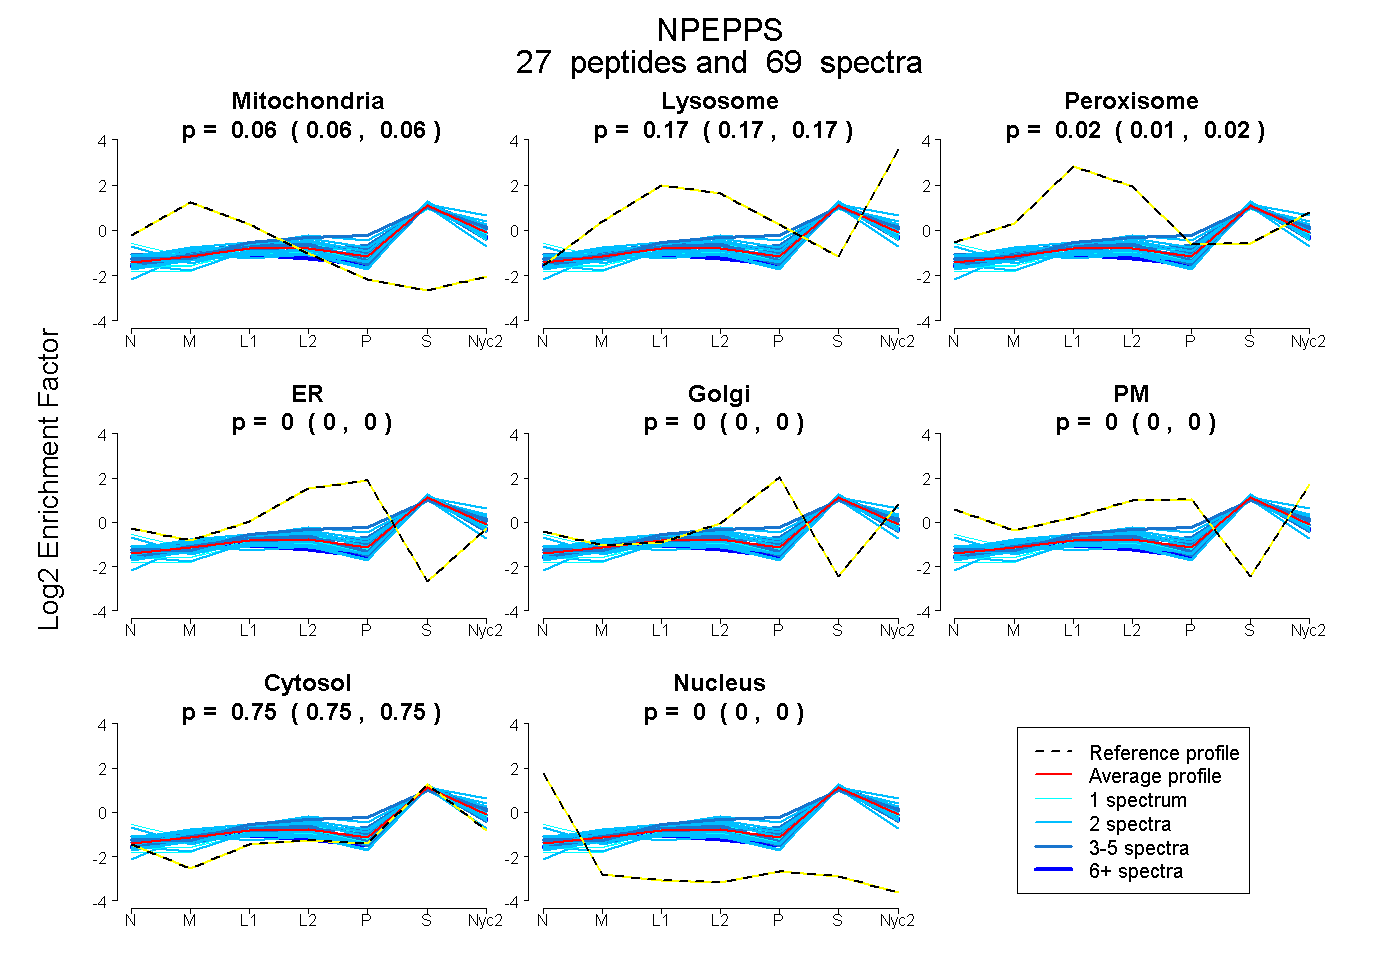
| Expt A |
27 peptides |
69 spectra |
|
0.060 0.058 | 0.061 |
0.171 0.167 | 0.174 |
0.017 0.013 | 0.021 |
0.000 0.000 | 0.000 |
0.000 0.000 | 0.000 |
0.000 0.000 | 0.000 |
0.752 0.751 | 0.754 |
0.000 0.000 | 0.000 |
| 4 spectra, MAGEVK | 0.055 | 0.228 | 0.000 | 0.000 | 0.000 | 0.000 | 0.717 | 0.000 | ||
| 1 spectrum, DYFNVPYPLPK | 0.000 | 0.099 | 0.030 | 0.000 | 0.000 | 0.000 | 0.872 | 0.000 | ||
| 2 spectra, AGIISTVEVLK | 0.102 | 0.000 | 0.102 | 0.000 | 0.000 | 0.015 | 0.781 | 0.000 | ||
| 2 spectra, YAAVTQFEATDAR | 0.037 | 0.161 | 0.000 | 0.000 | 0.000 | 0.000 | 0.802 | 0.000 | ||
| 1 spectrum, ILMDKPEMSVVLK | 0.023 | 0.140 | 0.000 | 0.000 | 0.000 | 0.000 | 0.838 | 0.000 | ||
| 2 spectra, SPVYLTVLK | 0.014 | 0.105 | 0.017 | 0.000 | 0.000 | 0.000 | 0.864 | 0.000 | ||
| 4 spectra, AFFESHPAPSAER | 0.063 | 0.122 | 0.114 | 0.000 | 0.000 | 0.000 | 0.701 | 0.000 | ||
| 2 spectra, TQYSSAMLESLLPGIR | 0.057 | 0.252 | 0.031 | 0.000 | 0.000 | 0.000 | 0.659 | 0.000 | ||
| 2 spectra, LSVEGFAVDK | 0.088 | 0.098 | 0.000 | 0.000 | 0.000 | 0.000 | 0.815 | 0.000 | ||
| 1 spectrum, HGDGTTLDIMLK | 0.023 | 0.039 | 0.108 | 0.000 | 0.000 | 0.133 | 0.697 | 0.000 | ||
| 2 spectra, DLSLPPVDR | 0.134 | 0.128 | 0.025 | 0.000 | 0.000 | 0.000 | 0.714 | 0.000 | ||
| 4 spectra, YTTPAGEVR | 0.000 | 0.171 | 0.095 | 0.000 | 0.079 | 0.000 | 0.655 | 0.000 | ||
| 2 spectra, YQGGFLISR | 0.057 | 0.119 | 0.000 | 0.000 | 0.000 | 0.000 | 0.825 | 0.000 | ||
| 1 spectrum, VYTPVGK | 0.000 | 0.125 | 0.057 | 0.000 | 0.000 | 0.000 | 0.818 | 0.000 | ||
| 4 spectra, VALSNMNVIDR | 0.046 | 0.183 | 0.037 | 0.000 | 0.000 | 0.000 | 0.733 | 0.000 | ||
| 4 spectra, DVFSPIGER | 0.073 | 0.104 | 0.031 | 0.000 | 0.000 | 0.000 | 0.793 | 0.000 | ||
| 2 spectra, LGLQNDLFSLAR | 0.022 | 0.172 | 0.000 | 0.000 | 0.000 | 0.000 | 0.806 | 0.000 | ||
| 4 spectra, LNLGTVGFYR | 0.020 | 0.219 | 0.000 | 0.000 | 0.000 | 0.000 | 0.761 | 0.000 | ||
| 2 spectra, QADMQEEK | 0.006 | 0.219 | 0.076 | 0.000 | 0.000 | 0.003 | 0.695 | 0.000 | ||
| 2 spectra, ETALLIDPK | 0.149 | 0.126 | 0.000 | 0.000 | 0.000 | 0.000 | 0.725 | 0.000 | ||
| 1 spectrum, LEAAAQVR | 0.000 | 0.233 | 0.000 | 0.000 | 0.000 | 0.000 | 0.767 | 0.000 | ||
| 3 spectra, IDFVGELNDK | 0.084 | 0.164 | 0.008 | 0.000 | 0.000 | 0.000 | 0.744 | 0.000 | ||
| 2 spectra, QILSADLR | 0.098 | 0.156 | 0.043 | 0.000 | 0.000 | 0.000 | 0.704 | 0.000 | ||
| 8 spectra, DNWEELYNR | 0.114 | 0.105 | 0.000 | 0.000 | 0.000 | 0.000 | 0.781 | 0.000 | ||
| 2 spectra, VLGATLSPELIQK | 0.000 | 0.115 | 0.143 | 0.065 | 0.000 | 0.000 | 0.676 | 0.000 | ||
| 3 spectra, ATLEEAR | 0.068 | 0.165 | 0.058 | 0.000 | 0.000 | 0.000 | 0.709 | 0.000 | ||
| 2 spectra, TLPFYK | 0.000 | 0.279 | 0.000 | 0.000 | 0.000 | 0.000 | 0.721 | 0.000 |
| Plot | Mito | Lyso or Perox | ER | Golgi | PM | Cytosol | Nucleus | ||||||
| Expt B |
12 peptides |
21 spectra |
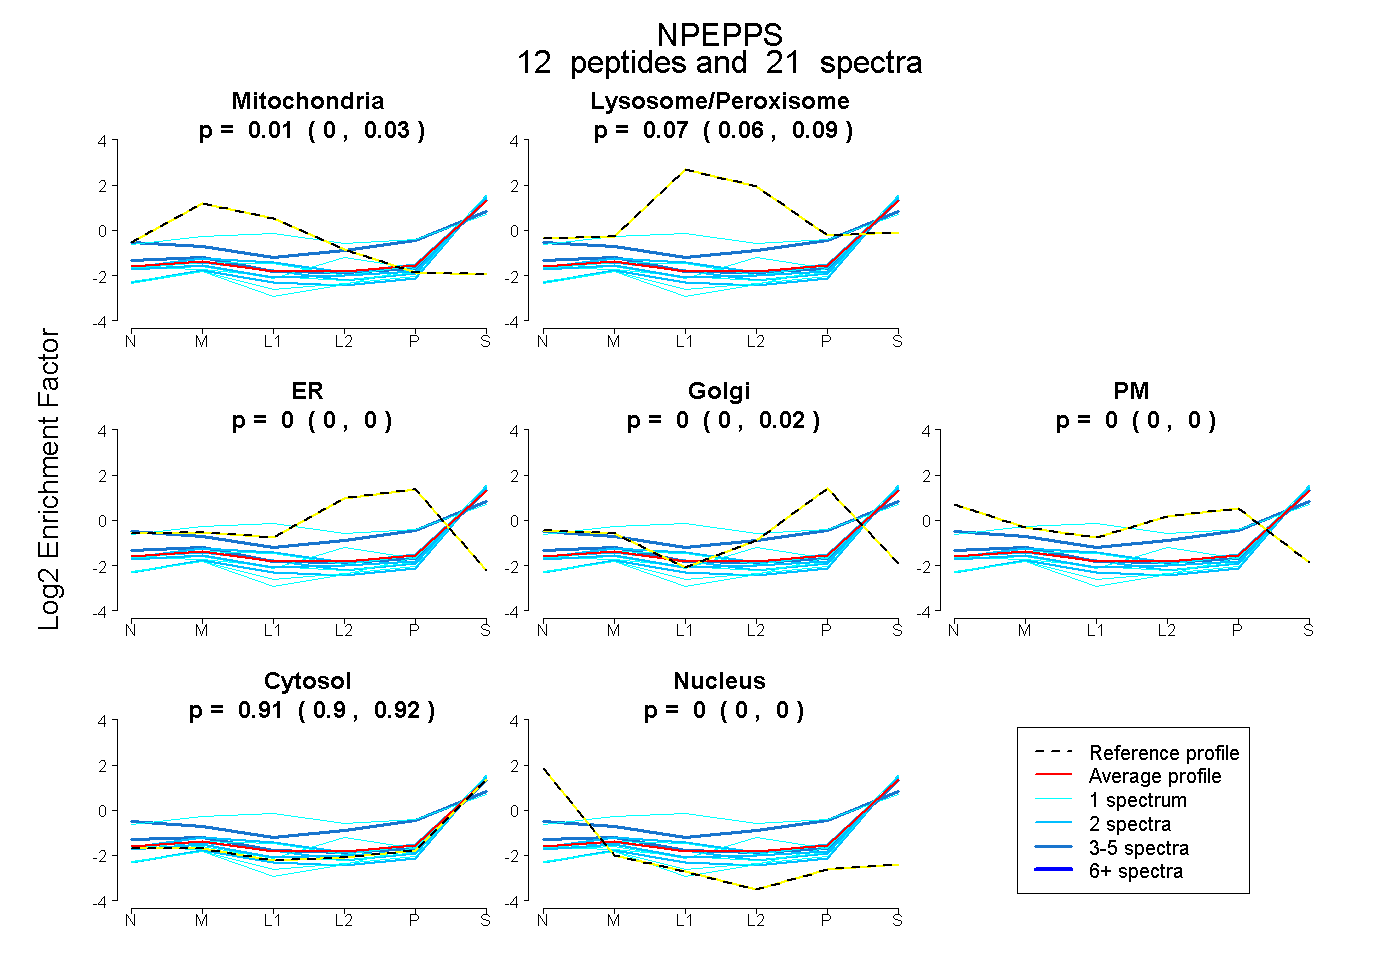 |
0.013 0.000 | 0.025 |
0.072 0.057 | 0.086 |
0.000 0.000 | 0.000 |
0.003 0.000 | 0.018 |
0.000 0.000 | 0.000 |
0.912 0.898 | 0.920 |
0.000 0.000 | 0.000 |
|||
| Plot | Lyso | Other | |||||||||||
| Expt C |
29 peptides |
98 spectra |
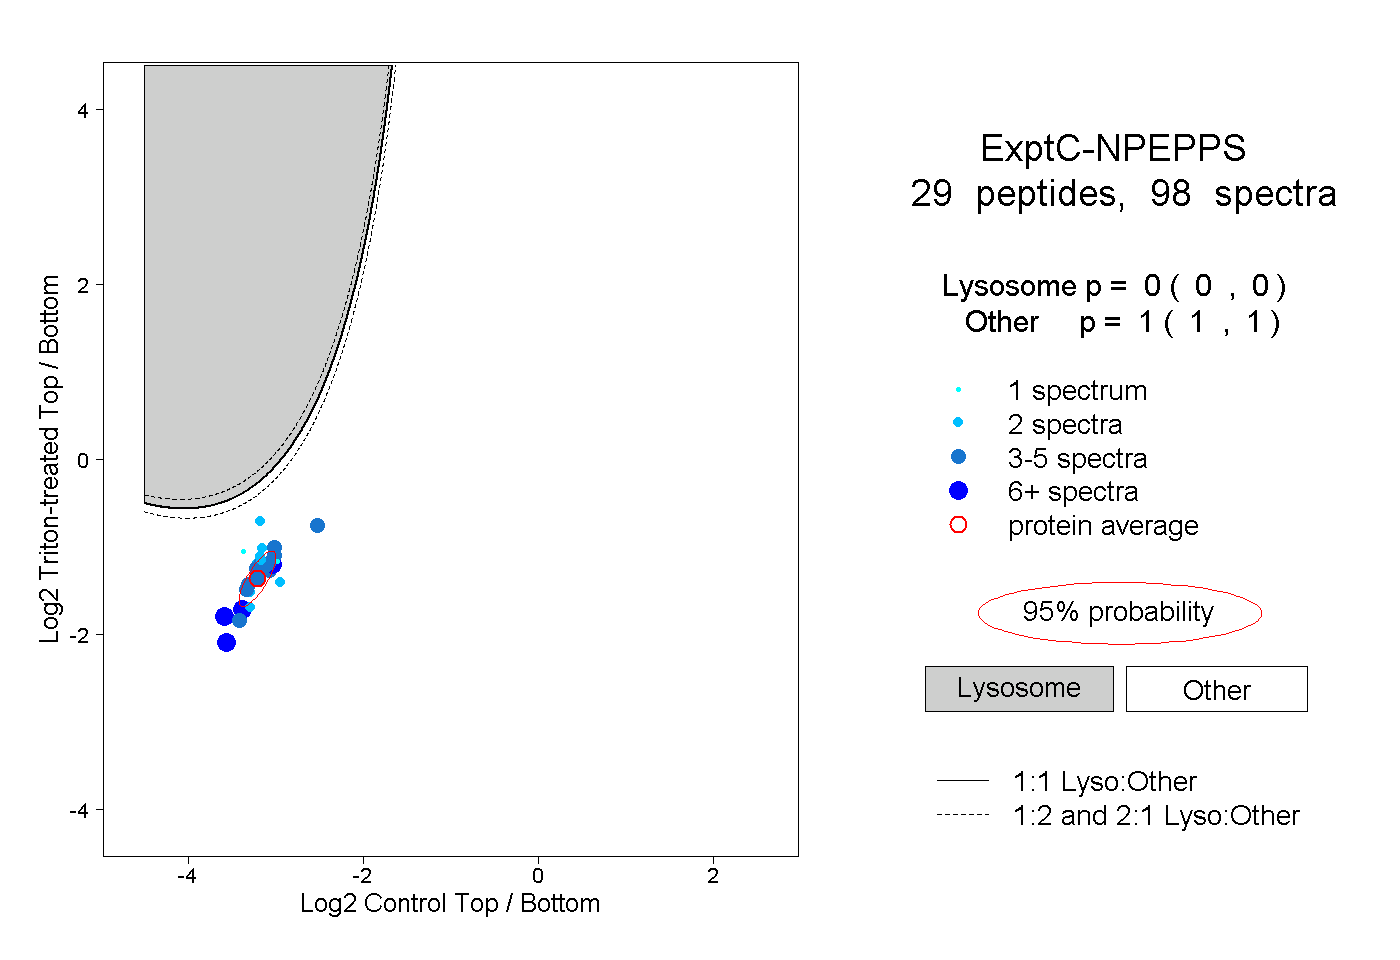 |
0.000 0.000 | 0.000 |
1.000 1.000 | 1.000 |
||||||||
| Plot | Lyso | Other | |||||||||||
| Expt D |
5 peptides |
10 spectra |
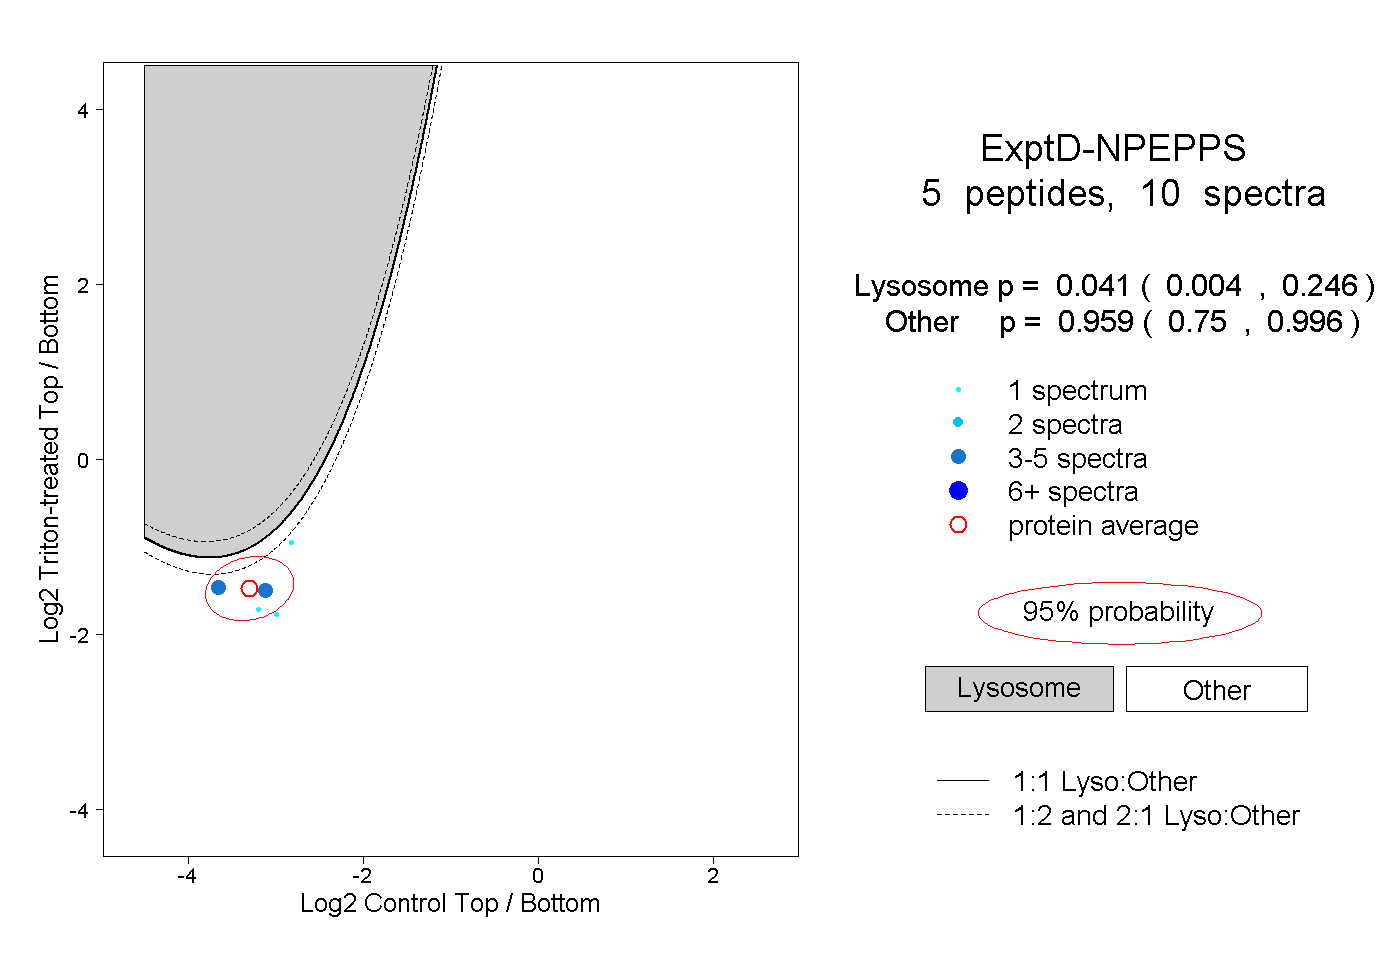 |
0.041 0.004 | 0.246 |
0.959 0.750 | 0.996 |