| 1 spectrum, VALSNMNVIDR |
0.001 |
|
0.097 |
|
0.000 |
0.000 |
0.000 |
0.902 |
0.000 |
|
| 3 spectra, LGLQNDLFSLAR |
0.063 |
|
0.050 |
|
0.000 |
0.000 |
0.000 |
0.887 |
0.000 |
|
| 2 spectra, DVFSPIGER |
0.049 |
|
0.009 |
|
0.000 |
0.000 |
0.000 |
0.941 |
0.000 |
|
| 2 spectra, LGWDPKPGEGHLDALLR |
0.023 |
|
0.110 |
|
0.000 |
0.000 |
0.000 |
0.867 |
0.000 |
|
| 2 spectra, IDFVGELNDK |
0.000 |
|
0.000 |
|
0.000 |
0.000 |
0.000 |
1.000 |
0.000 |
|
| 1 spectrum, DADSIHQYLLQR |
0.049 |
|
0.377 |
|
0.000 |
0.126 |
0.020 |
0.428 |
0.000 |
|
| 1 spectrum, YAAVTQFEATDAR |
0.000 |
|
0.078 |
|
0.008 |
0.000 |
0.000 |
0.914 |
0.000 |
|
| 4 spectra, AFFESHPAPSAER |
0.000 |
|
0.160 |
|
0.000 |
0.045 |
0.235 |
0.560 |
0.000 |
|
| 1 spectrum, LSVEGFAVDK |
0.000 |
|
0.000 |
|
0.000 |
0.000 |
0.000 |
1.000 |
0.000 |
|
| 2 spectra, YTTPAGEVR |
0.000 |
|
0.019 |
|
0.000 |
0.000 |
0.000 |
0.981 |
0.000 |
|
| 1 spectrum, YQGGFLISR |
0.000 |
|
0.000 |
|
0.000 |
0.000 |
0.000 |
1.000 |
0.000 |
|
| 1 spectrum, VLGATLSPELIQK |
0.000 |
|
0.003 |
|
0.000 |
0.000 |
0.000 |
0.994 |
0.003 |
|
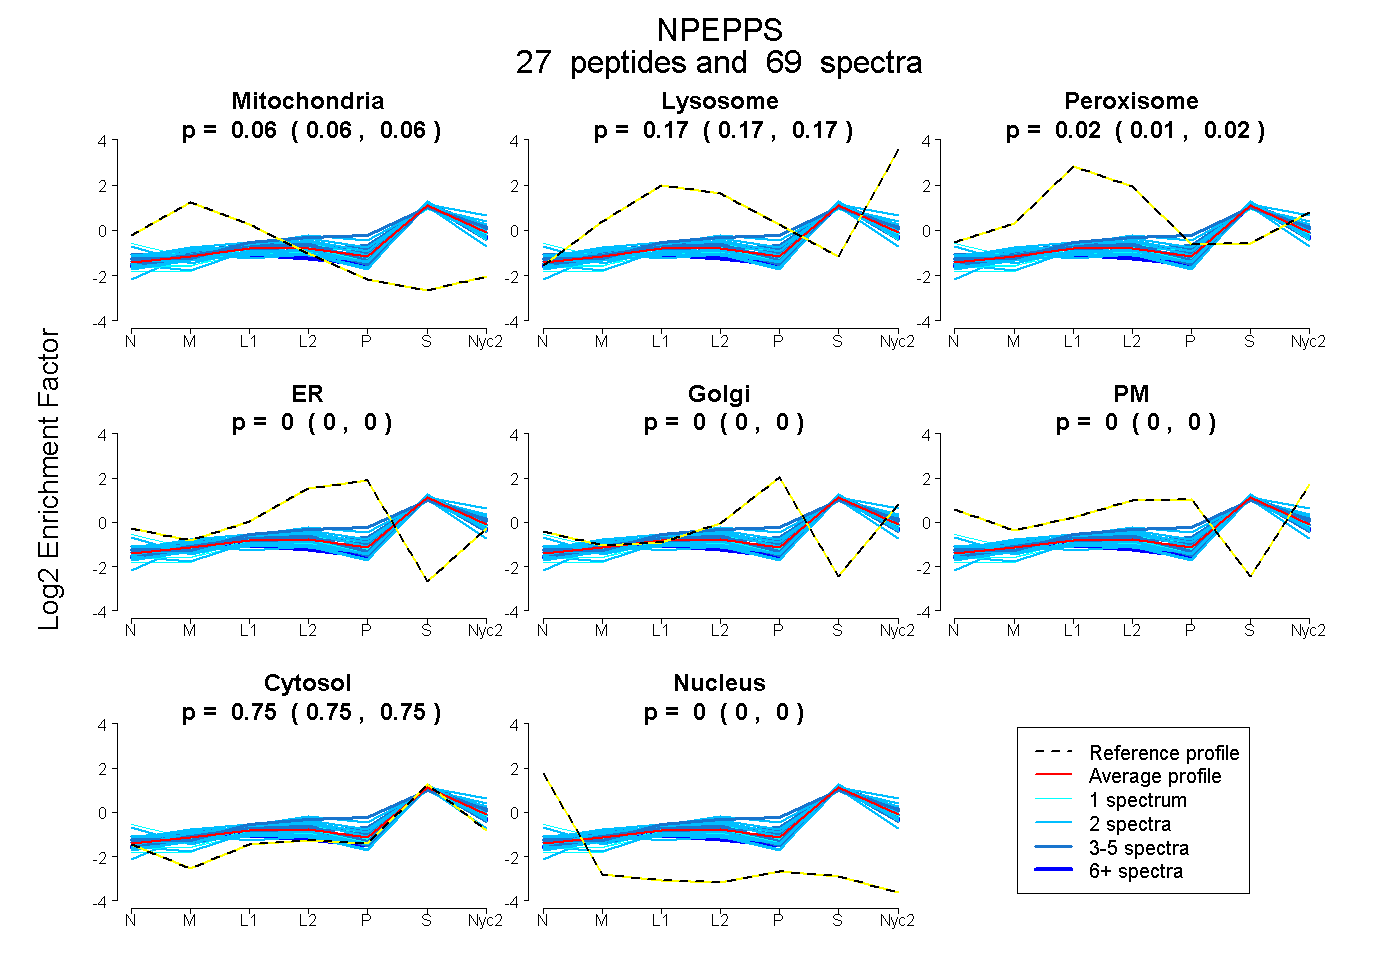
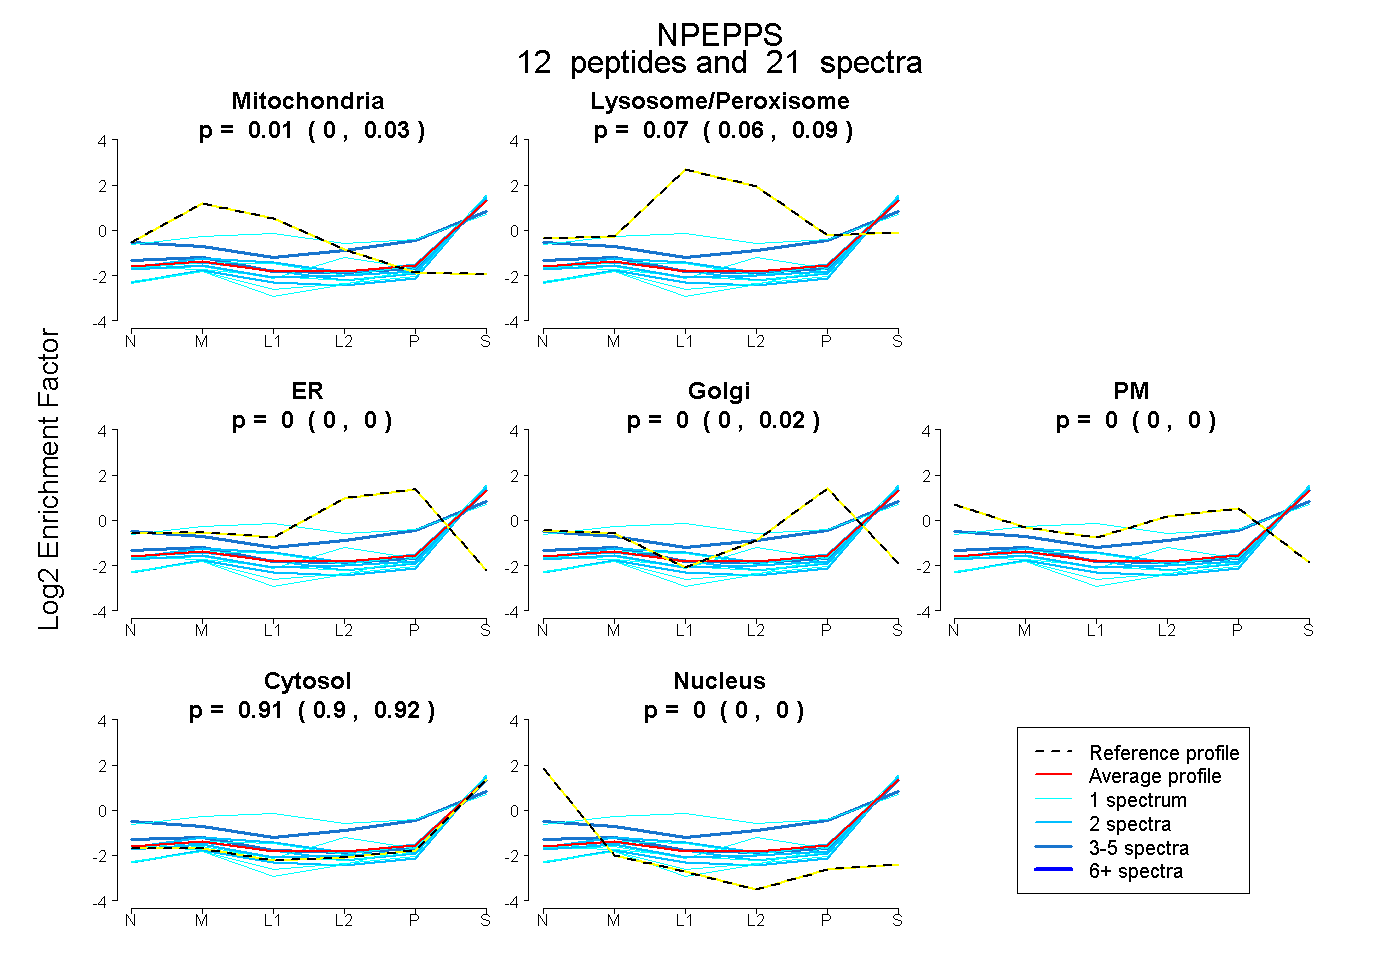
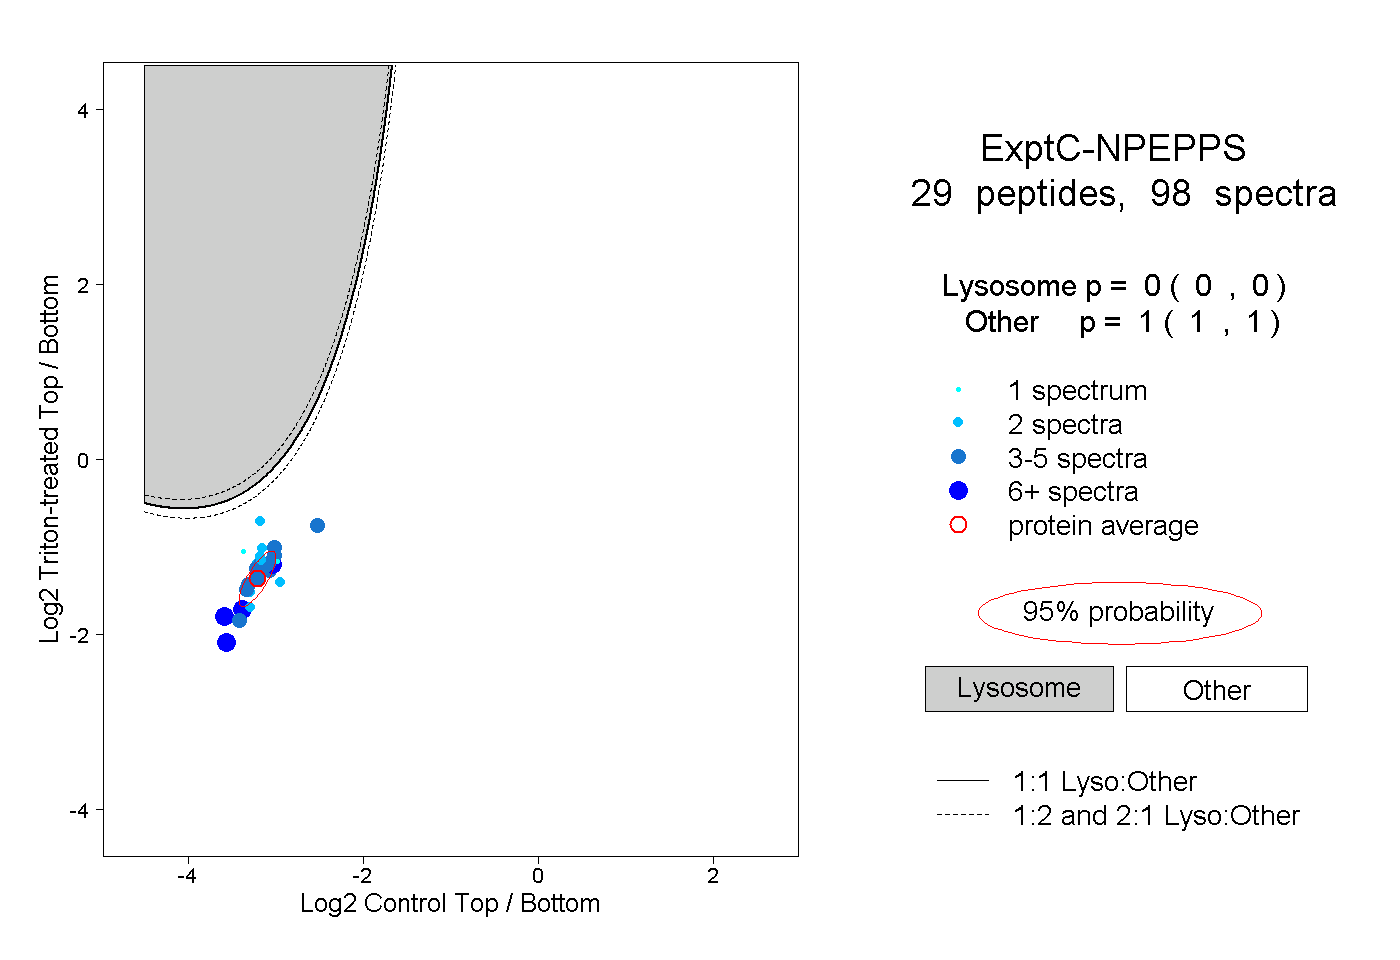
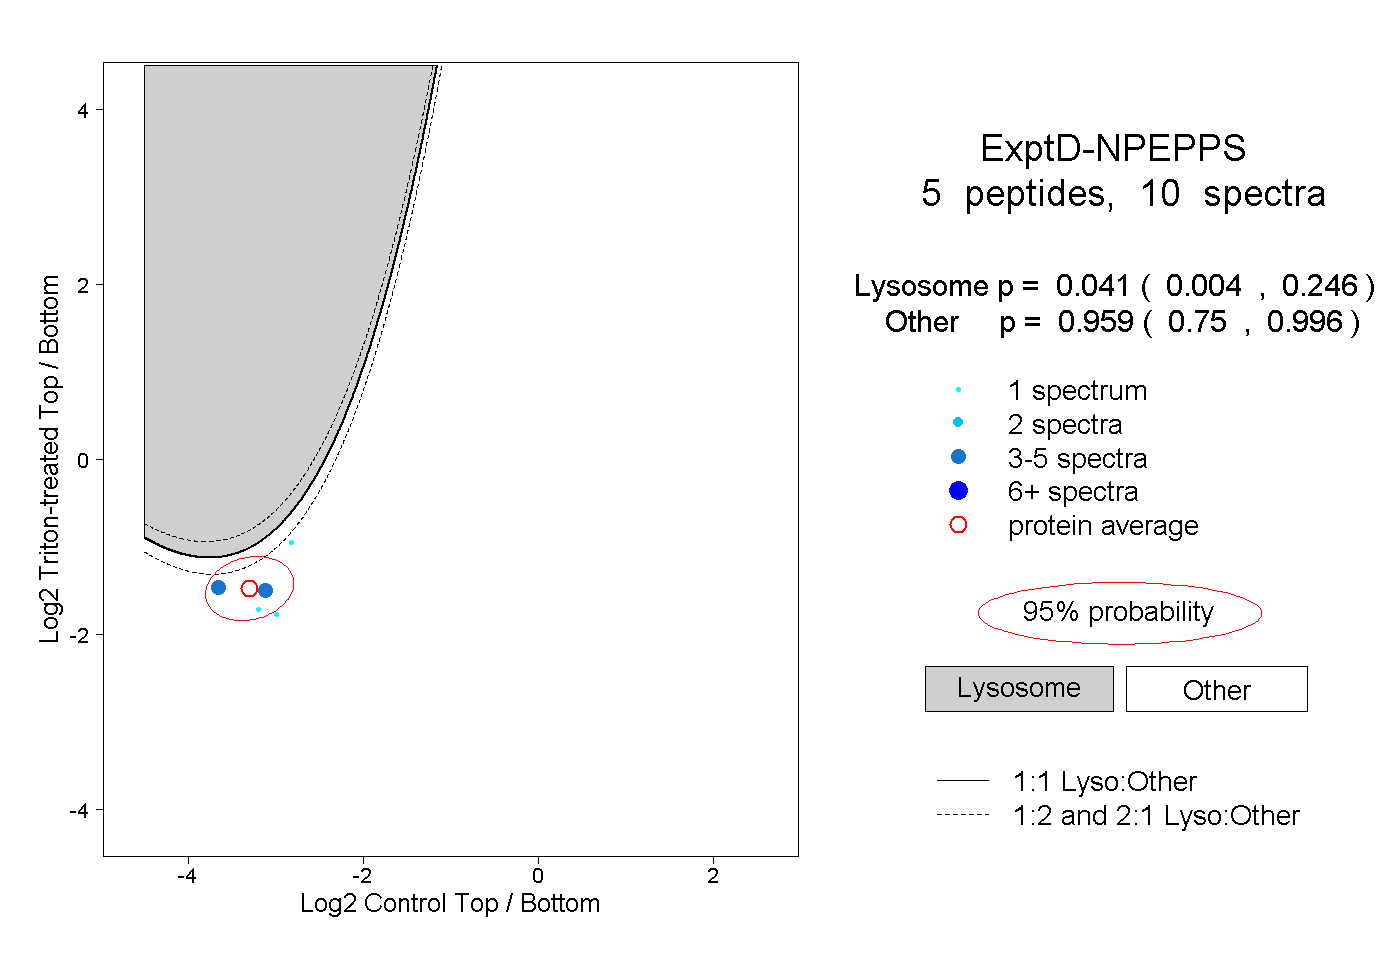
 27
27