 8
8peptides
spectra
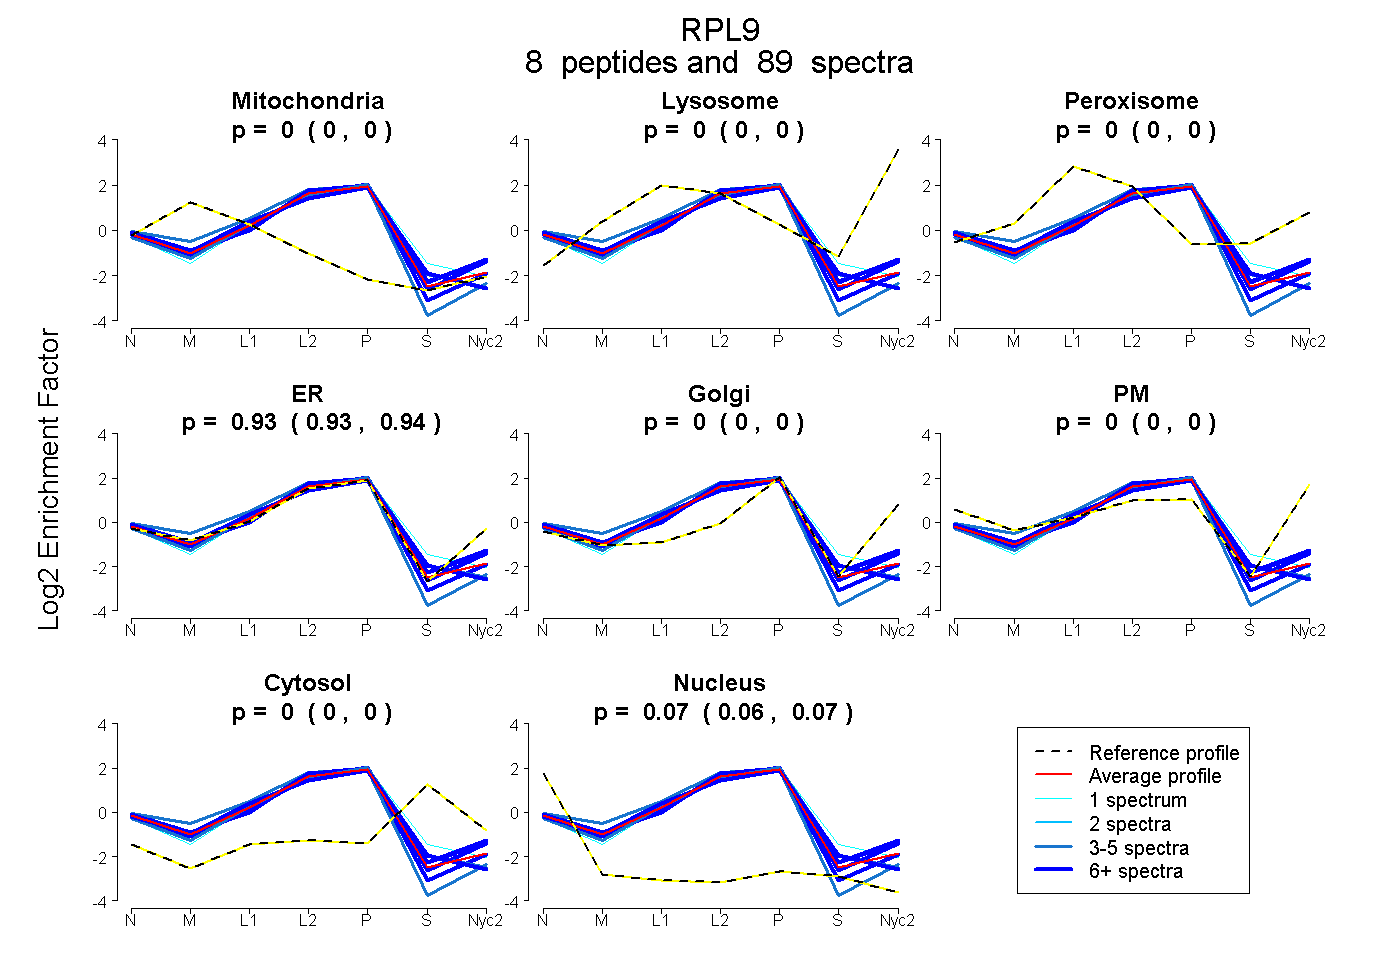
0.000 | 0.000
0.000 | 0.000
0.000 | 0.000
0.931 | 0.935
0.000 | 0.000
0.000 | 0.000
0.000 | 0.000
0.064 | 0.069
8peptides
spectra
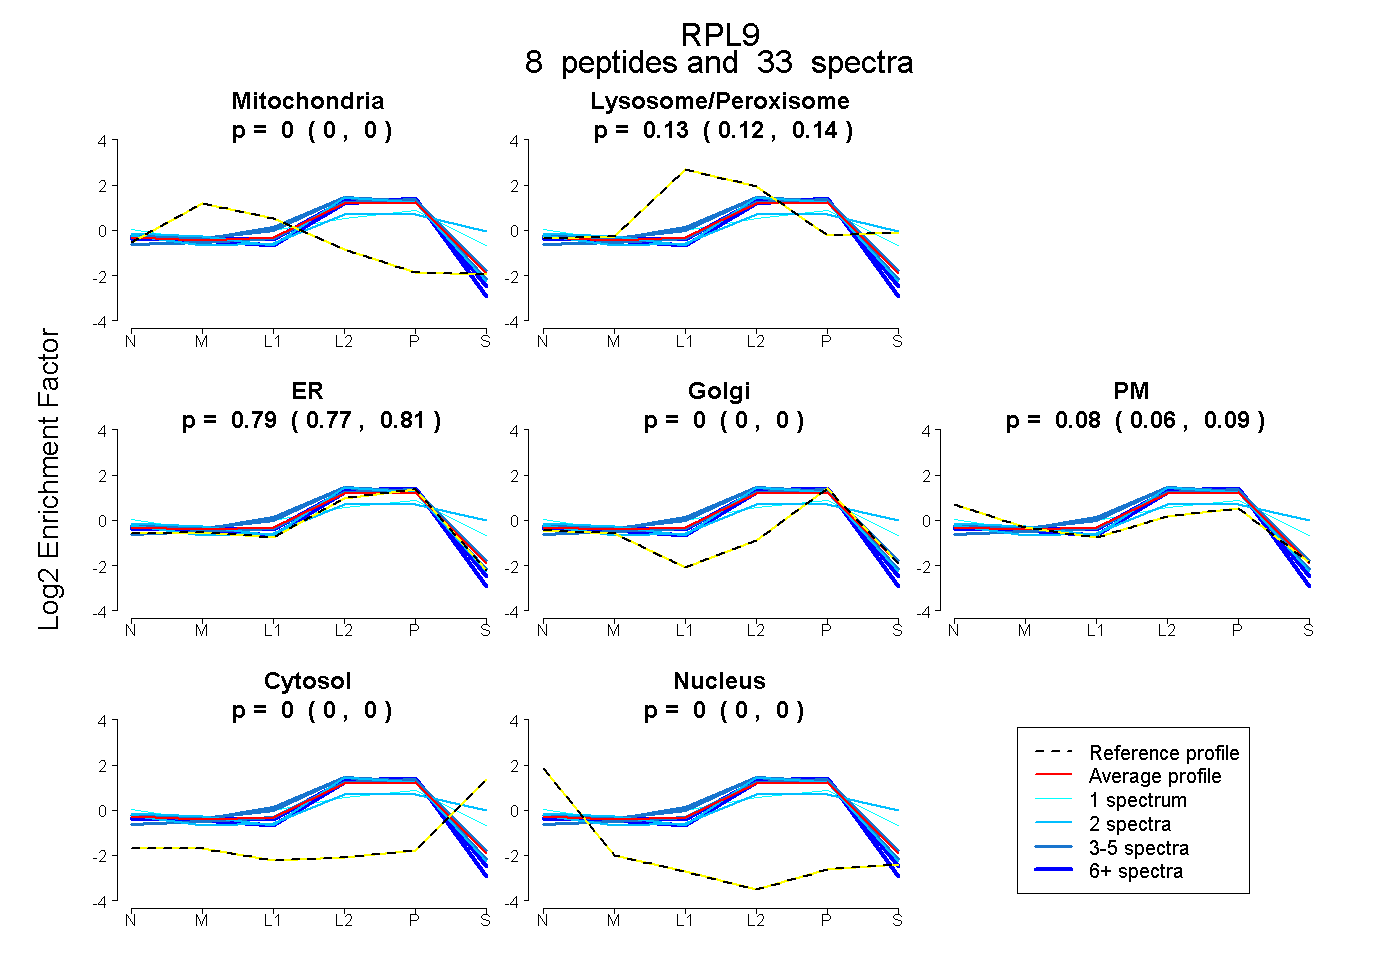
0.000 | 0.000
0.117 | 0.141
0.772 | 0.813
0.000 | 0.000
0.058 | 0.091
0.000 | 0.000
0.000 | 0.000
8peptides
spectra
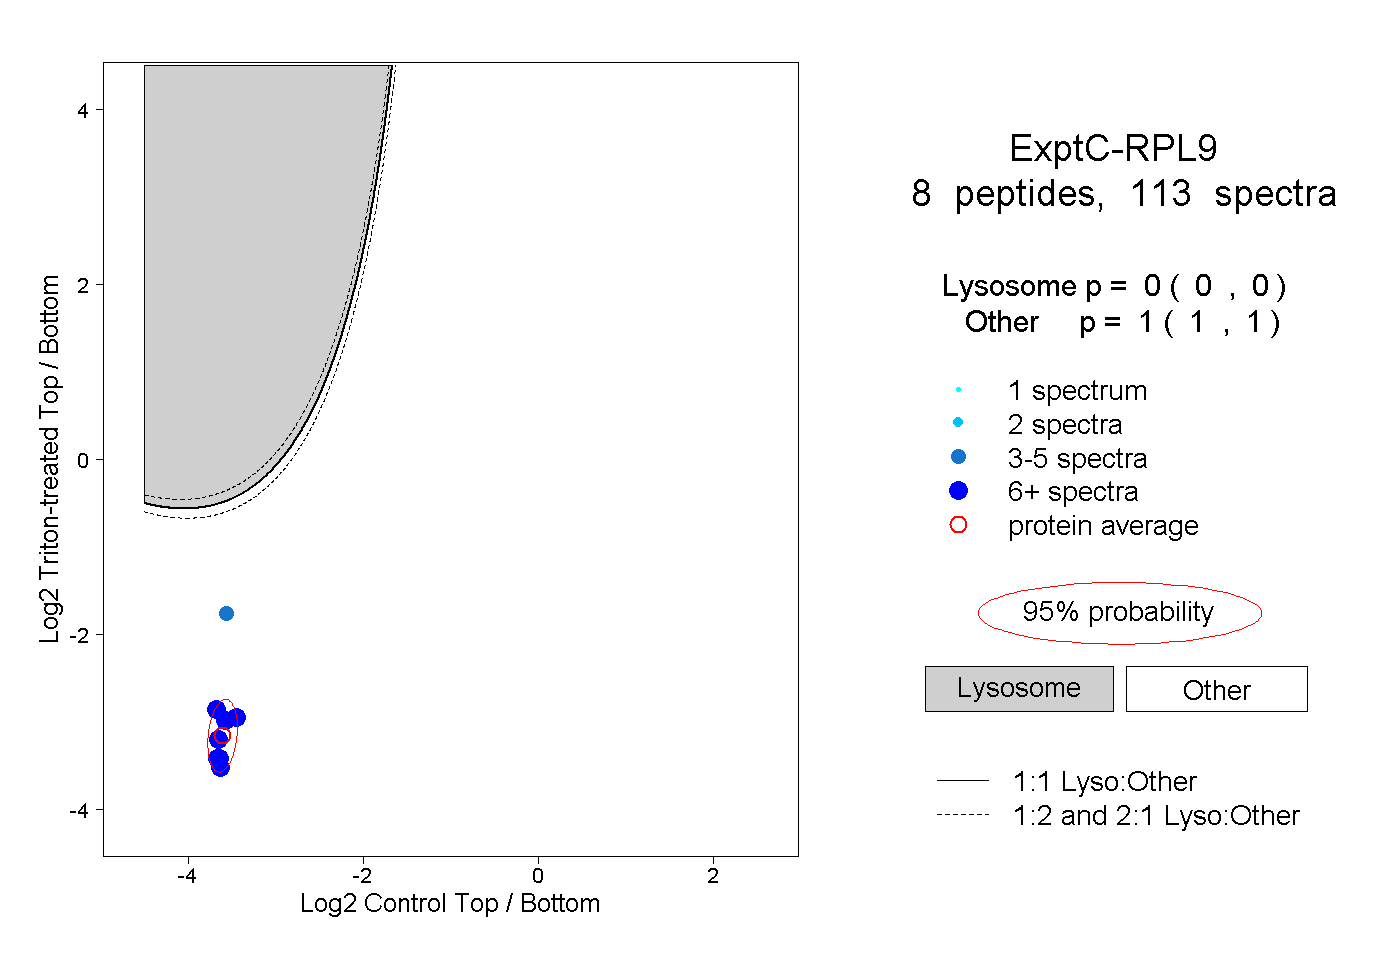
0.000 | 0.000
1.000 | 1.000
6peptides
spectra
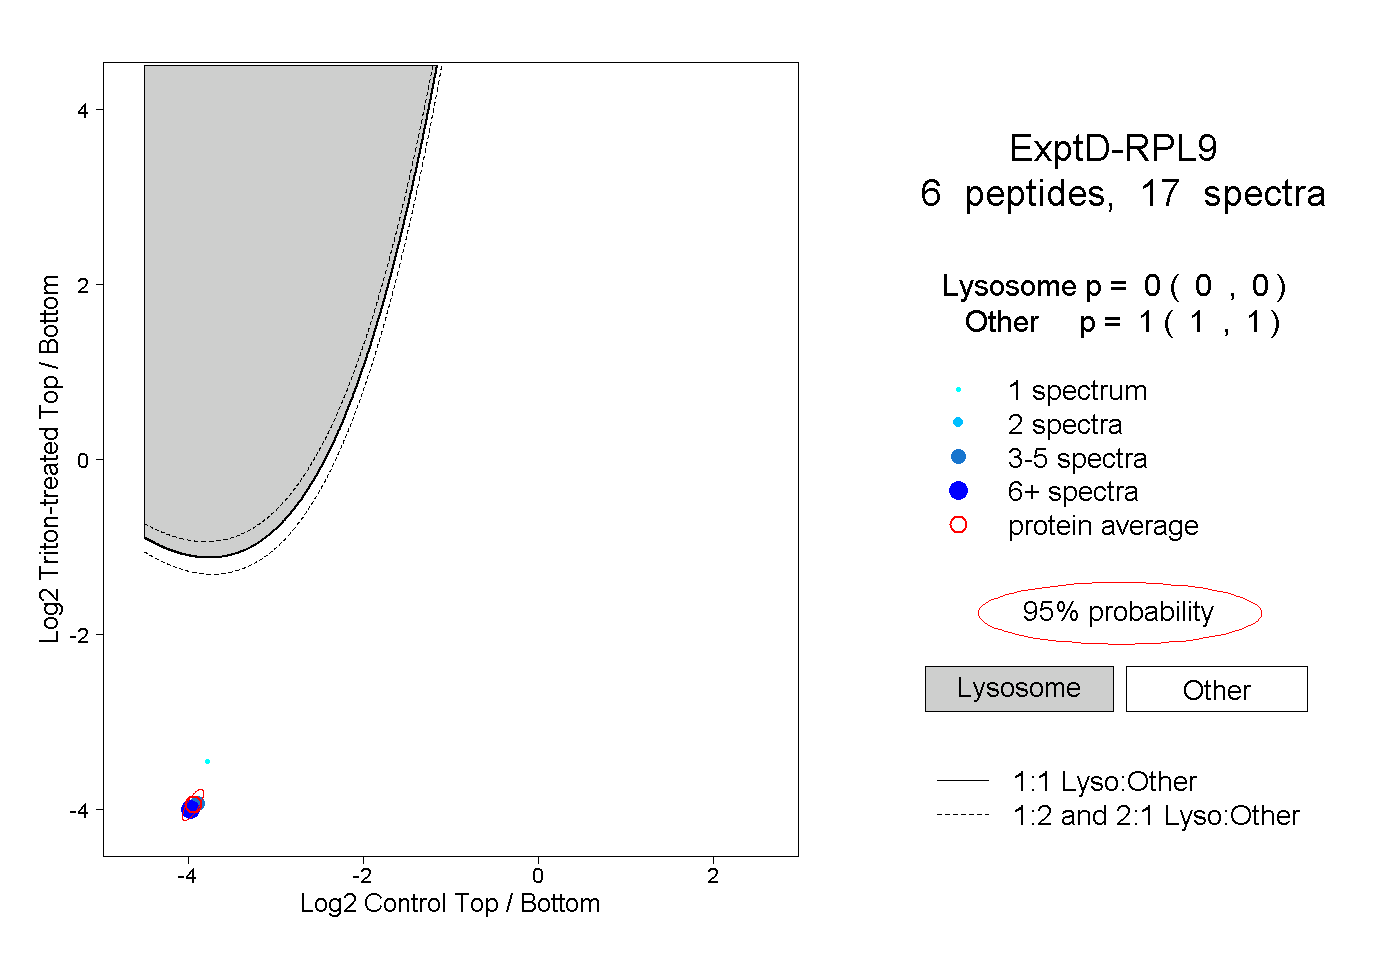
0.000 | 0.000
1.000 | 1.000