 8
8peptides
spectra
0.000 | 0.000
0.000 | 0.000
0.000 | 0.000
0.931 | 0.935
0.000 | 0.000
0.000 | 0.000
0.000 | 0.000
0.064 | 0.069
| Plot | Mito | Lyso | Perox | ER | Golgi | PM | Cytosol | Nucleus | |||||
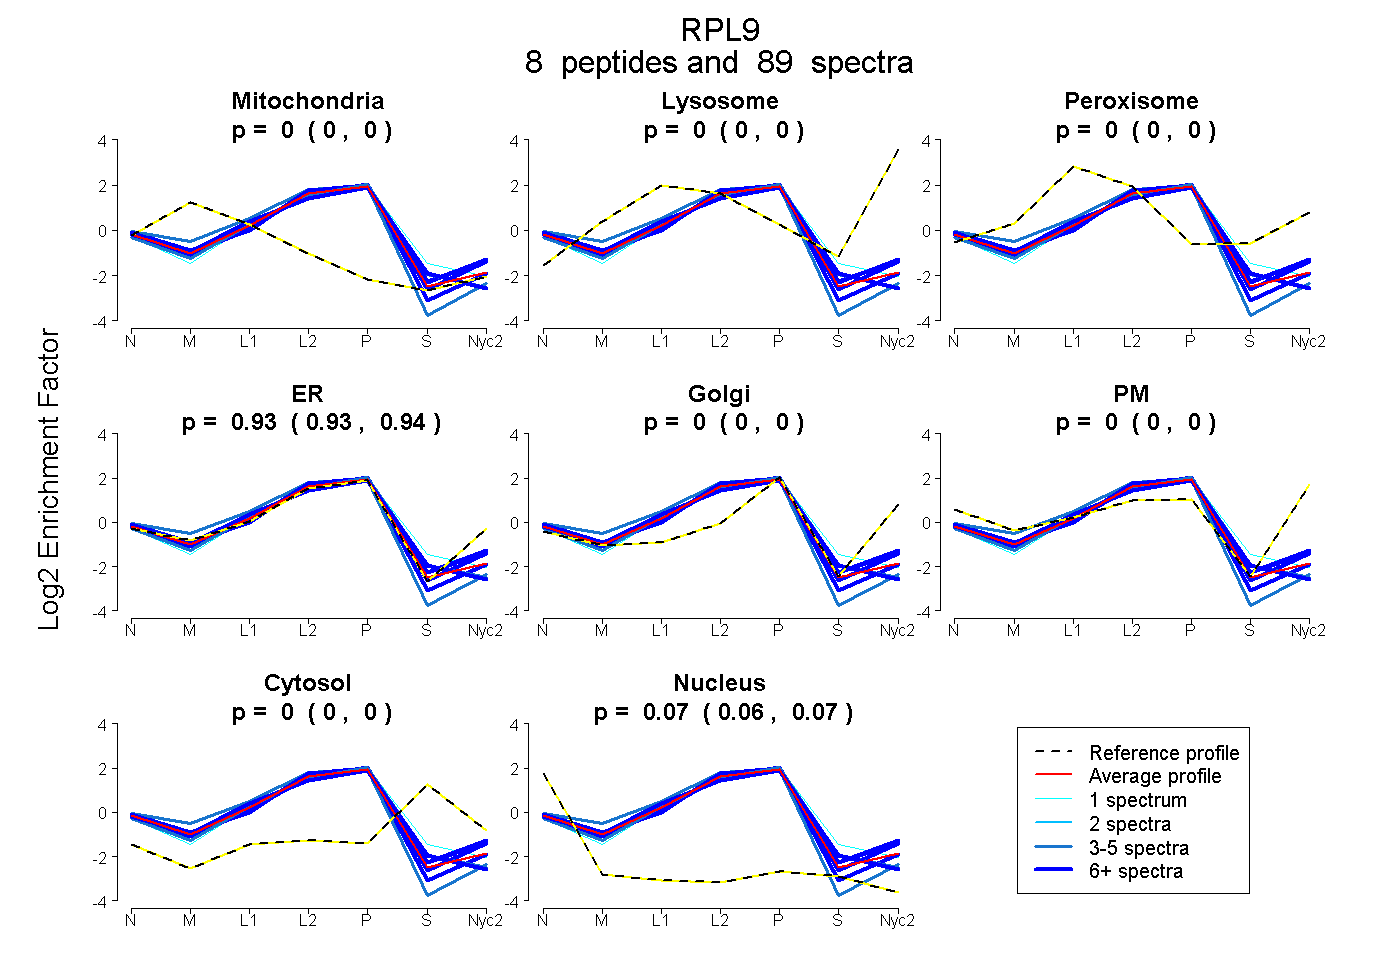
| Expt A |
8 peptides |
89 spectra |
|
0.000 0.000 | 0.000 |
0.000 0.000 | 0.000 |
0.000 0.000 | 0.000 |
0.933 0.931 | 0.935 |
0.000 0.000 | 0.000 |
0.000 0.000 | 0.000 |
0.000 0.000 | 0.000 |
0.067 0.064 | 0.069 |
| 4 spectra, TGVACSVSQAQK | 0.000 | 0.000 | 0.000 | 0.886 | 0.000 | 0.000 | 0.028 | 0.086 | ||
| 15 spectra, TICSHVQNMIK | 0.051 | 0.000 | 0.000 | 0.858 | 0.000 | 0.000 | 0.015 | 0.076 | ||
| 1 spectrum, DFNHINVELSLLGK | 0.000 | 0.000 | 0.000 | 0.857 | 0.000 | 0.000 | 0.134 | 0.009 | ||
| 9 spectra, NFLGEK | 0.000 | 0.000 | 0.000 | 0.955 | 0.000 | 0.000 | 0.001 | 0.044 | ||
| 4 spectra, GTVQQPDE | 0.100 | 0.000 | 0.000 | 0.882 | 0.000 | 0.000 | 0.000 | 0.017 | ||
| 21 spectra, ELATVR | 0.000 | 0.000 | 0.000 | 0.946 | 0.000 | 0.000 | 0.013 | 0.041 | ||
| 13 spectra, FLDGIYVSEK | 0.000 | 0.000 | 0.000 | 0.930 | 0.000 | 0.000 | 0.000 | 0.070 | ||
| 22 spectra, GVTLGFR | 0.000 | 0.000 | 0.000 | 0.950 | 0.000 | 0.000 | 0.000 | 0.050 |
| Plot | Mito | Lyso or Perox | ER | Golgi | PM | Cytosol | Nucleus | ||||||
| Expt B |
8 peptides |
33 spectra |
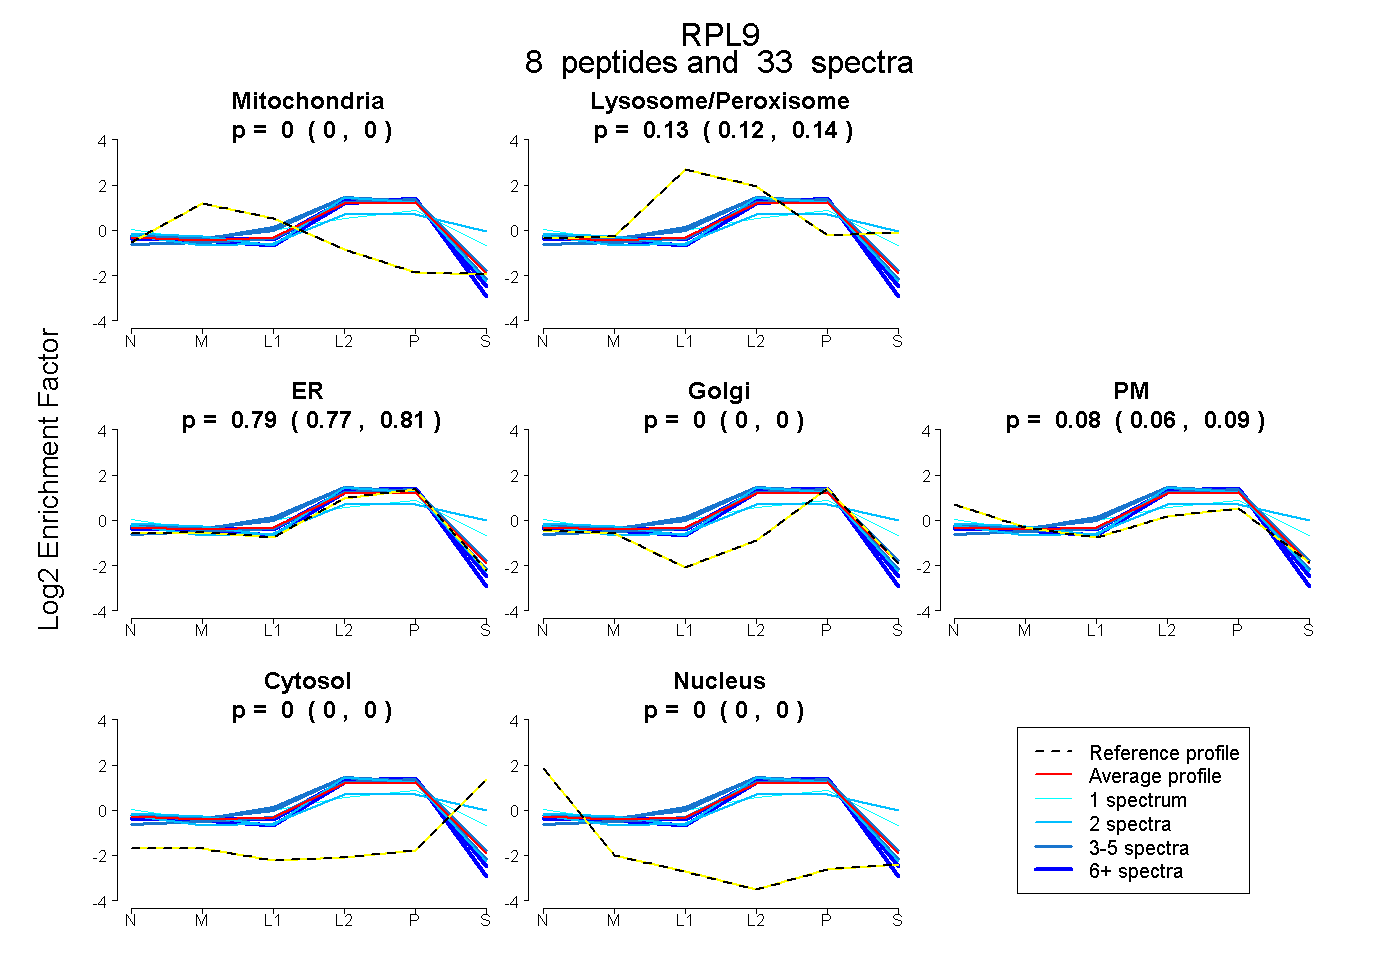 |
0.000 0.000 | 0.000 |
0.130 0.117 | 0.141 |
0.794 0.772 | 0.813 |
0.000 0.000 | 0.000 |
0.076 0.058 | 0.091 |
0.000 0.000 | 0.000 |
0.000 0.000 | 0.000 |
|||
| Plot | Lyso | Other | |||||||||||
| Expt C |
8 peptides |
113 spectra |
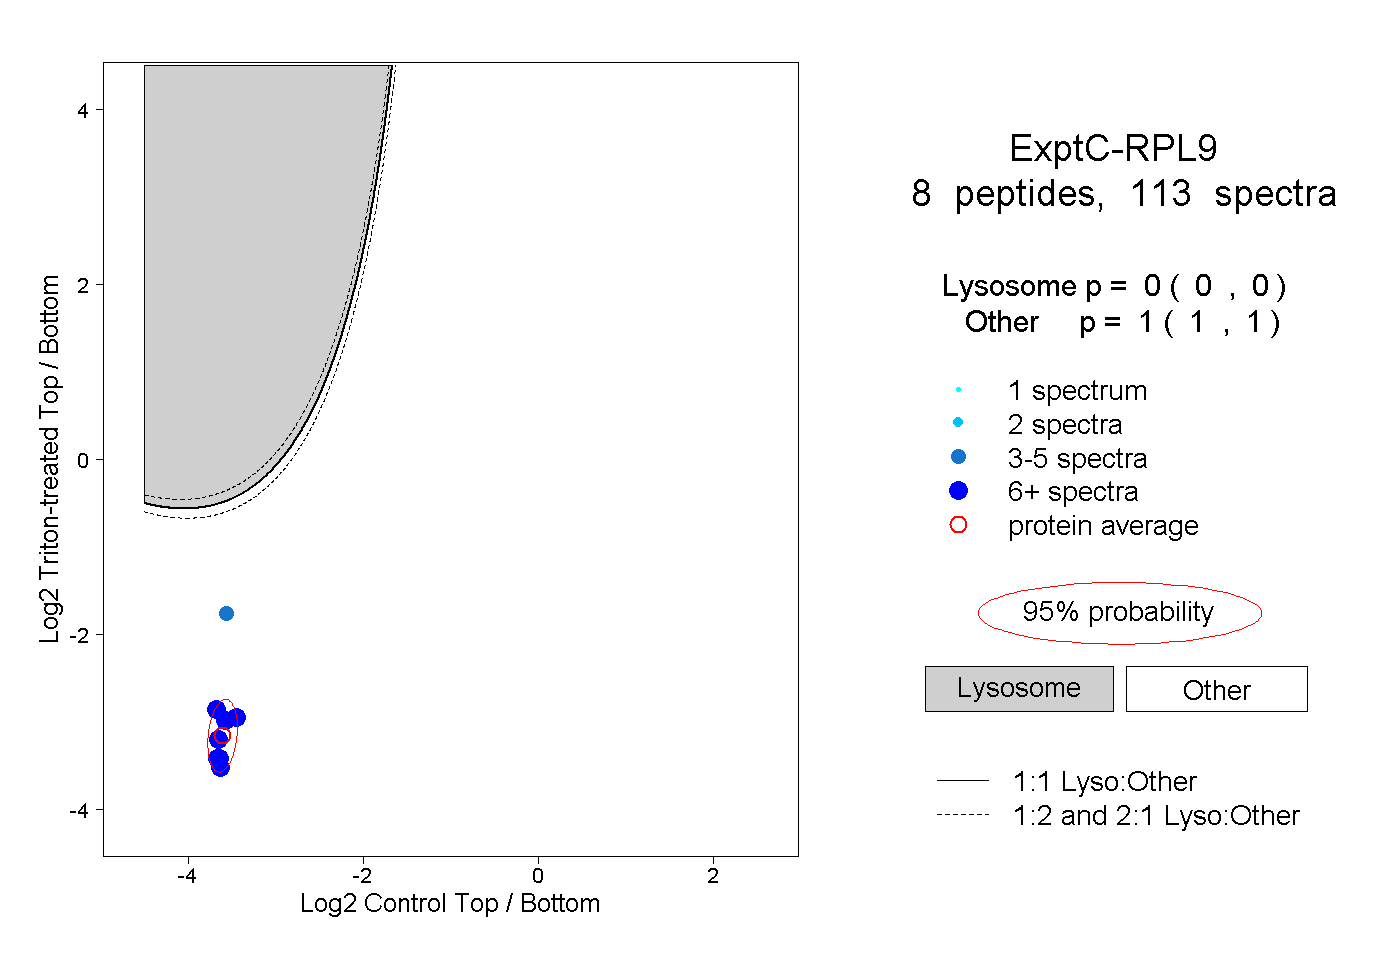 |
0.000 0.000 | 0.000 |
1.000 1.000 | 1.000 |
||||||||
| Plot | Lyso | Other | |||||||||||
| Expt D |
6 peptides |
17 spectra |
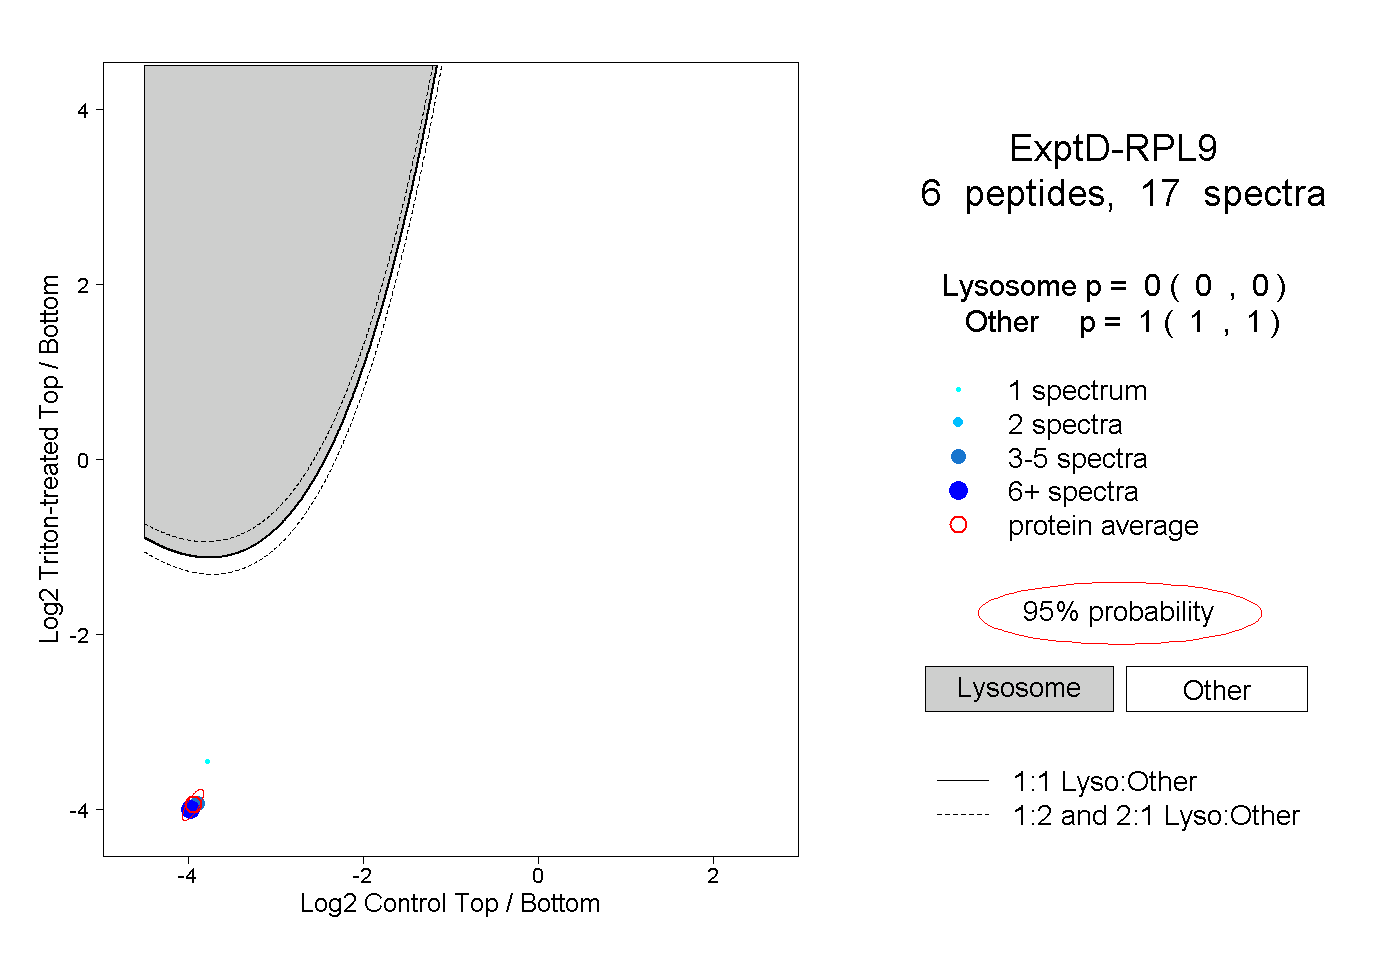 |
0.000 0.000 | 0.000 |
1.000 1.000 | 1.000 |