 7
7peptides
spectra
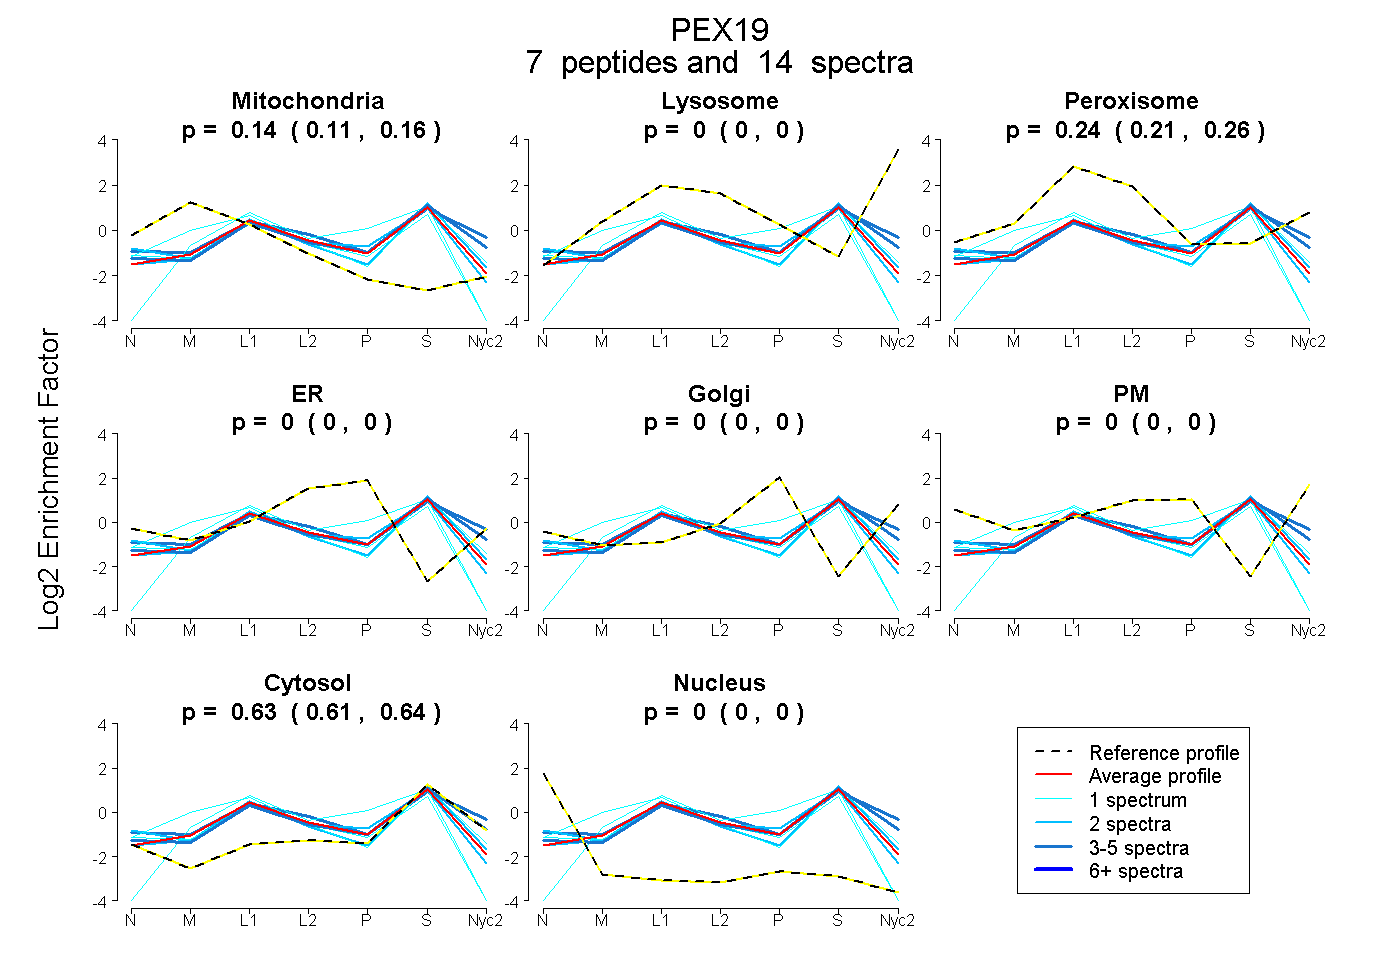
0.109 | 0.162
0.000 | 0.000
0.211 | 0.258
0.000 | 0.000
0.000 | 0.000
0.000 | 0.000
0.613 | 0.635
0.000 | 0.000
8peptides
spectra

0.000 | 0.000
1.000 | 1.000
2peptides
spectra
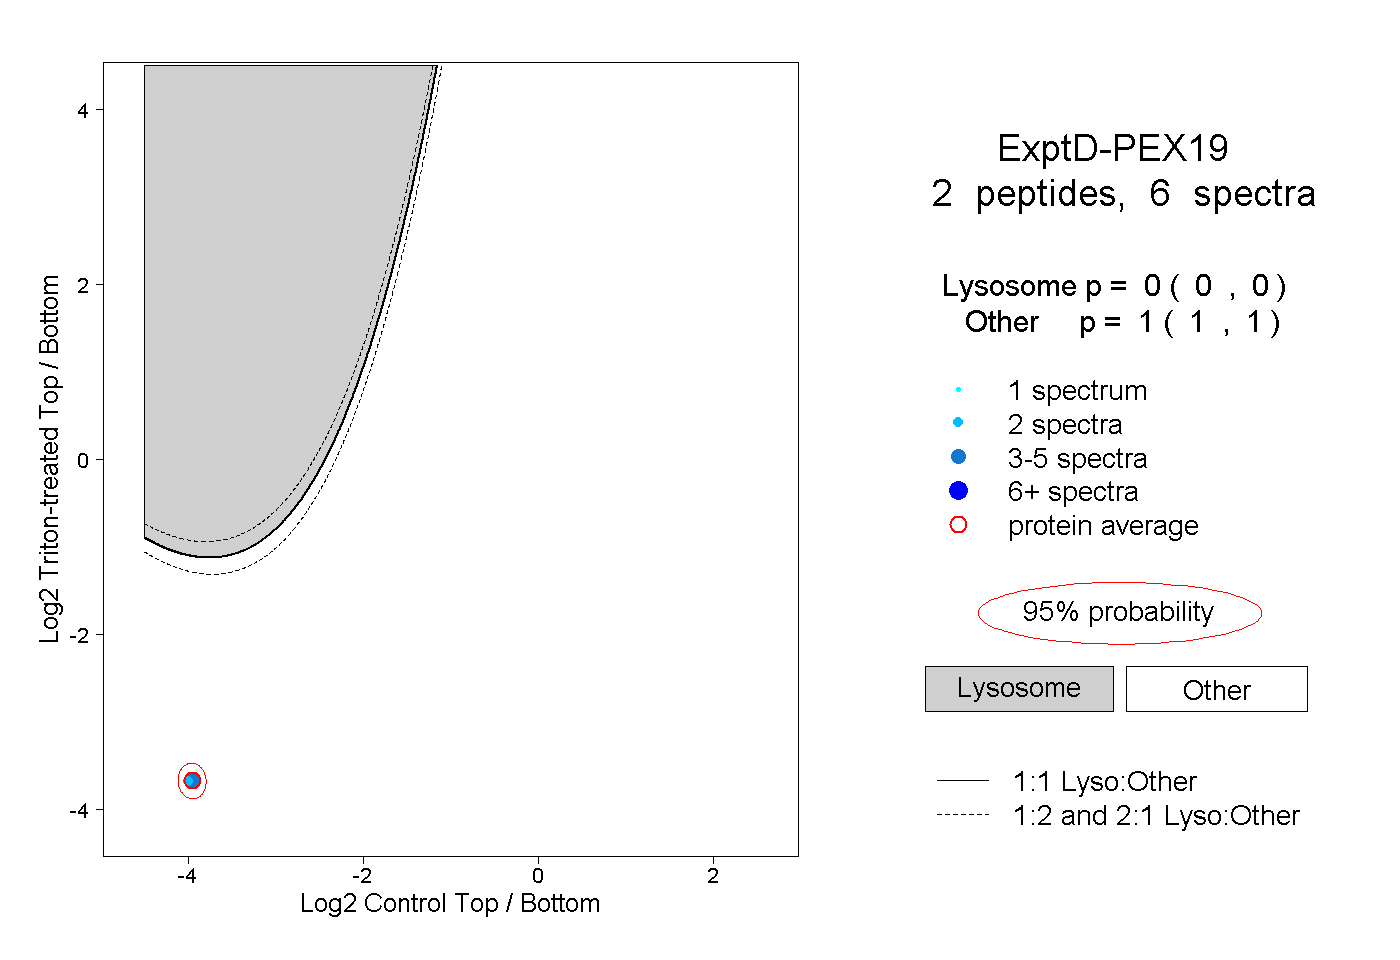
0.000 | 0.000
1.000 | 1.000