 7
7peptides
spectra
0.109 | 0.162
0.000 | 0.000
0.211 | 0.258
0.000 | 0.000
0.000 | 0.000
0.000 | 0.000
0.613 | 0.635
0.000 | 0.000
8peptides
spectra

0.000 | 0.000
1.000 | 1.000
| Plot | Mito | Lyso | Perox | ER | Golgi | PM | Cytosol | Nucleus | |||||
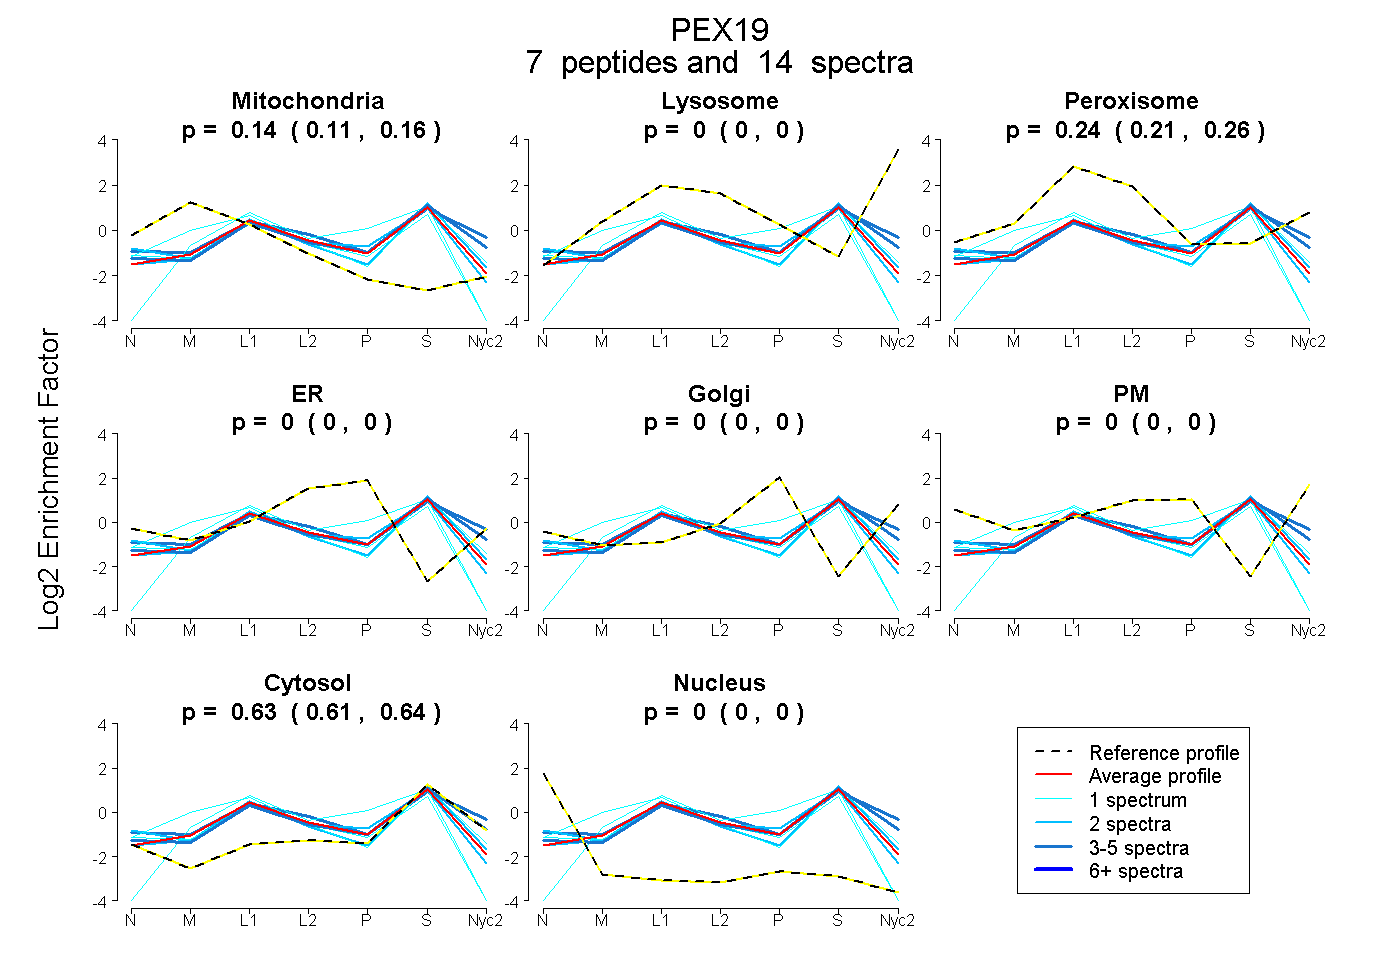
| Expt A |
7 peptides |
14 spectra |
|
0.138 0.109 | 0.162 |
0.000 0.000 | 0.000 |
0.236 0.211 | 0.258 |
0.000 0.000 | 0.000 |
0.000 0.000 | 0.000 |
0.000 0.000 | 0.000 |
0.626 0.613 | 0.635 |
0.000 0.000 | 0.000 |
||
| Plot | Lyso | Other | |||||||||||
| Expt C |
8 peptides |
24 spectra |
|
0.000 0.000 | 0.000 |
1.000 1.000 | 1.000 |
| 2 spectra, DALFASQEK | 0.000 | 1.000 | ||||||||
| 3 spectra, LSEAAGR | 0.000 | 1.000 | ||||||||
| 2 spectra, DVLYPSLK | 0.000 | 1.000 | ||||||||
| 1 spectrum, NATDLQNAGMSEEELTK | 0.000 | 1.000 | ||||||||
| 3 spectra, ELAEEEPHLVEQFQK | 0.000 | 1.000 | ||||||||
| 1 spectrum, YQQQHSVMGK | 0.000 | 1.000 | ||||||||
| 1 spectrum, ETLSGLAK | 0.000 | 1.000 | ||||||||
| 11 spectra, SPGDTAK | 0.000 | 1.000 |
| Plot | Lyso | Other | |||||||||||
| Expt D |
2 peptides |
6 spectra |
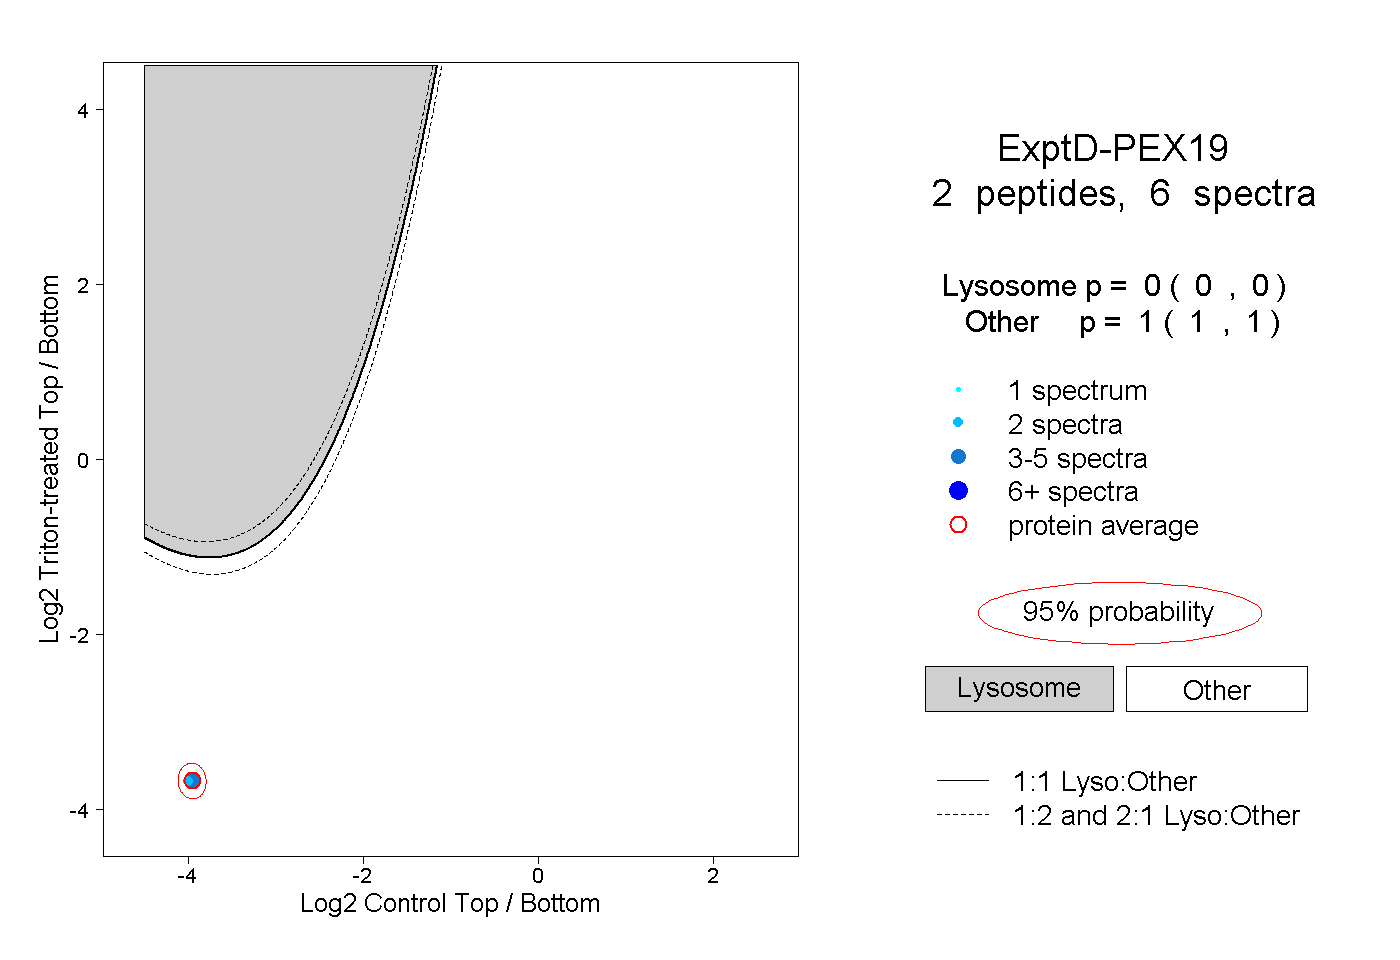 |
0.000 0.000 | 0.000 |
1.000 1.000 | 1.000 |