 12
12peptides
spectra
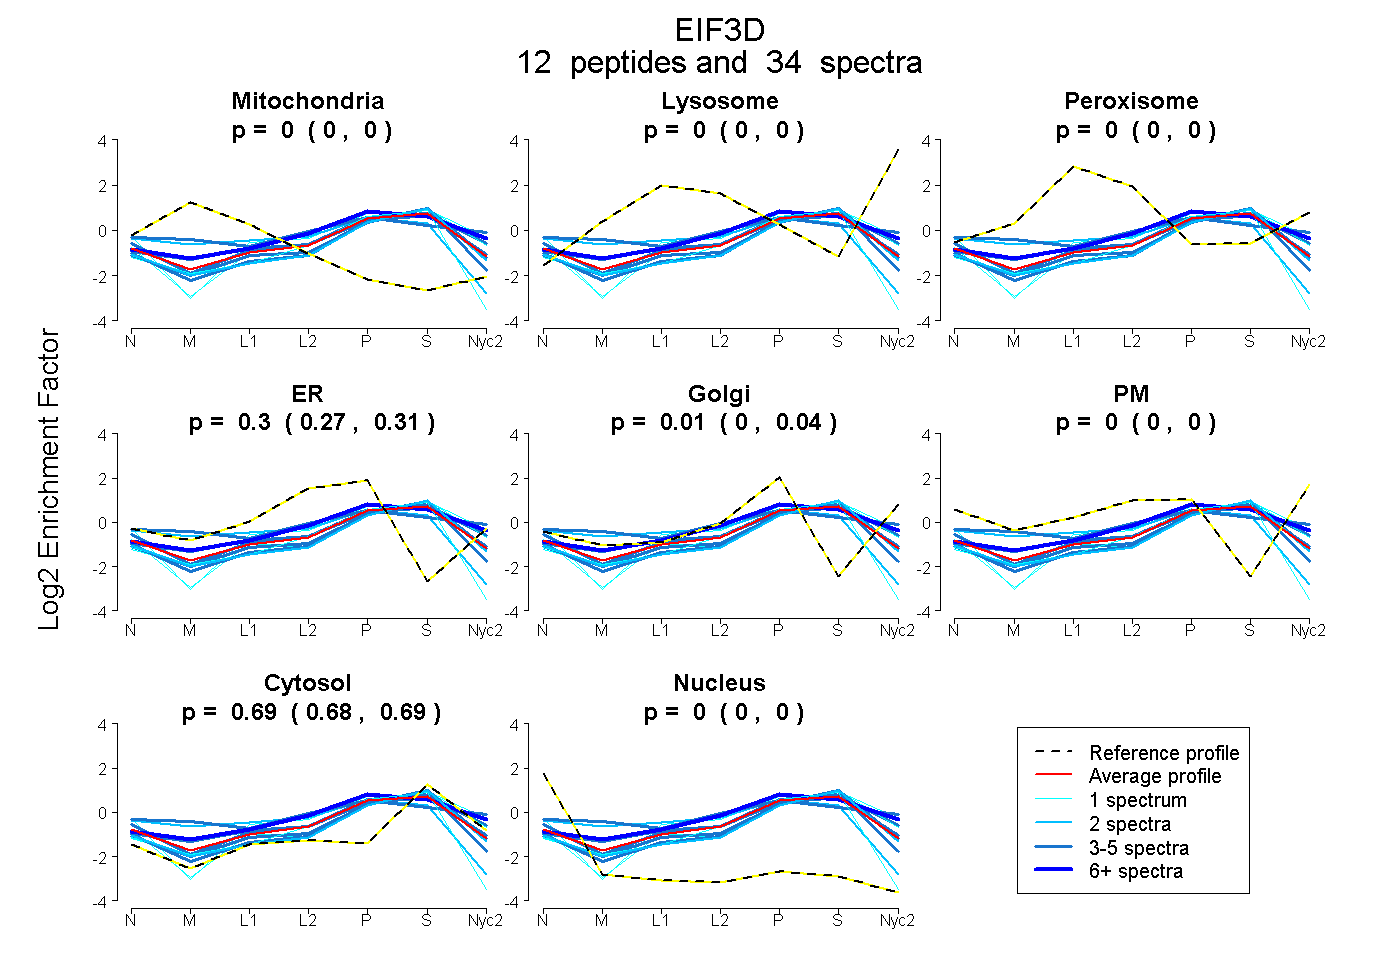
0.000 | 0.000
0.000 | 0.000
0.000 | 0.000
0.272 | 0.311
0.000 | 0.039
0.000 | 0.000
0.681 | 0.694
0.000 | 0.000
9peptides
spectra
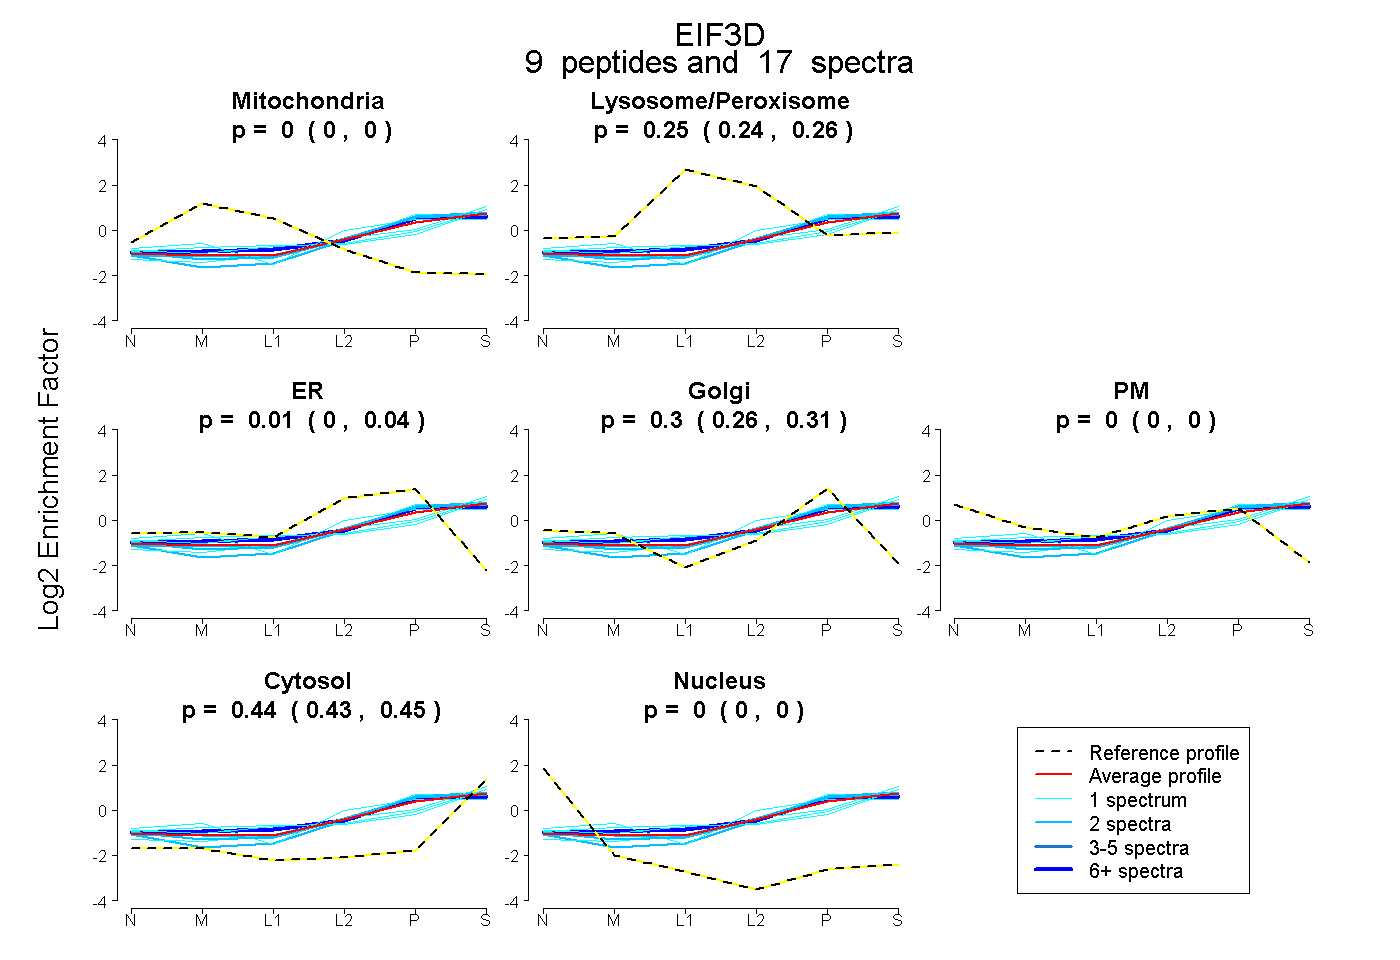
0.000 | 0.000
0.237 | 0.262
0.000 | 0.040
0.262 | 0.311
0.000 | 0.000
0.430 | 0.451
0.000 | 0.000
11peptides
spectra
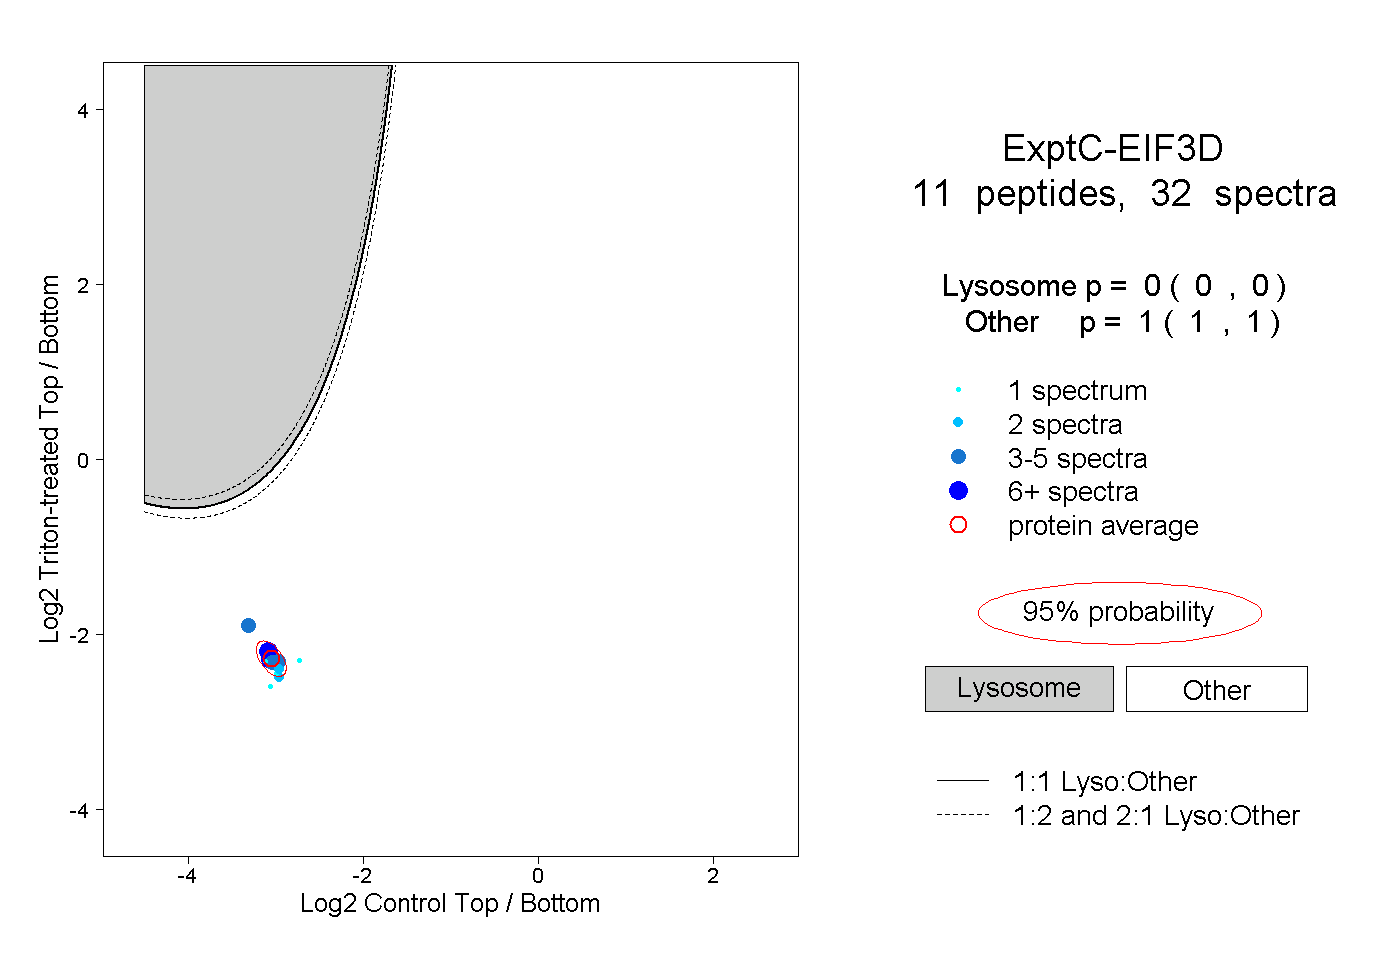
0.000 | 0.000
1.000 | 1.000
4peptides
spectra
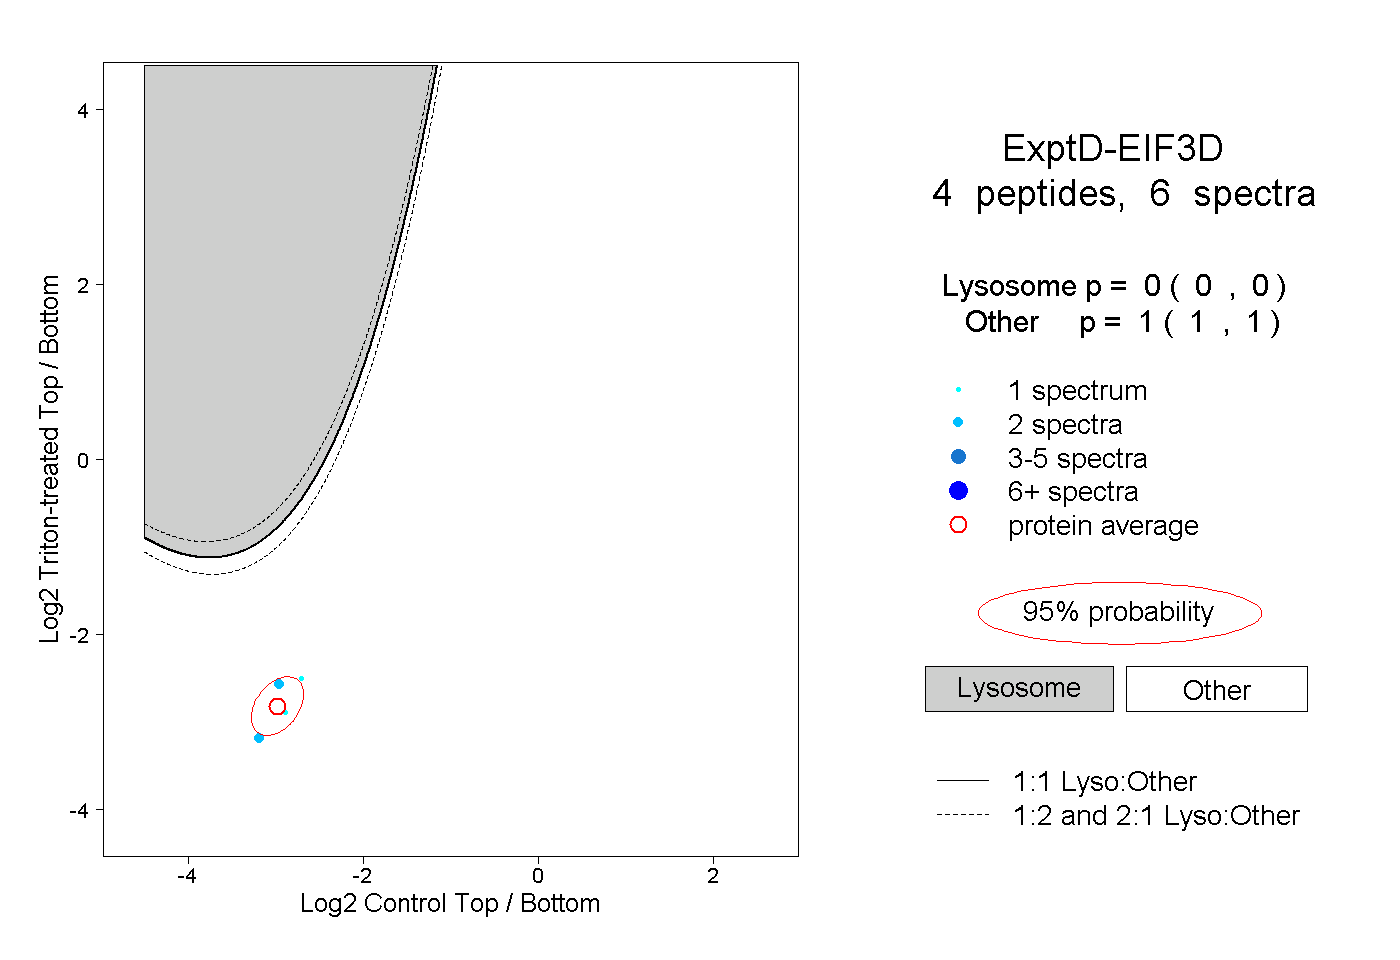
0.000 | 0.000
1.000 | 1.000