 12
12peptides
spectra
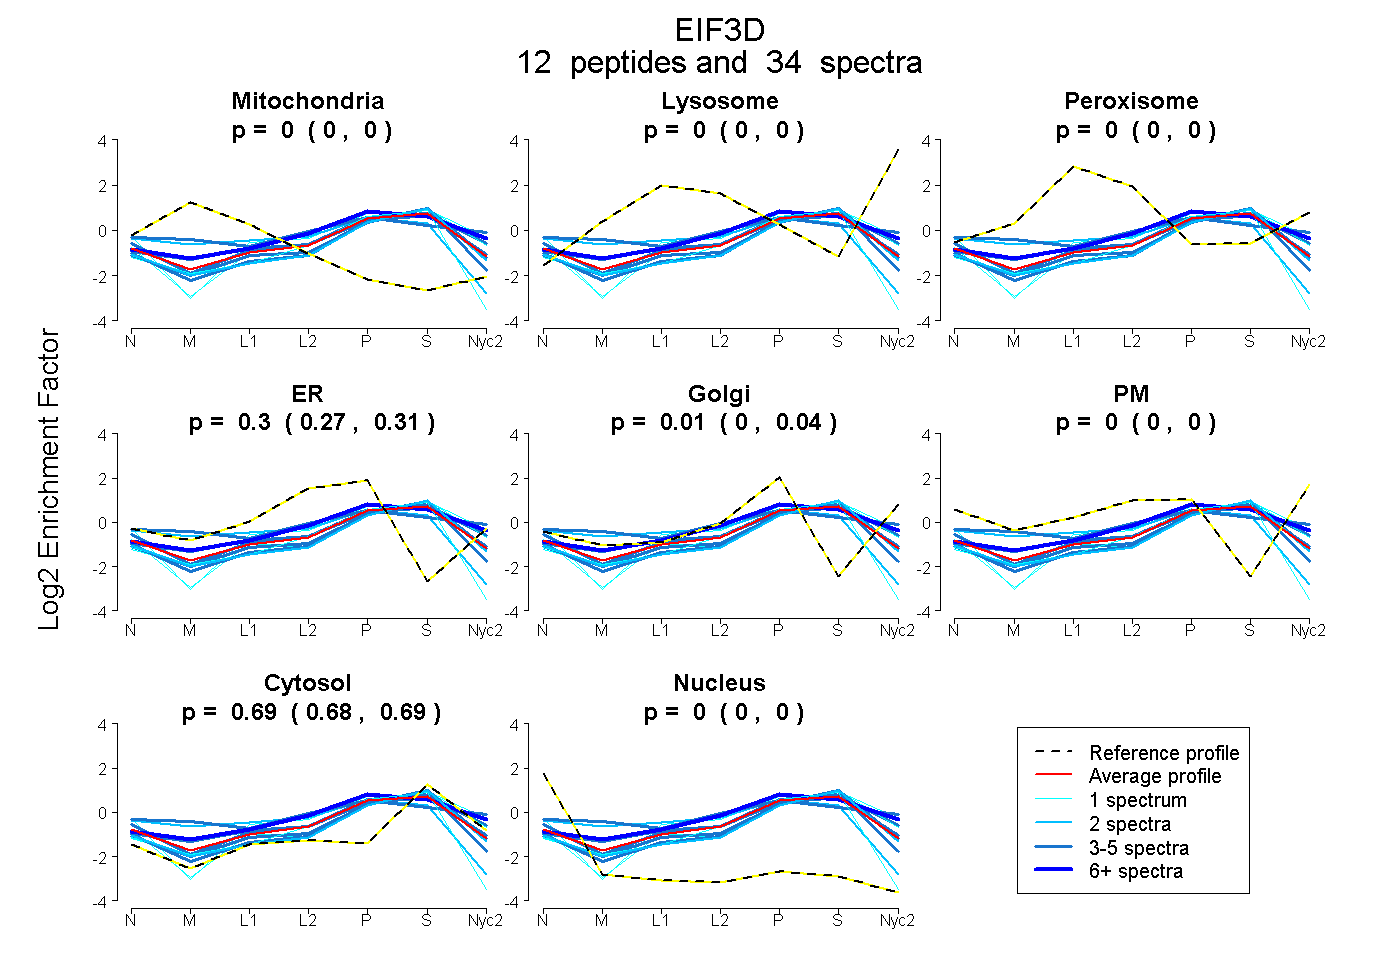
0.000 | 0.000
0.000 | 0.000
0.000 | 0.000
0.272 | 0.311
0.000 | 0.039
0.000 | 0.000
0.681 | 0.694
0.000 | 0.000
| Plot | Mito | Lyso | Perox | ER | Golgi | PM | Cytosol | Nucleus | |||||
| Expt A |
12 peptides |
34 spectra |
|
0.000 0.000 | 0.000 |
0.000 0.000 | 0.000 |
0.000 0.000 | 0.000 |
0.297 0.272 | 0.311 |
0.015 0.000 | 0.039 |
0.000 0.000 | 0.000 |
0.688 0.681 | 0.694 |
0.000 0.000 | 0.000 |
| 4 spectra, NLAMEATYINHNFSQQCLR | 0.000 | 0.000 | 0.012 | 0.319 | 0.006 | 0.000 | 0.664 | 0.000 | ||
| 2 spectra, GAVIATELK | 0.202 | 0.000 | 0.000 | 0.322 | 0.000 | 0.000 | 0.469 | 0.006 | ||
| 1 spectrum, DMPYQPFSK | 0.000 | 0.000 | 0.000 | 0.000 | 0.276 | 0.000 | 0.724 | 0.000 | ||
| 6 spectra, TLNEWDSR | 0.000 | 0.000 | 0.087 | 0.173 | 0.212 | 0.000 | 0.528 | 0.000 | ||
| 4 spectra, DSSVEVR | 0.000 | 0.000 | 0.003 | 0.175 | 0.174 | 0.000 | 0.648 | 0.000 | ||
| 1 spectrum, LFFDK | 0.000 | 0.000 | 0.000 | 0.000 | 0.266 | 0.000 | 0.734 | 0.000 | ||
| 1 spectrum, CEHDGVMTGANGEVSFINIK | 0.000 | 0.000 | 0.000 | 0.329 | 0.000 | 0.000 | 0.671 | 0.000 | ||
| 5 spectra, IFHTVTTTDDPVIR | 0.000 | 0.000 | 0.000 | 0.218 | 0.000 | 0.000 | 0.777 | 0.005 | ||
| 4 spectra, LGDDIDLIVR | 0.000 | 0.000 | 0.000 | 0.076 | 0.156 | 0.000 | 0.768 | 0.000 | ||
| 2 spectra, YLILK | 0.000 | 0.000 | 0.000 | 0.087 | 0.137 | 0.000 | 0.777 | 0.000 | ||
| 1 spectrum, TQGNVFATDAILATLMSCTR | 0.000 | 0.000 | 0.000 | 0.219 | 0.000 | 0.000 | 0.669 | 0.113 | ||
| 3 spectra, LGYVSR | 0.014 | 0.000 | 0.194 | 0.011 | 0.345 | 0.036 | 0.400 | 0.000 |
| Plot | Mito | Lyso or Perox | ER | Golgi | PM | Cytosol | Nucleus | ||||||
| Expt B |
9 peptides |
17 spectra |
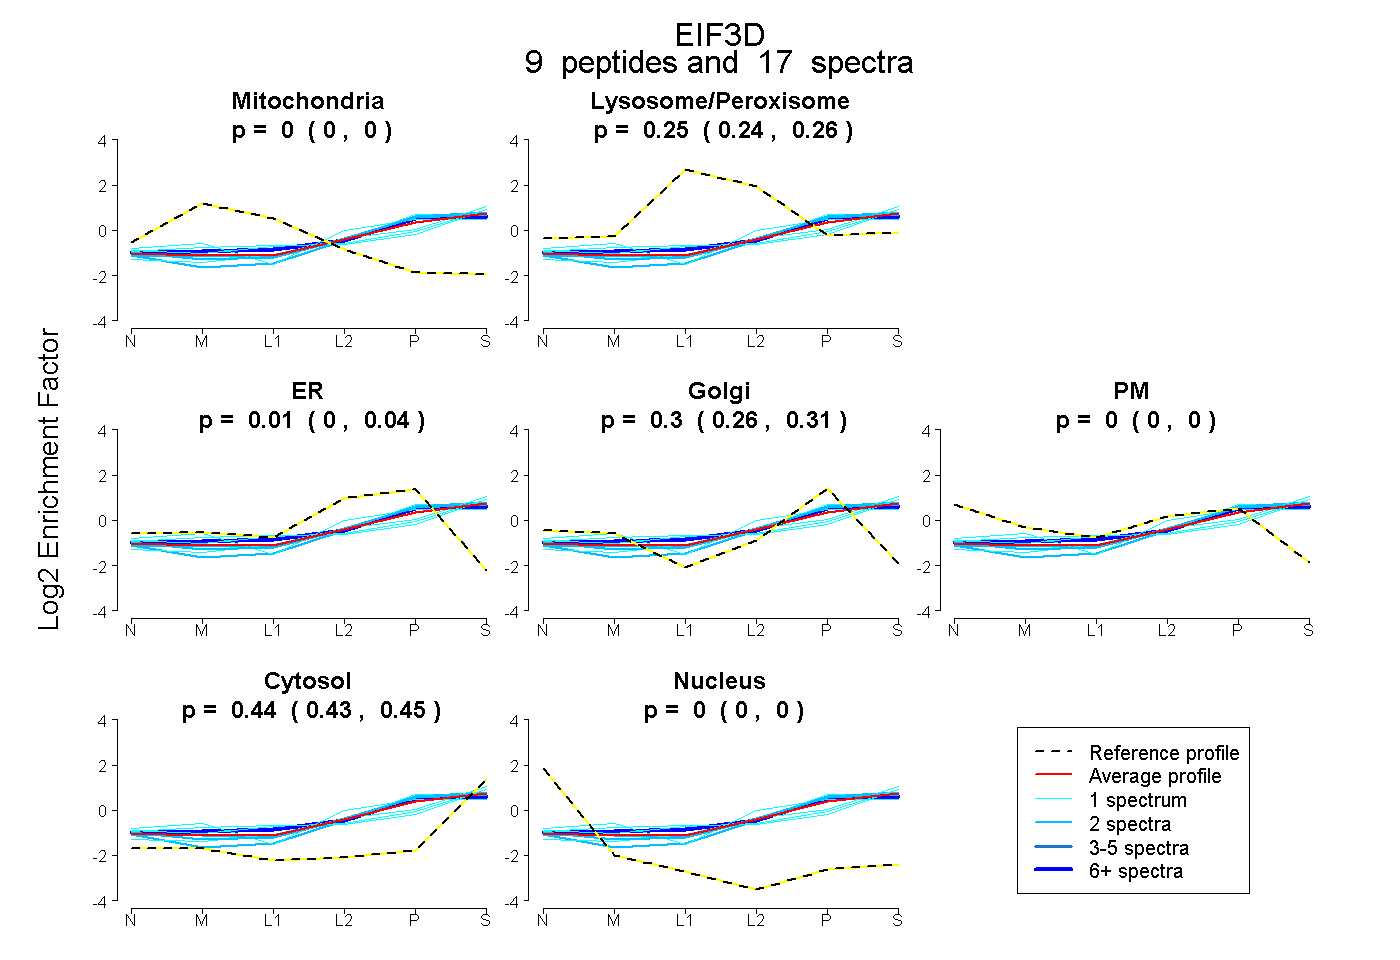 |
0.000 0.000 | 0.000 |
0.254 0.237 | 0.262 |
0.009 0.000 | 0.040 |
0.297 0.262 | 0.311 |
0.000 0.000 | 0.000 |
0.440 0.430 | 0.451 |
0.000 0.000 | 0.000 |
|||
| Plot | Lyso | Other | |||||||||||
| Expt C |
11 peptides |
32 spectra |
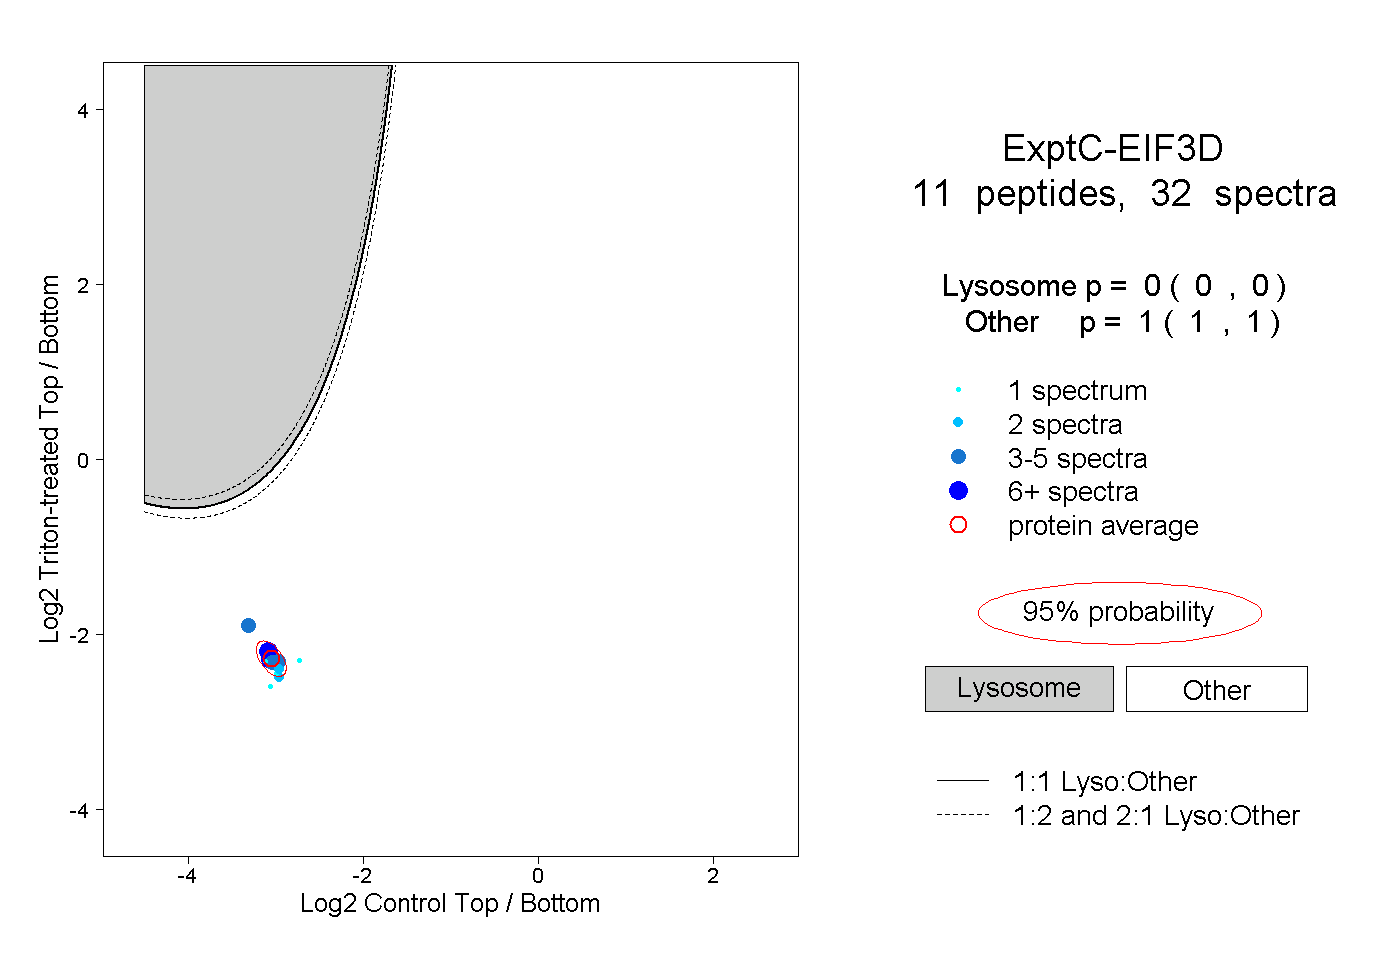 |
0.000 0.000 | 0.000 |
1.000 1.000 | 1.000 |
||||||||
| Plot | Lyso | Other | |||||||||||
| Expt D |
4 peptides |
6 spectra |
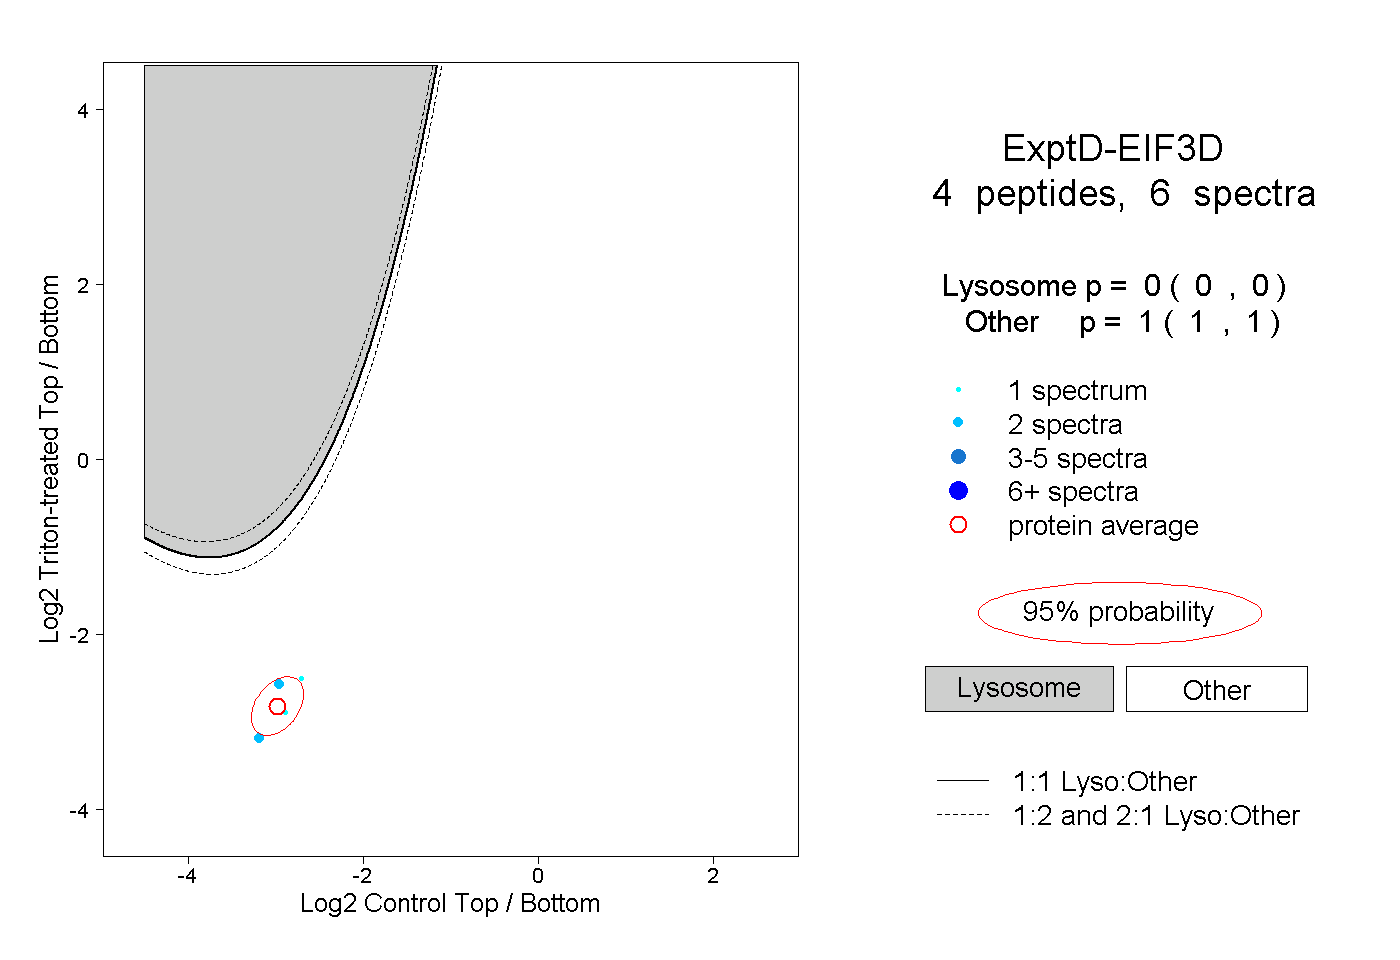 |
0.000 0.000 | 0.000 |
1.000 1.000 | 1.000 |