 45
45peptides
spectra
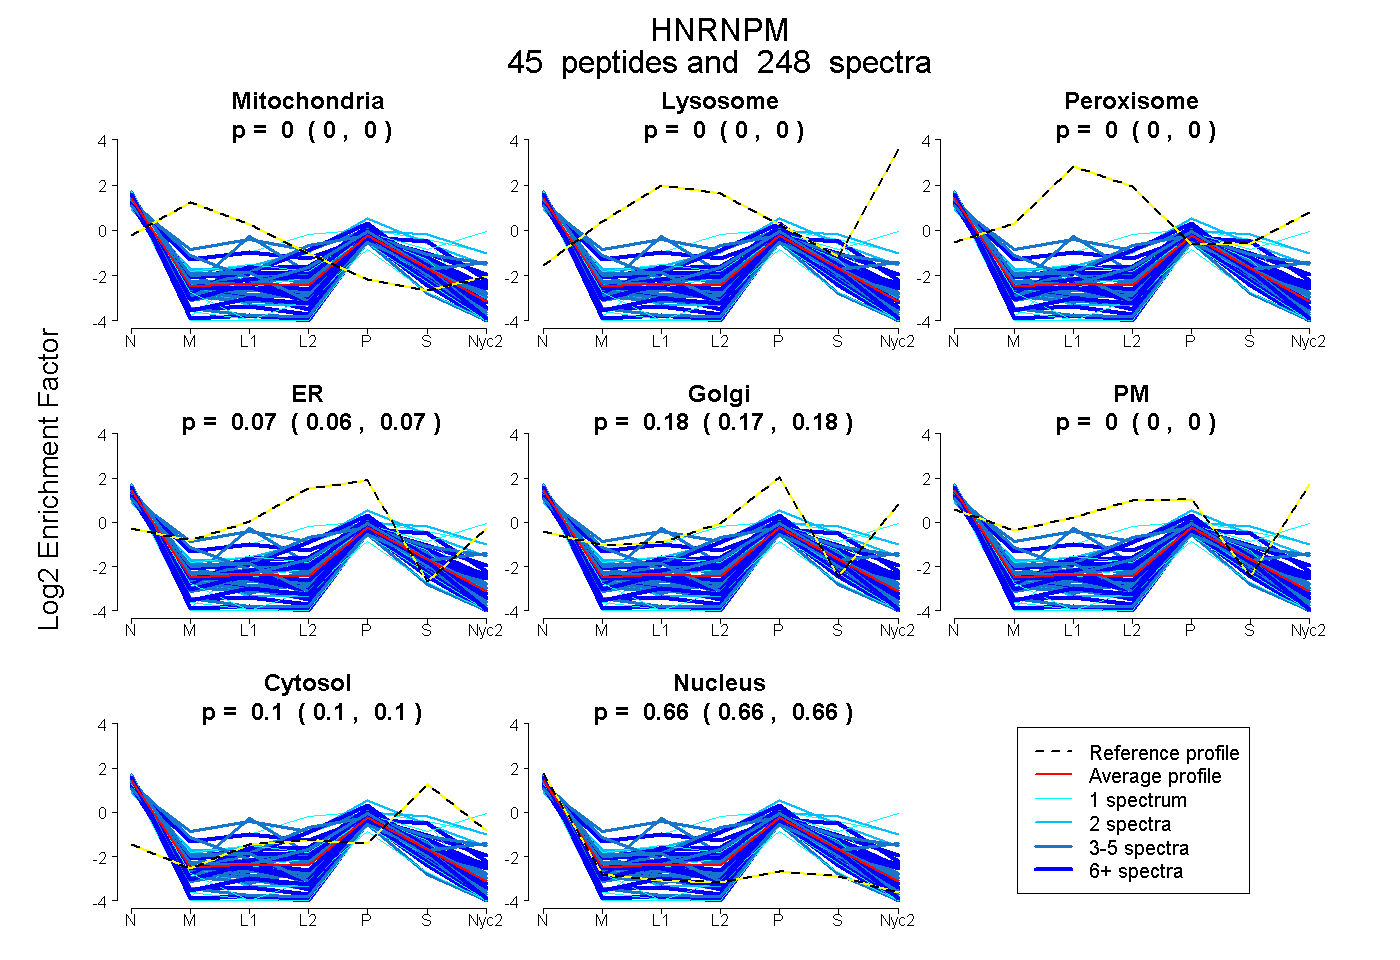
0.000 | 0.000
0.000 | 0.000
0.000 | 0.000
0.059 | 0.073
0.168 | 0.183
0.000 | 0.000
0.097 | 0.101
0.656 | 0.660
11peptides
spectra
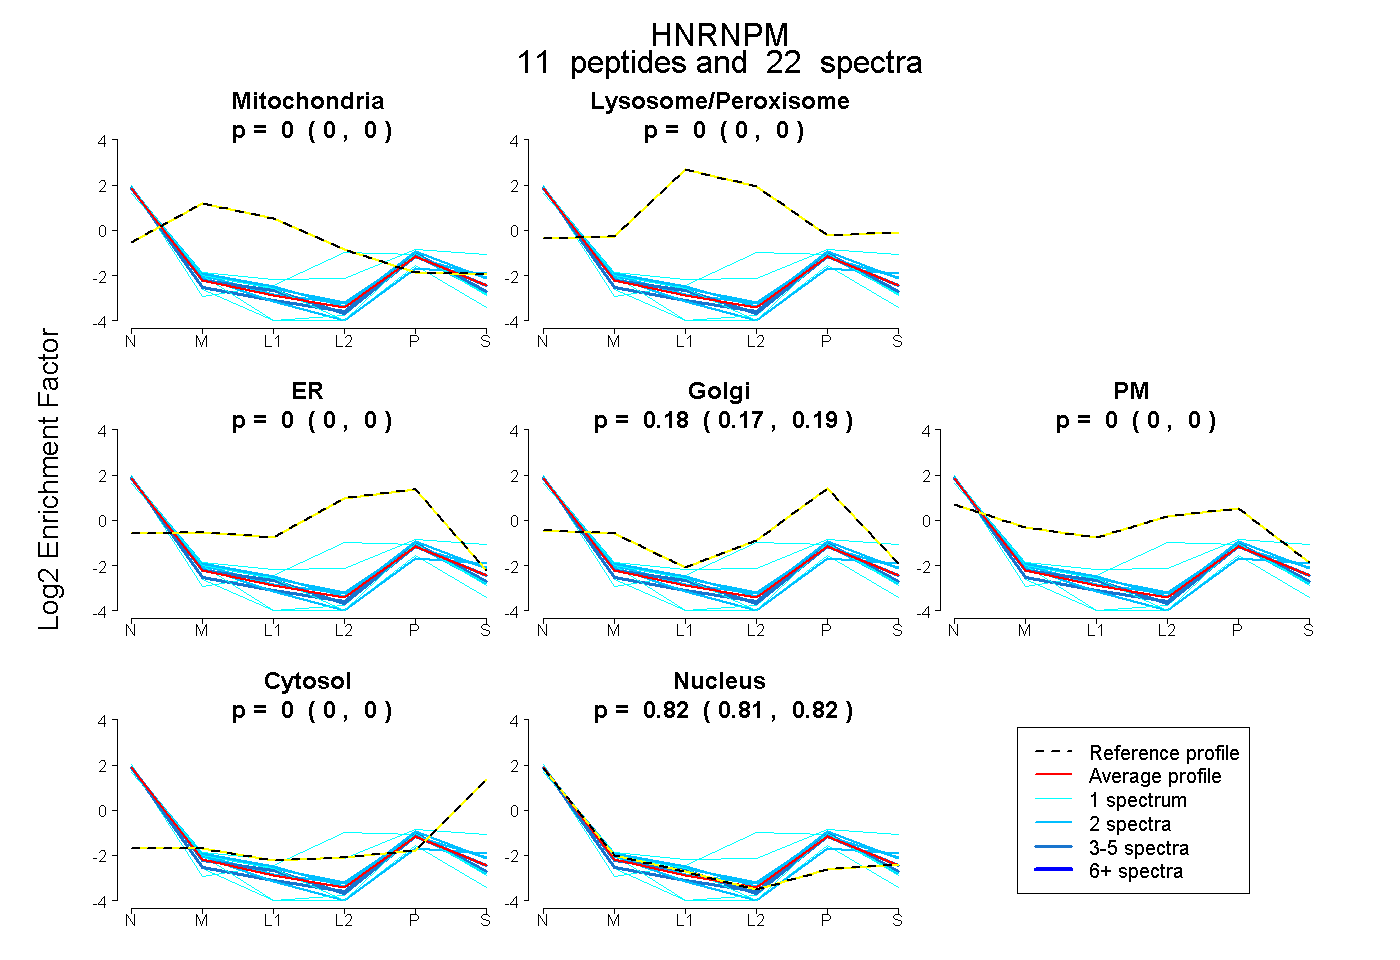
0.000 | 0.000
0.000 | 0.000
0.000 | 0.000
0.174 | 0.188
0.000 | 0.000
0.000 | 0.000
0.810 | 0.825
7peptides
spectra
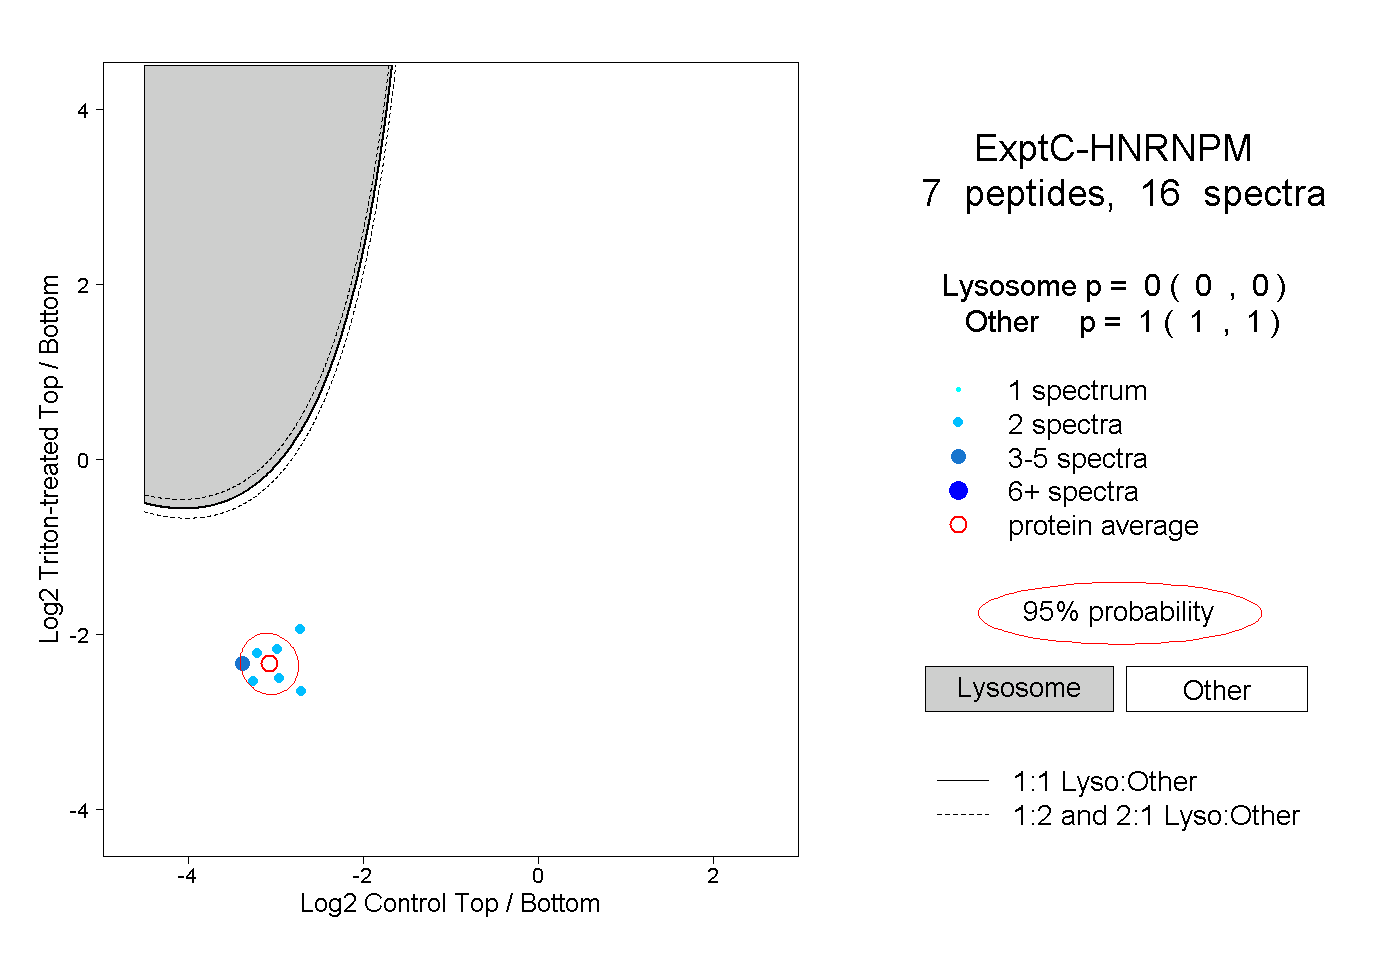
0.000 | 0.000
1.000 | 1.000
2peptides
spectra
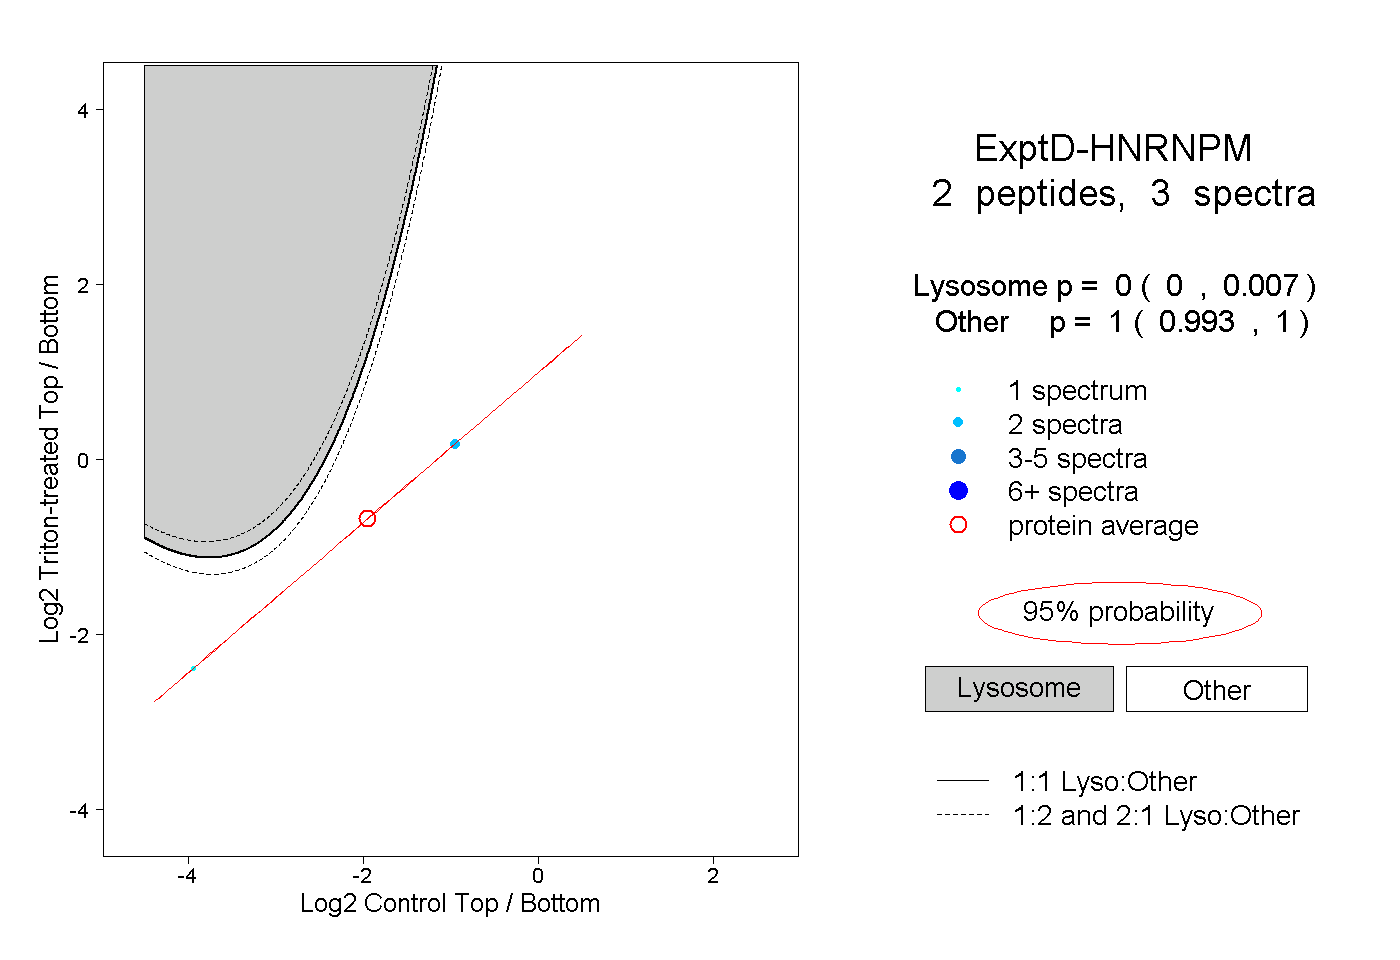
0.000 | 0.007
0.993 | 1.000