 12
12peptides
spectra
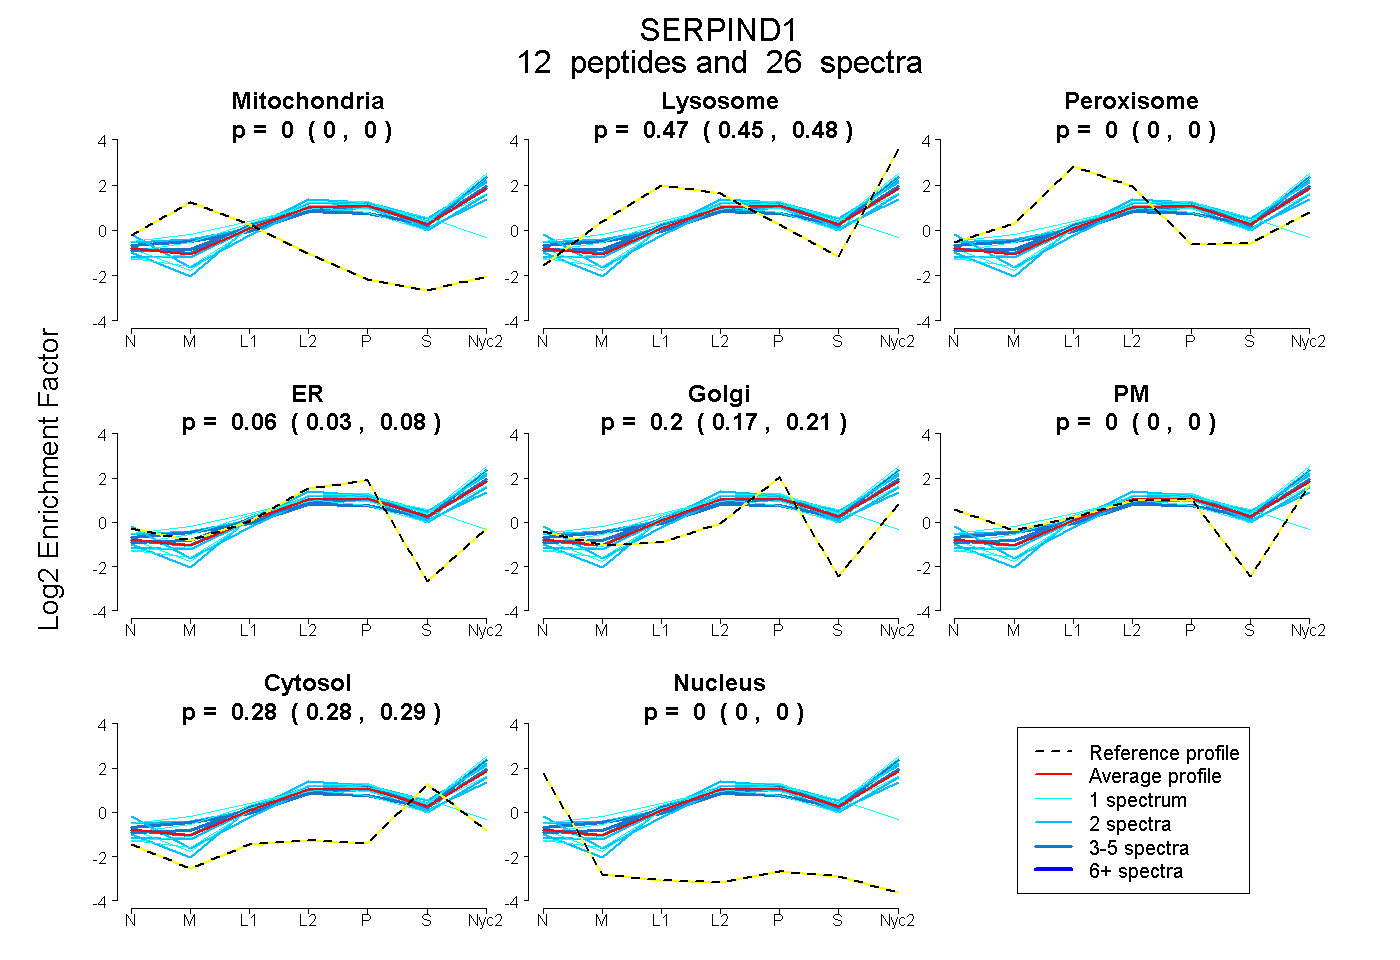
0.000 | 0.000
0.453 | 0.476
0.000 | 0.000
0.030 | 0.081
0.171 | 0.215
0.000 | 0.000
0.276 | 0.290
0.000 | 0.000
6peptides
spectra
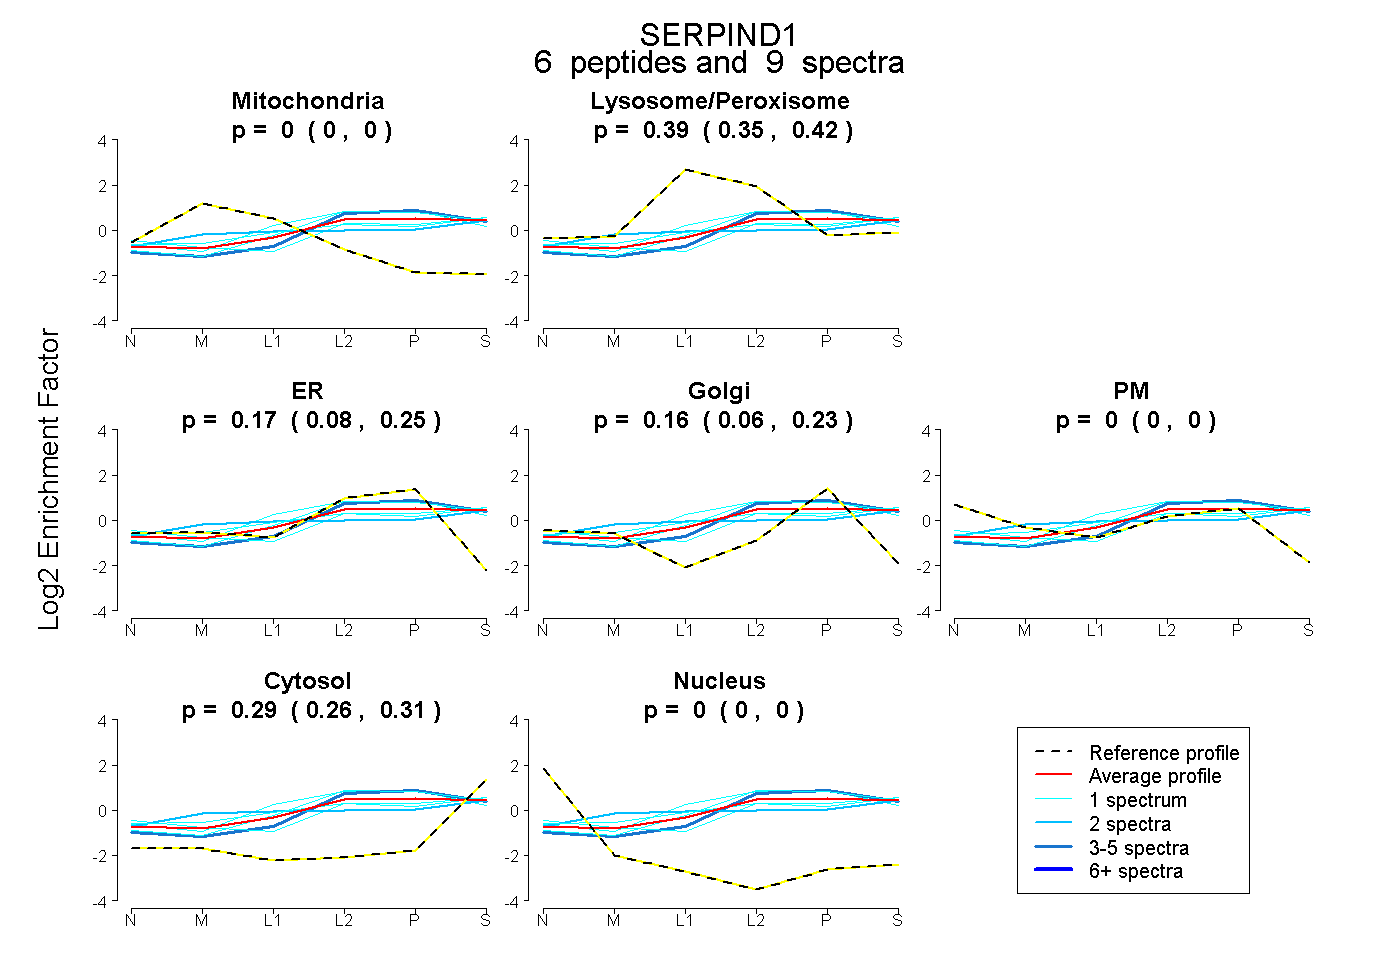
0.000 | 0.000
0.346 | 0.421
0.077 | 0.254
0.064 | 0.226
0.000 | 0.000
0.260 | 0.312
0.000 | 0.000
12peptides
spectra
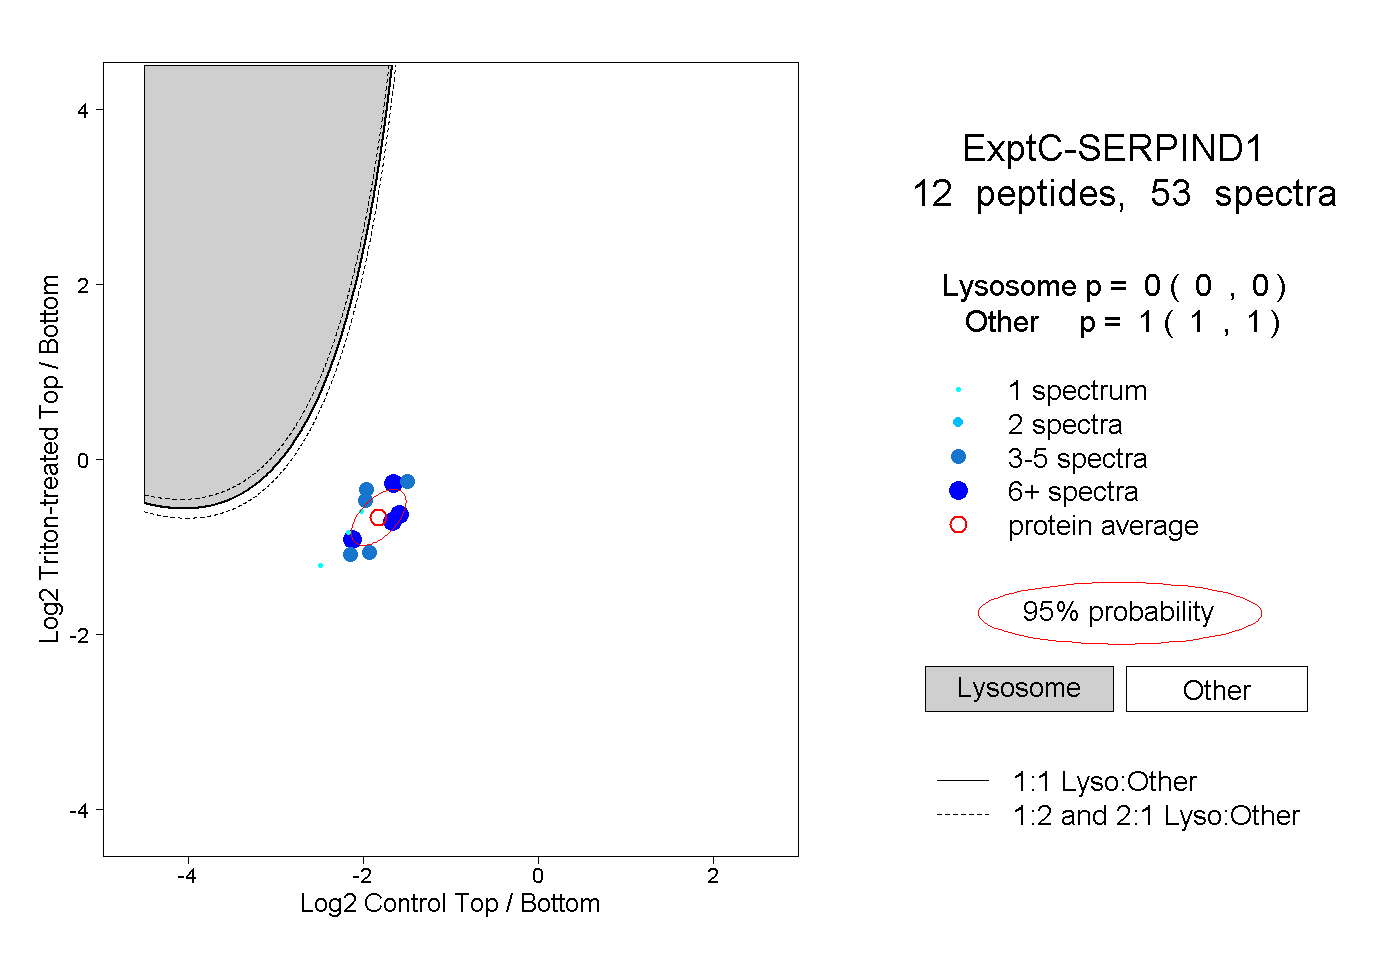
0.000 | 0.000
1.000 | 1.000
1peptide
spectrum
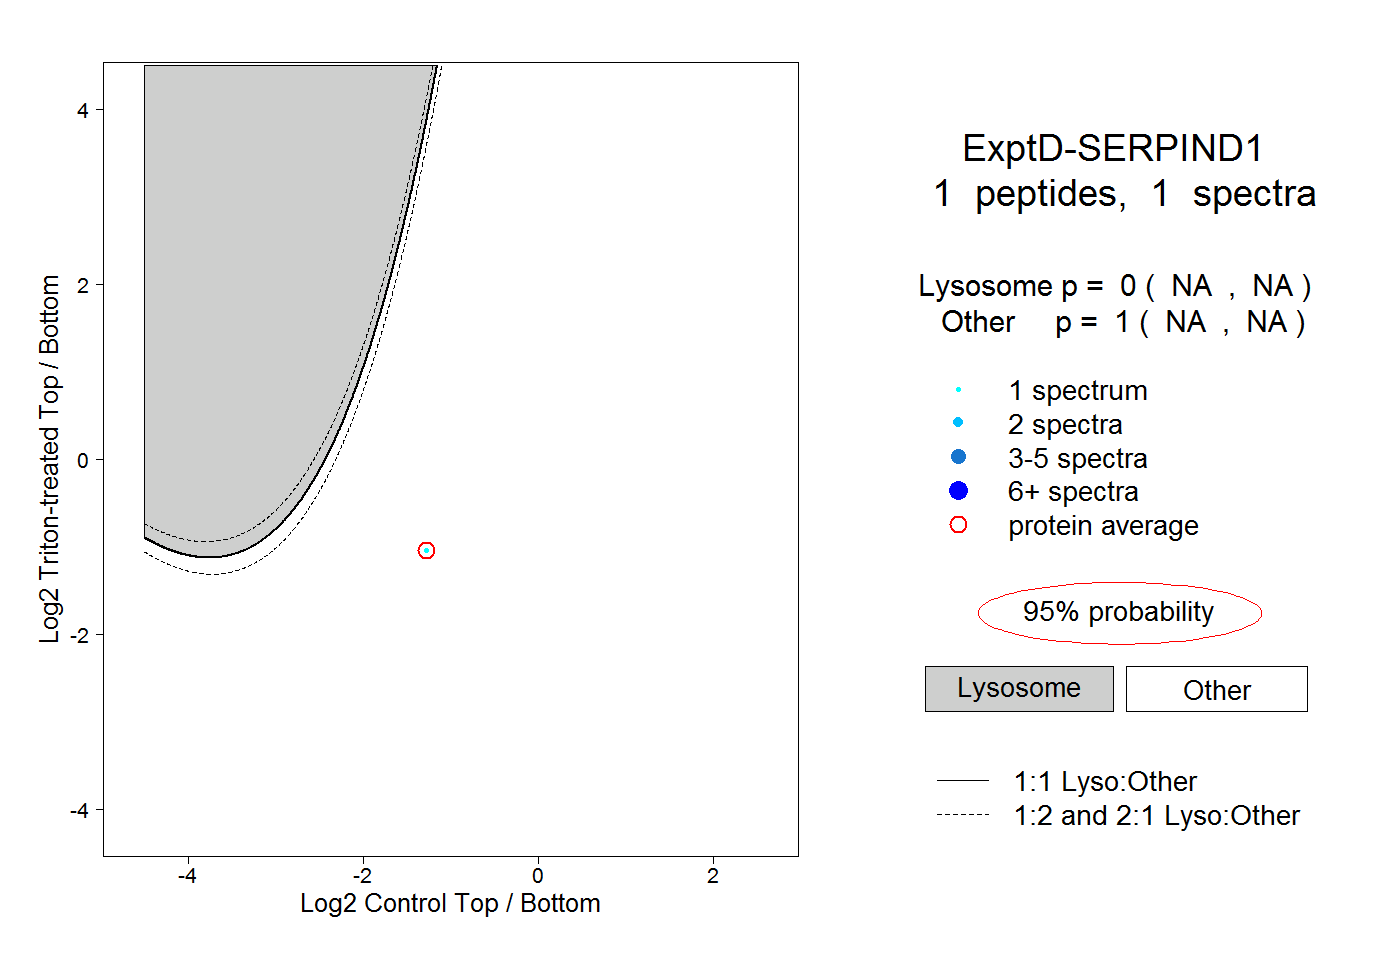
NA | NA
NA | NA