SERPIND1
[ENSRNOP00000031829]
Main page
| | | Plot |
Mito |
Lyso |
|
Perox |
ER |
Golgi |
PM |
Cytosol |
Nucleus |
|
| Expt A |
 12
12
peptides |
26
spectra |
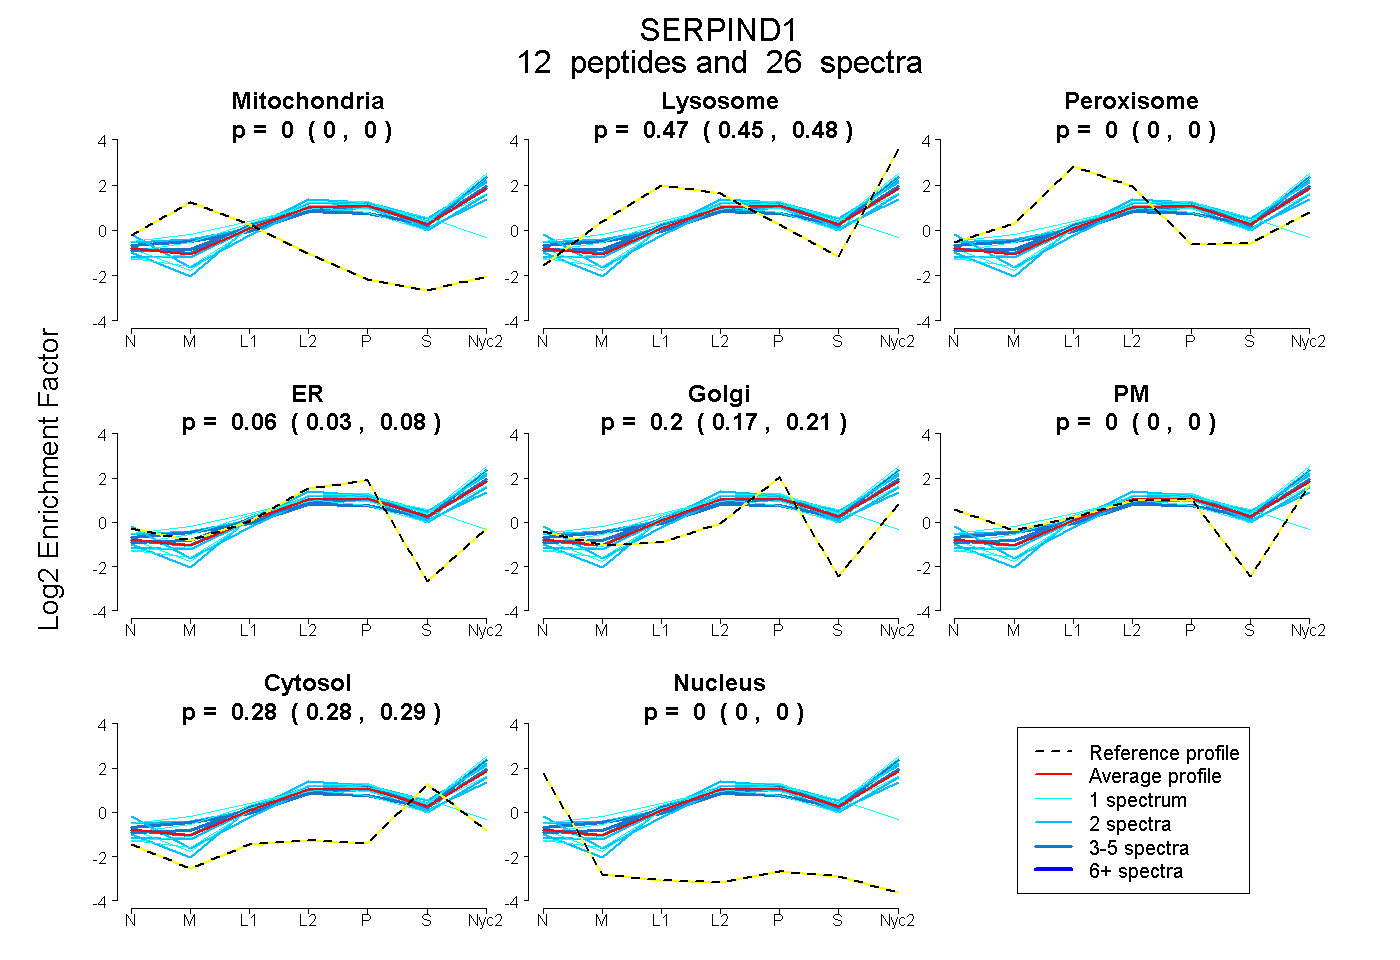 |
0.000
0.000 | 0.000 |
0.465
0.453 | 0.476 |
|
0.000
0.000 | 0.000 |
0.056
0.030 | 0.081 |
0.195
0.171 | 0.215 |
0.000
0.000 | 0.000 |
0.284
0.276 | 0.290 |
0.000
0.000 | 0.000 |
|
| | | Plot |
Mito |
|
Lyso or Perox |
|
ER |
Golgi |
PM |
Cytosol |
Nucleus |
|
| Expt B |
6
peptides |
9
spectra |
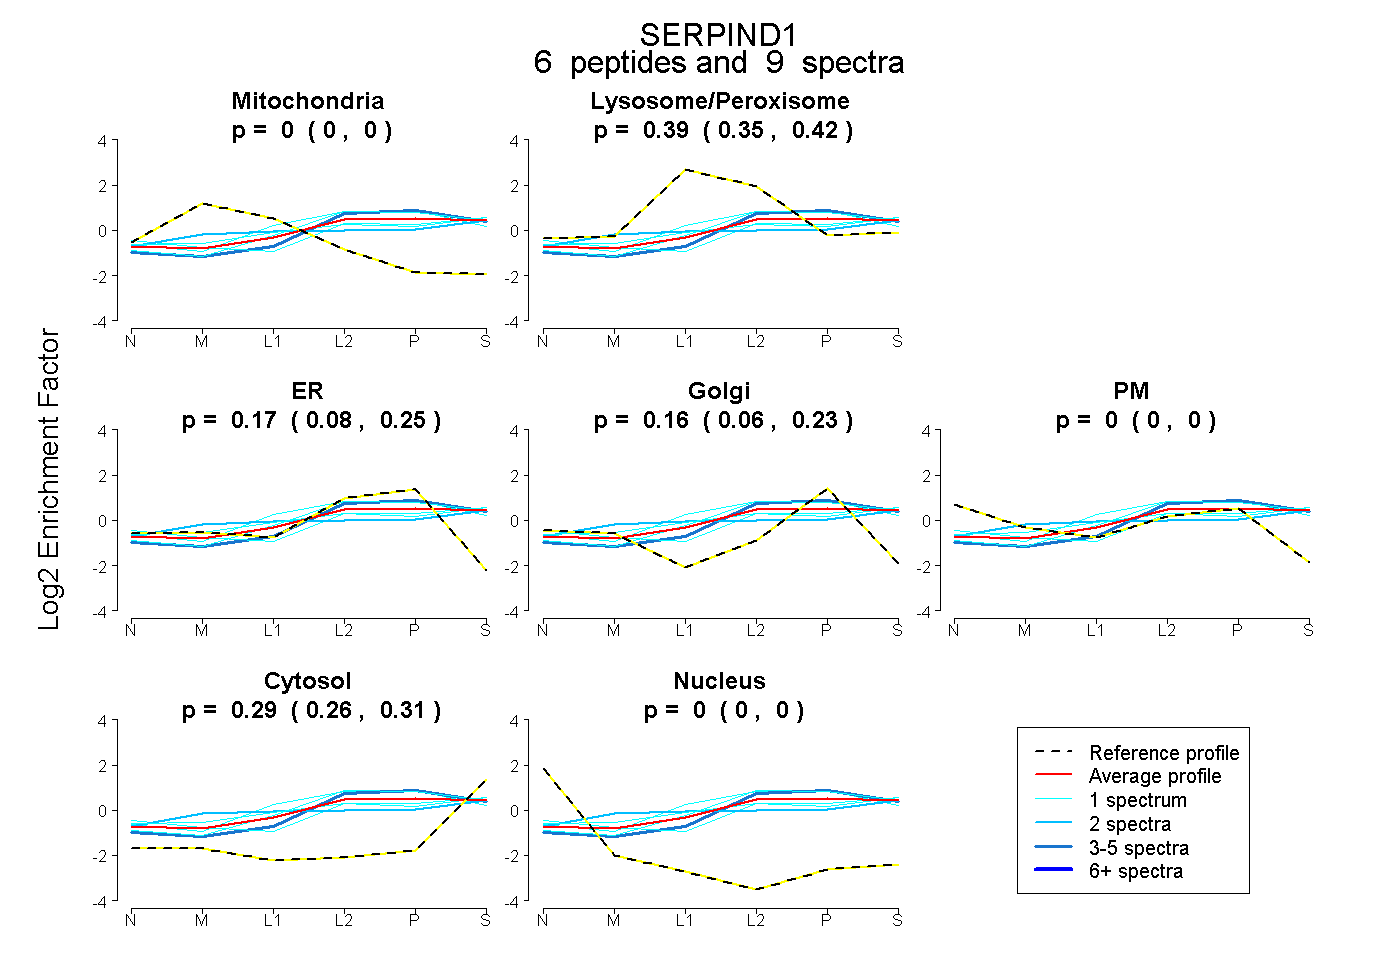 |
0.000
0.000 | 0.000 |
|
0.387
0.346 | 0.421 |
|
0.169
0.077 | 0.254 |
0.156
0.064 | 0.226 |
0.000
0.000 | 0.000 |
0.288
0.260 | 0.312 |
0.000
0.000 | 0.000 |
|
| 1 spectrum, YEVTTIHNLFR |
0.000 |
|
0.469 |
|
0.000 |
0.233 |
0.000 |
0.298 |
0.000 |
|
| 1 spectrum, ANSHILK |
0.000 |
|
0.464 |
|
0.198 |
0.160 |
0.000 |
0.178 |
0.000 |
|
| 1 spectrum, LNILNAK |
0.000 |
|
0.299 |
|
0.145 |
0.186 |
0.016 |
0.354 |
0.000 |
|
| 2 spectra, TLEAQLTPQVVER |
0.000 |
|
0.454 |
|
0.000 |
0.239 |
0.000 |
0.307 |
0.000 |
|
| 1 spectrum, VANPAK |
0.000 |
|
0.338 |
|
0.376 |
0.000 |
0.000 |
0.287 |
0.000 |
|
| 3 spectra, FAFNLYR |
0.000 |
|
0.237 |
|
0.441 |
0.000 |
0.000 |
0.322 |
0.000 |
|
| | | Plot |
|
Lyso |
|
|
|
|
|
|
|
Other |
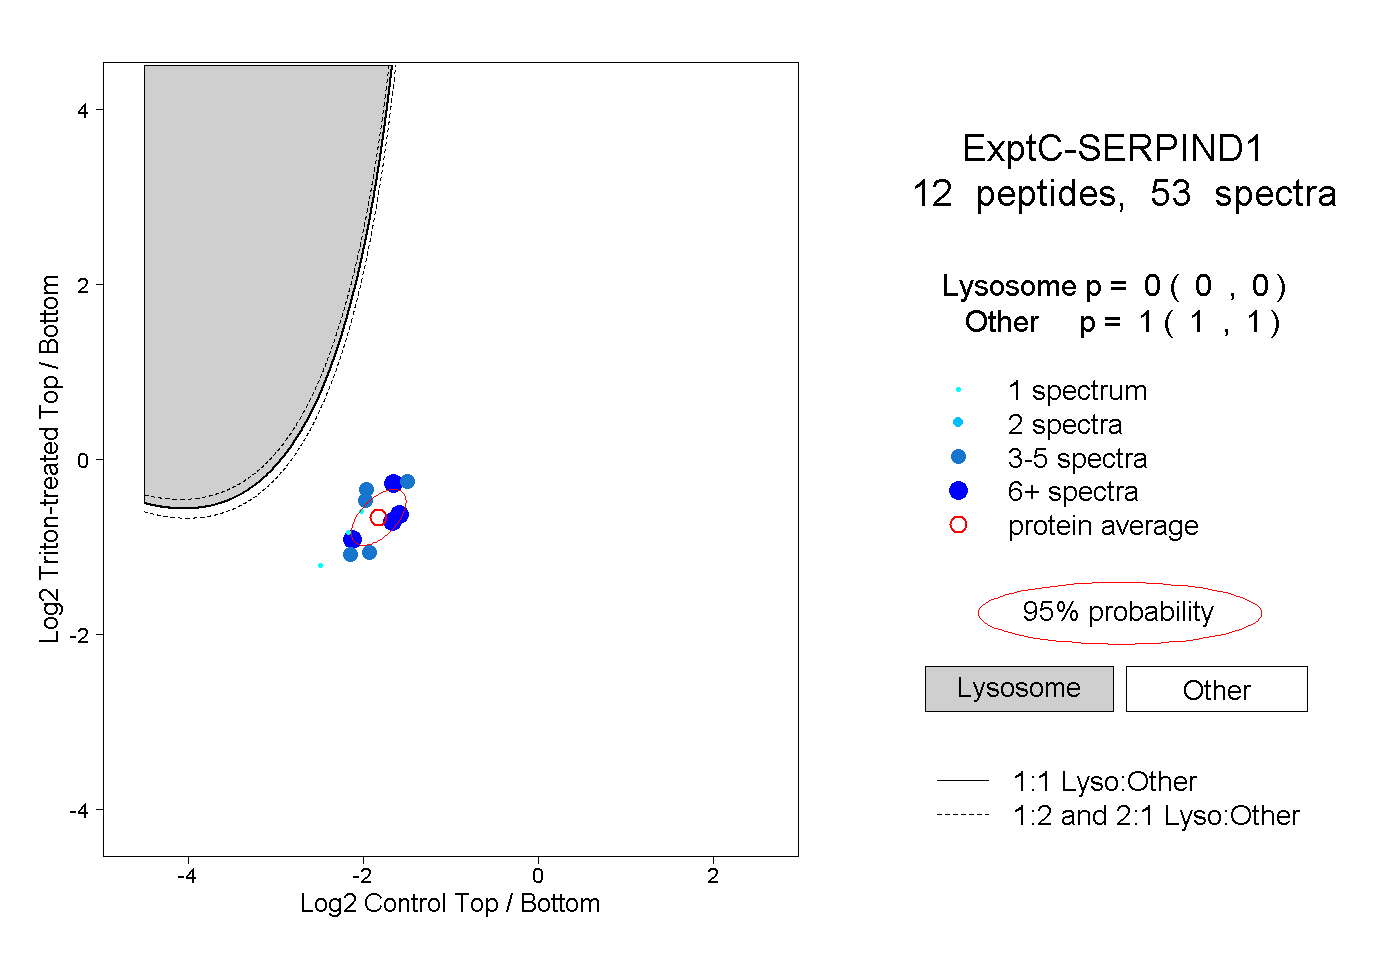
| Expt C |
12
peptides |
53
spectra |
 |
|
0.000
0.000 | 0.000 |
|
|
|
|
|
|
|
1.000
1.000 | 1.000 |
| | | Plot |
|
Lyso |
|
|
|
|
|
|
|
Other |
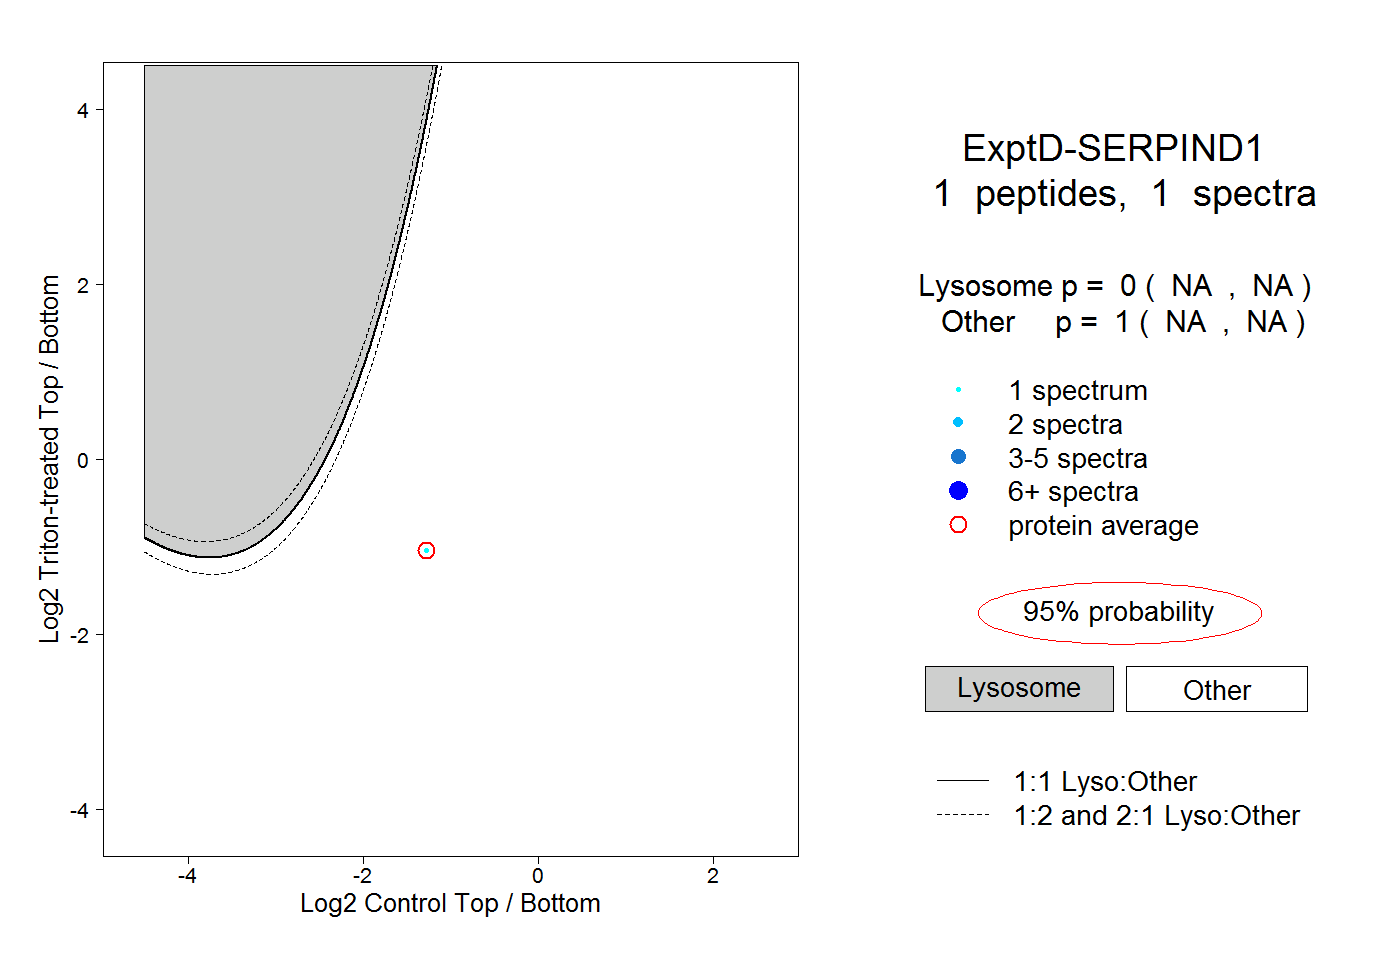
| Expt D |
1
peptide |
1
spectrum |
 |
|
0.000
NA | NA |
|
|
|
|
|
|
|
1.000
NA | NA |