 12
12peptides
spectra
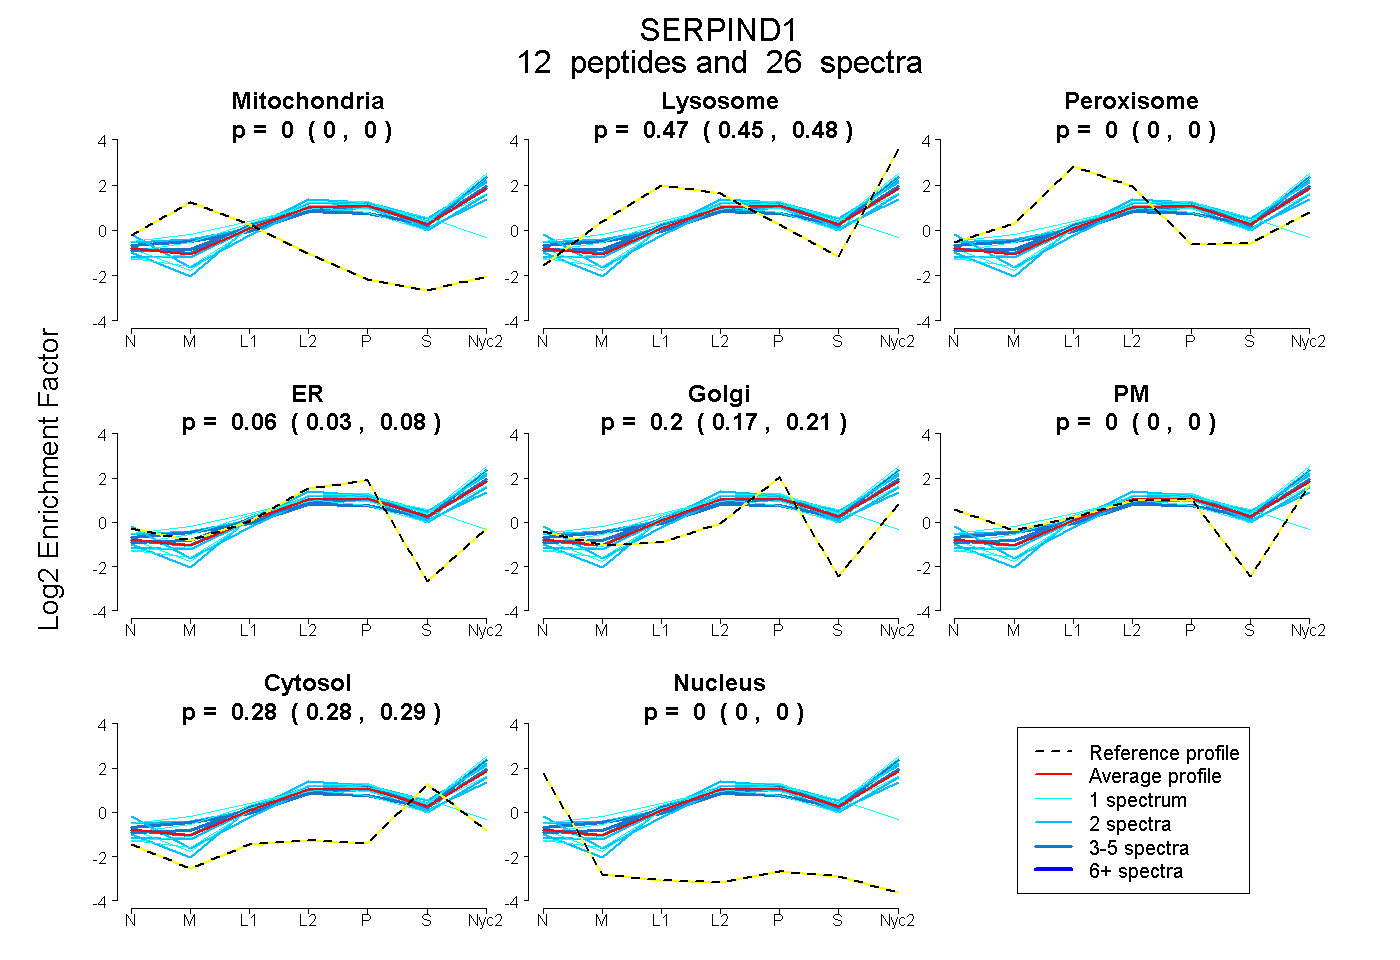
0.000 | 0.000
0.453 | 0.476
0.000 | 0.000
0.030 | 0.081
0.171 | 0.215
0.000 | 0.000
0.276 | 0.290
0.000 | 0.000
| Plot | Mito | Lyso | Perox | ER | Golgi | PM | Cytosol | Nucleus | |||||
| Expt A |
12 peptides |
26 spectra |
|
0.000 0.000 | 0.000 |
0.465 0.453 | 0.476 |
0.000 0.000 | 0.000 |
0.056 0.030 | 0.081 |
0.195 0.171 | 0.215 |
0.000 0.000 | 0.000 |
0.284 0.276 | 0.290 |
0.000 0.000 | 0.000 |
| 4 spectra, GAWMNK | 0.000 | 0.527 | 0.000 | 0.000 | 0.236 | 0.000 | 0.237 | 0.000 | ||
| 2 spectra, ANSHILK | 0.000 | 0.363 | 0.044 | 0.000 | 0.222 | 0.132 | 0.239 | 0.000 | ||
| 2 spectra, LNILNAK | 0.000 | 0.210 | 0.000 | 0.122 | 0.084 | 0.265 | 0.320 | 0.000 | ||
| 1 spectrum, NYNLVEVLK | 0.000 | 0.493 | 0.000 | 0.000 | 0.241 | 0.000 | 0.266 | 0.000 | ||
| 1 spectrum, VSMMQTK | 0.000 | 0.557 | 0.000 | 0.000 | 0.185 | 0.000 | 0.258 | 0.000 | ||
| 1 spectrum, NFGYTLQSVNDLYIQK | 0.000 | 0.503 | 0.000 | 0.161 | 0.046 | 0.000 | 0.291 | 0.000 | ||
| 4 spectra, SMGITK | 0.000 | 0.488 | 0.000 | 0.012 | 0.227 | 0.000 | 0.273 | 0.000 | ||
| 5 spectra, FPVEMTHNHNFR | 0.000 | 0.456 | 0.000 | 0.000 | 0.121 | 0.127 | 0.296 | 0.000 | ||
| 1 spectrum, TSCLLFMGR | 0.000 | 0.043 | 0.151 | 0.380 | 0.000 | 0.000 | 0.426 | 0.000 | ||
| 1 spectrum, TLEAQLTPQVVER | 0.000 | 0.509 | 0.000 | 0.000 | 0.000 | 0.269 | 0.222 | 0.000 | ||
| 2 spectra, IIIDLFK | 0.000 | 0.471 | 0.000 | 0.000 | 0.205 | 0.000 | 0.324 | 0.000 | ||
| 2 spectra, FAFNLYR | 0.000 | 0.533 | 0.000 | 0.016 | 0.186 | 0.000 | 0.265 | 0.000 |
| Plot | Mito | Lyso or Perox | ER | Golgi | PM | Cytosol | Nucleus | ||||||
| Expt B |
6 peptides |
9 spectra |
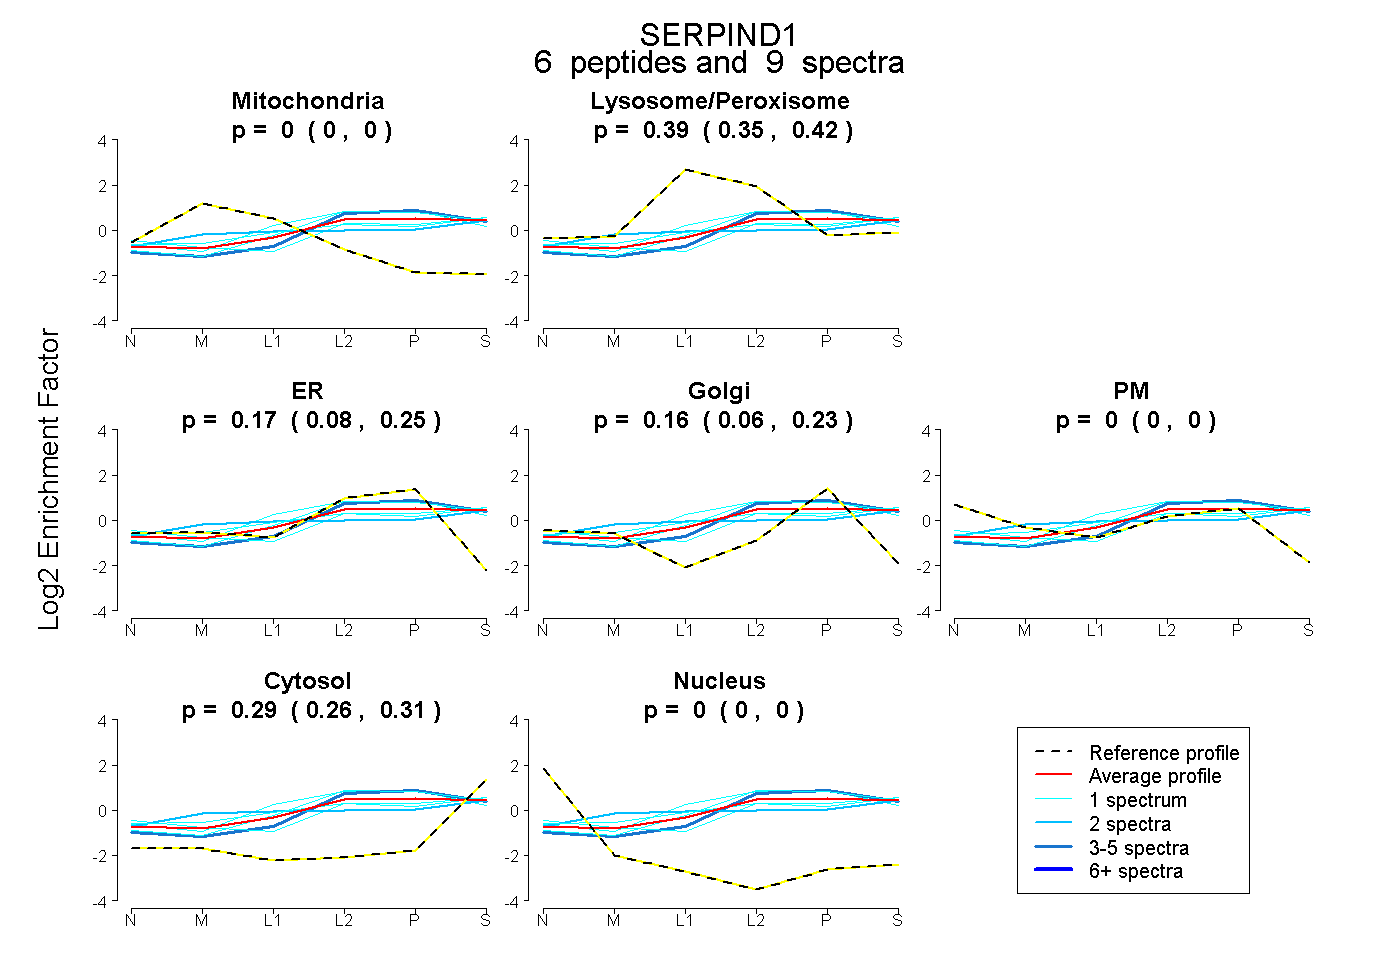 |
0.000 0.000 | 0.000 |
0.387 0.346 | 0.421 |
0.169 0.077 | 0.254 |
0.156 0.064 | 0.226 |
0.000 0.000 | 0.000 |
0.288 0.260 | 0.312 |
0.000 0.000 | 0.000 |
|||
| Plot | Lyso | Other | |||||||||||
| Expt C |
12 peptides |
53 spectra |
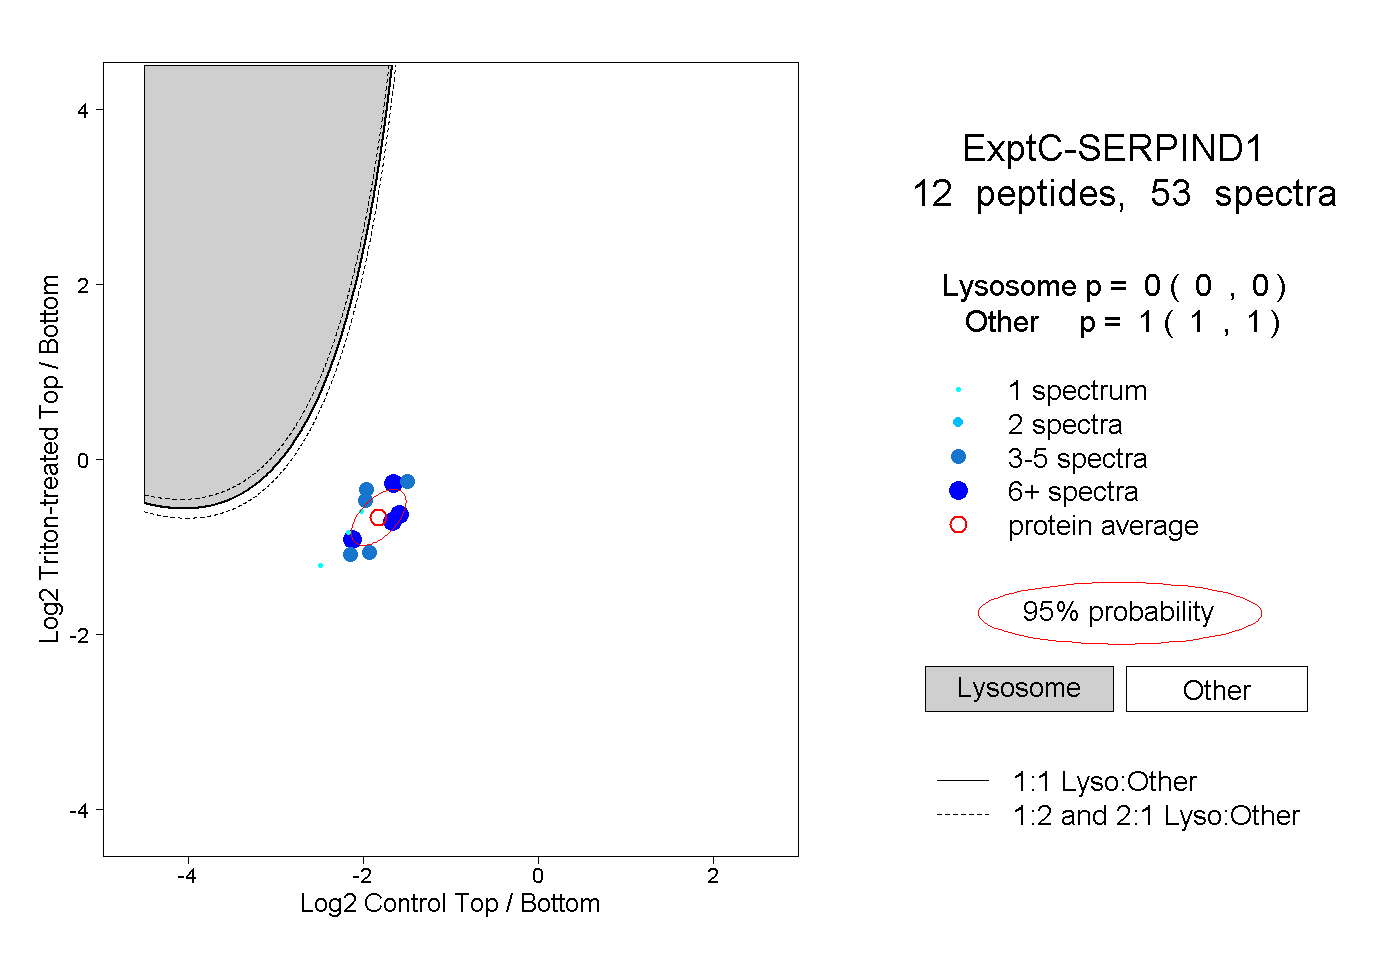 |
0.000 0.000 | 0.000 |
1.000 1.000 | 1.000 |
||||||||
| Plot | Lyso | Other | |||||||||||
| Expt D |
1 peptide |
1 spectrum |
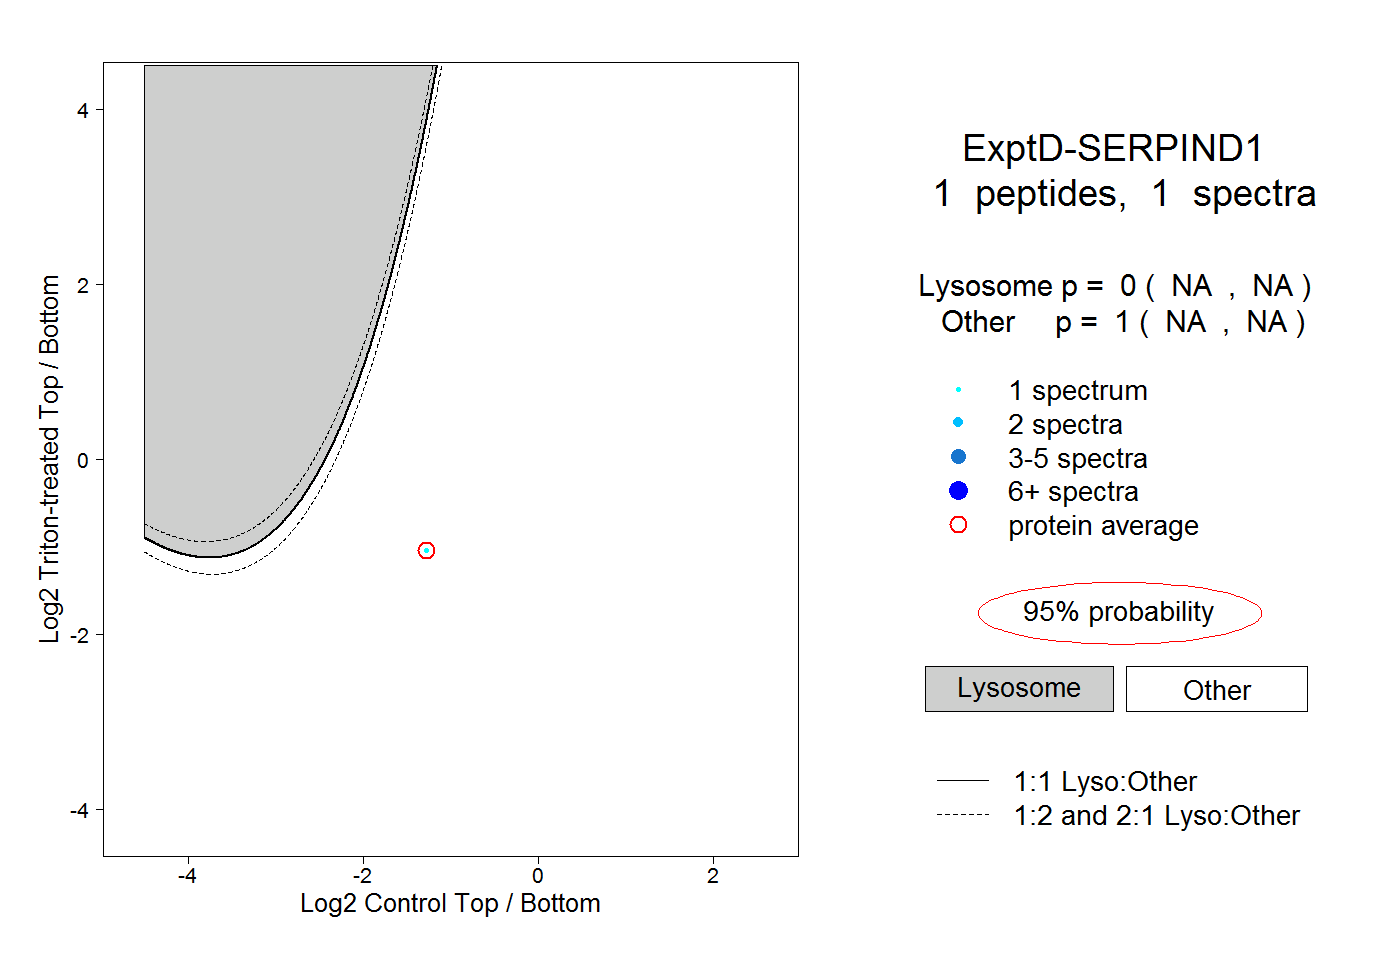 |
0.000 NA | NA |
1.000 NA | NA |