 9
9peptides
spectra
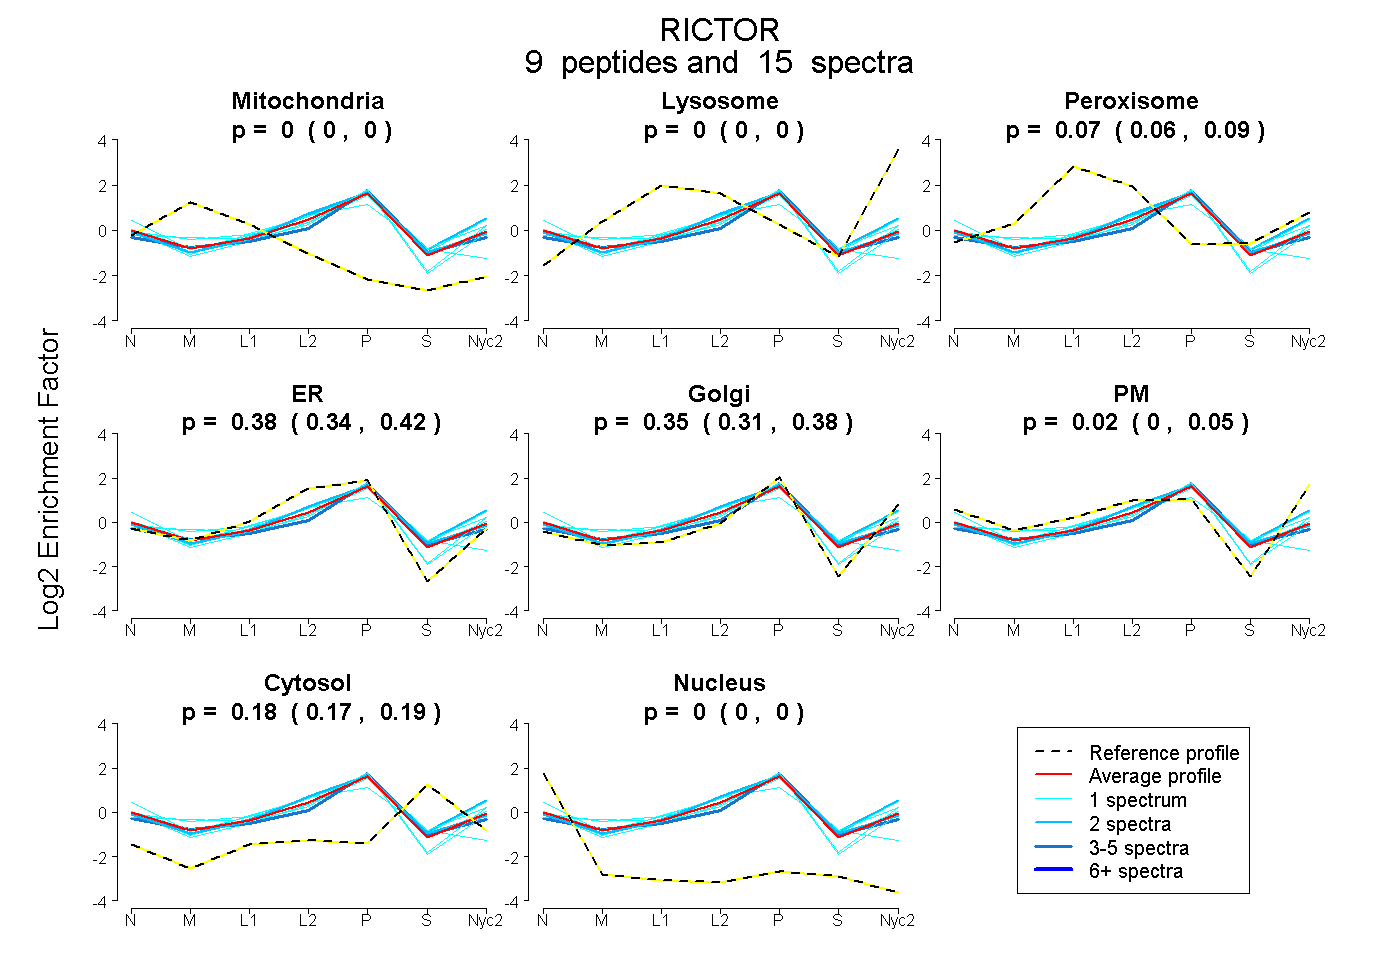
0.000 | 0.000
0.000 | 0.000
0.059 | 0.087
0.337 | 0.417
0.310 | 0.384
0.000 | 0.045
0.165 | 0.186
0.000 | 0.000
2peptides
spectra
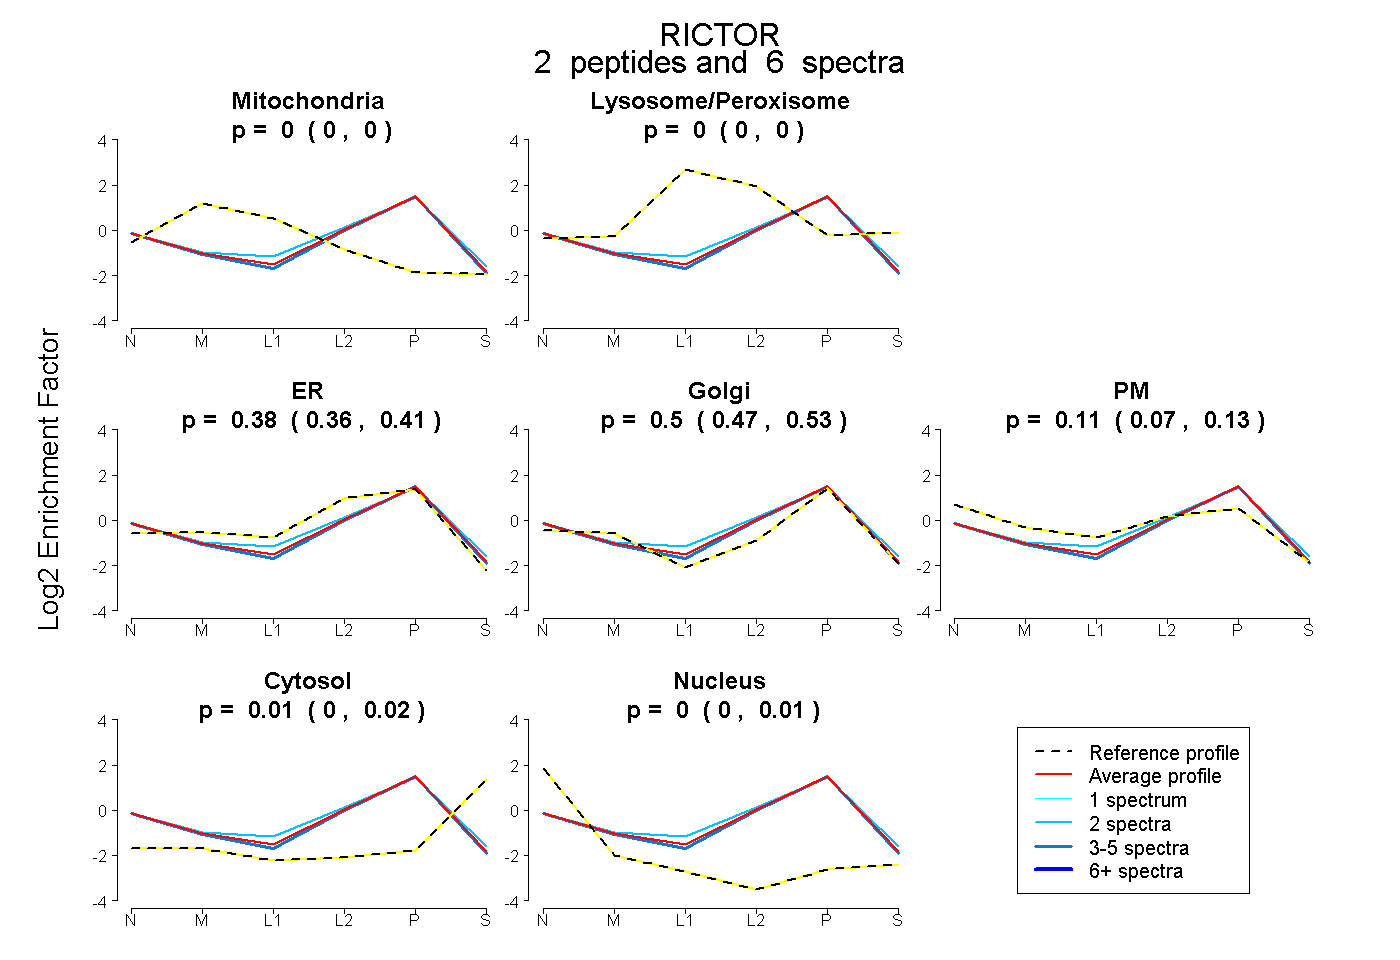
0.000 | 0.000
0.000 | 0.000
0.361 | 0.410
0.467 | 0.525
0.069 | 0.126
0.000 | 0.016
0.000 | 0.013
8peptides
spectra
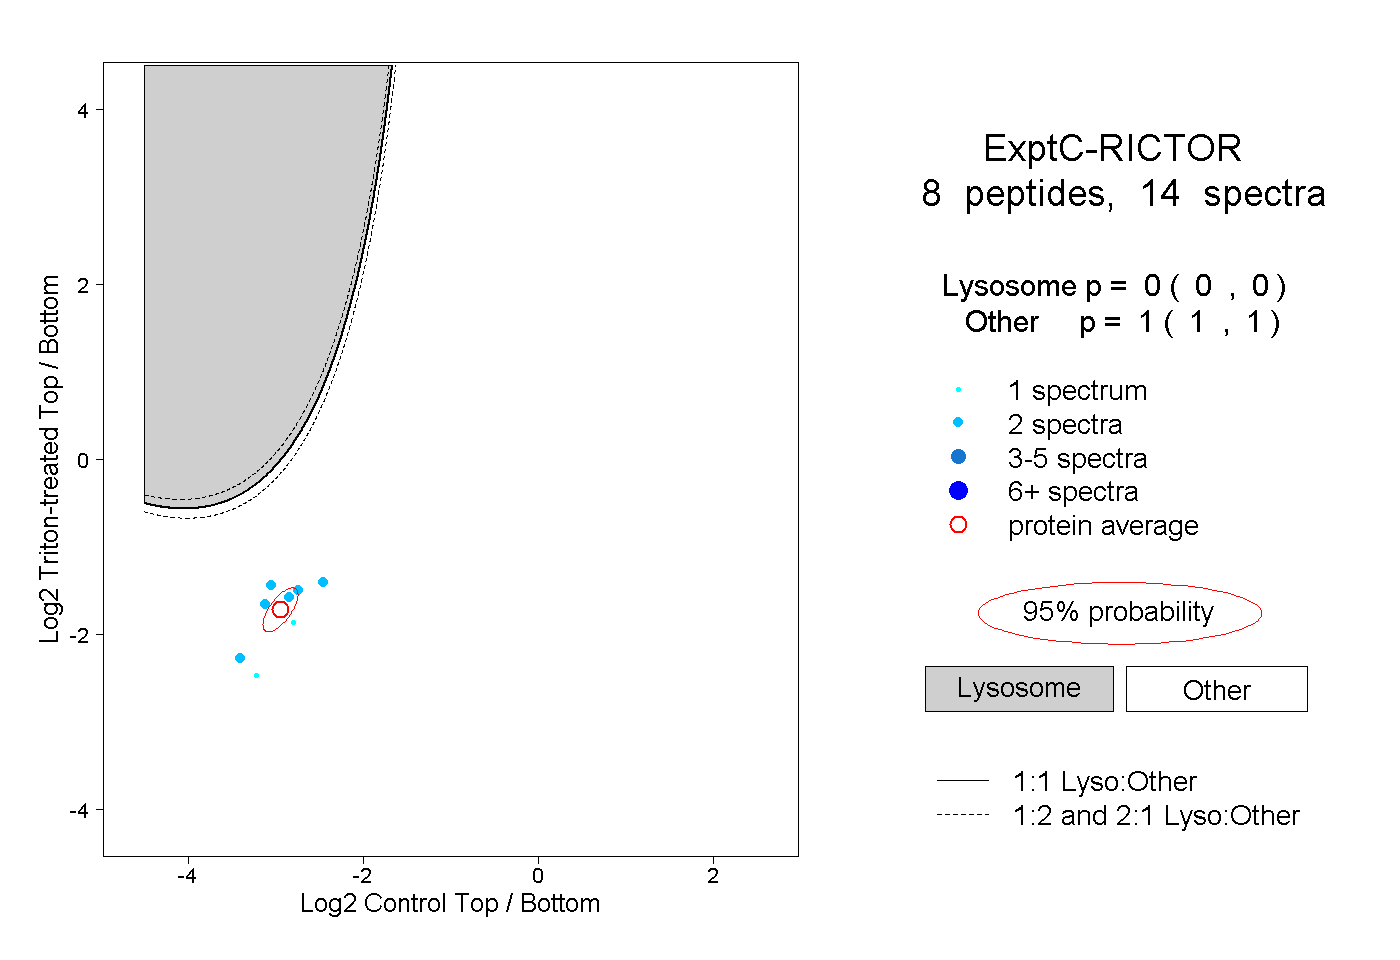
0.000 | 0.000
1.000 | 1.000
2peptides
spectra
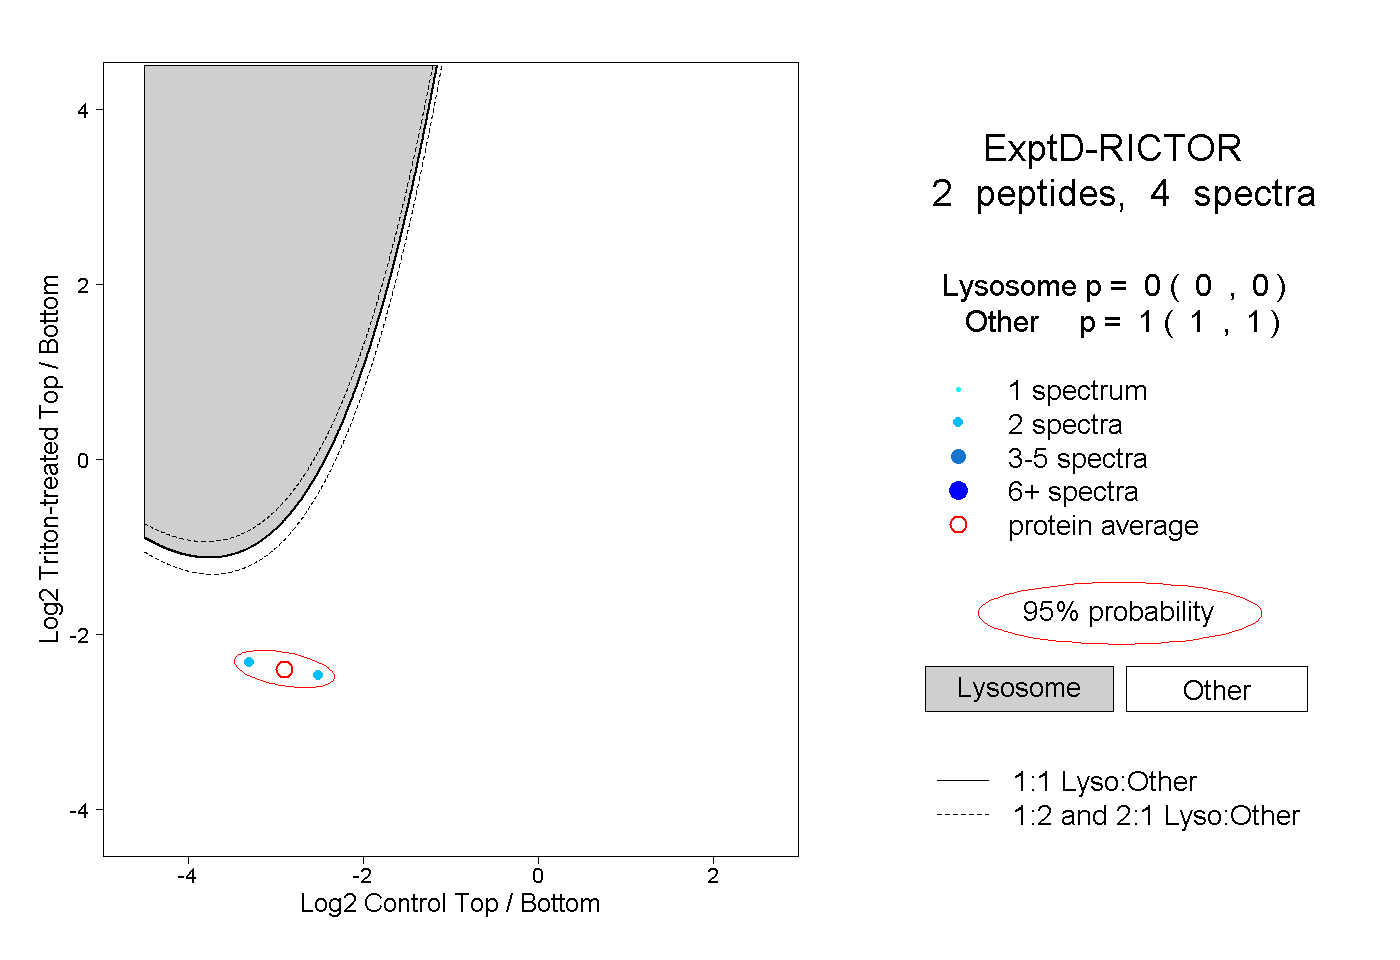
0.000 | 0.000
1.000 | 1.000