RICTOR
[ENSRNOP00000030782]
Main page
| | | Plot |
Mito |
Lyso |
|
Perox |
ER |
Golgi |
PM |
Cytosol |
Nucleus |
|
| Expt A |
 9
9
peptides |
15
spectra |
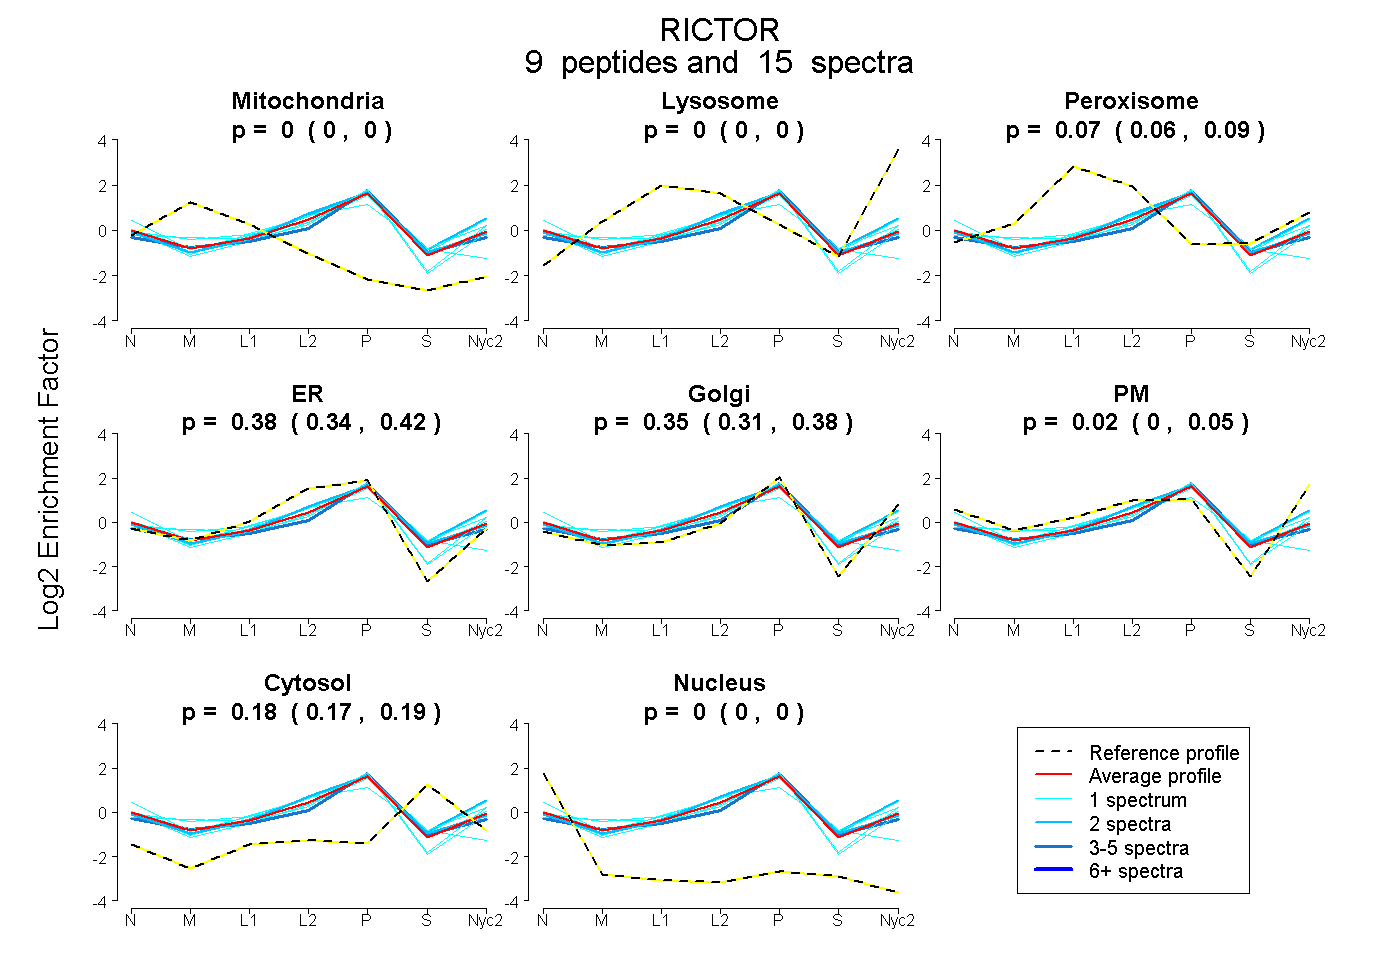 |
0.000
0.000 | 0.000 |
0.000
0.000 | 0.000 |
|
0.075
0.059 | 0.087 |
0.380
0.337 | 0.417 |
0.352
0.310 | 0.384 |
0.018
0.000 | 0.045 |
0.175
0.165 | 0.186 |
0.000
0.000 | 0.000 |
|
| | | Plot |
Mito |
|
Lyso or Perox |
|
ER |
Golgi |
PM |
Cytosol |
Nucleus |
|
| Expt B |
2
peptides |
6
spectra |
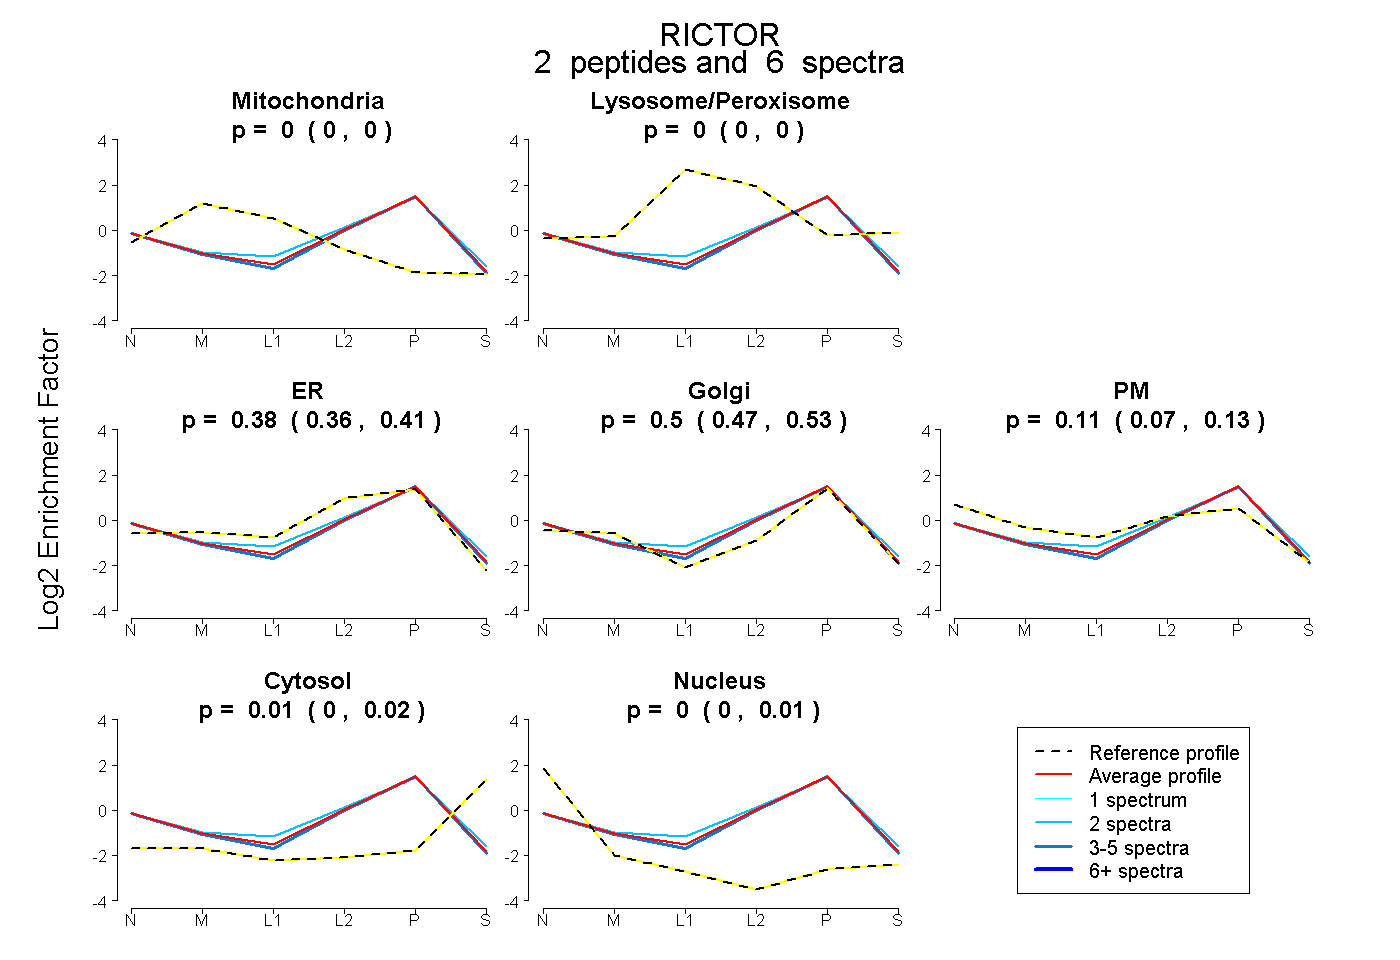 |
0.000
0.000 | 0.000 |
|
0.000
0.000 | 0.000 |
|
0.378
0.361 | 0.410 |
0.501
0.467 | 0.525 |
0.112
0.069 | 0.126 |
0.009
0.000 | 0.016 |
0.000
0.000 | 0.013 |
|
| 2 spectra, ADVELER |
0.000 |
|
0.085 |
|
0.313 |
0.506 |
0.095 |
0.000 |
0.000 |
|
| 4 spectra, GLLLLLR |
0.000 |
|
0.000 |
|
0.398 |
0.555 |
0.025 |
0.000 |
0.021 |
|
| | | Plot |
|
Lyso |
|
|
|
|
|
|
|
Other |
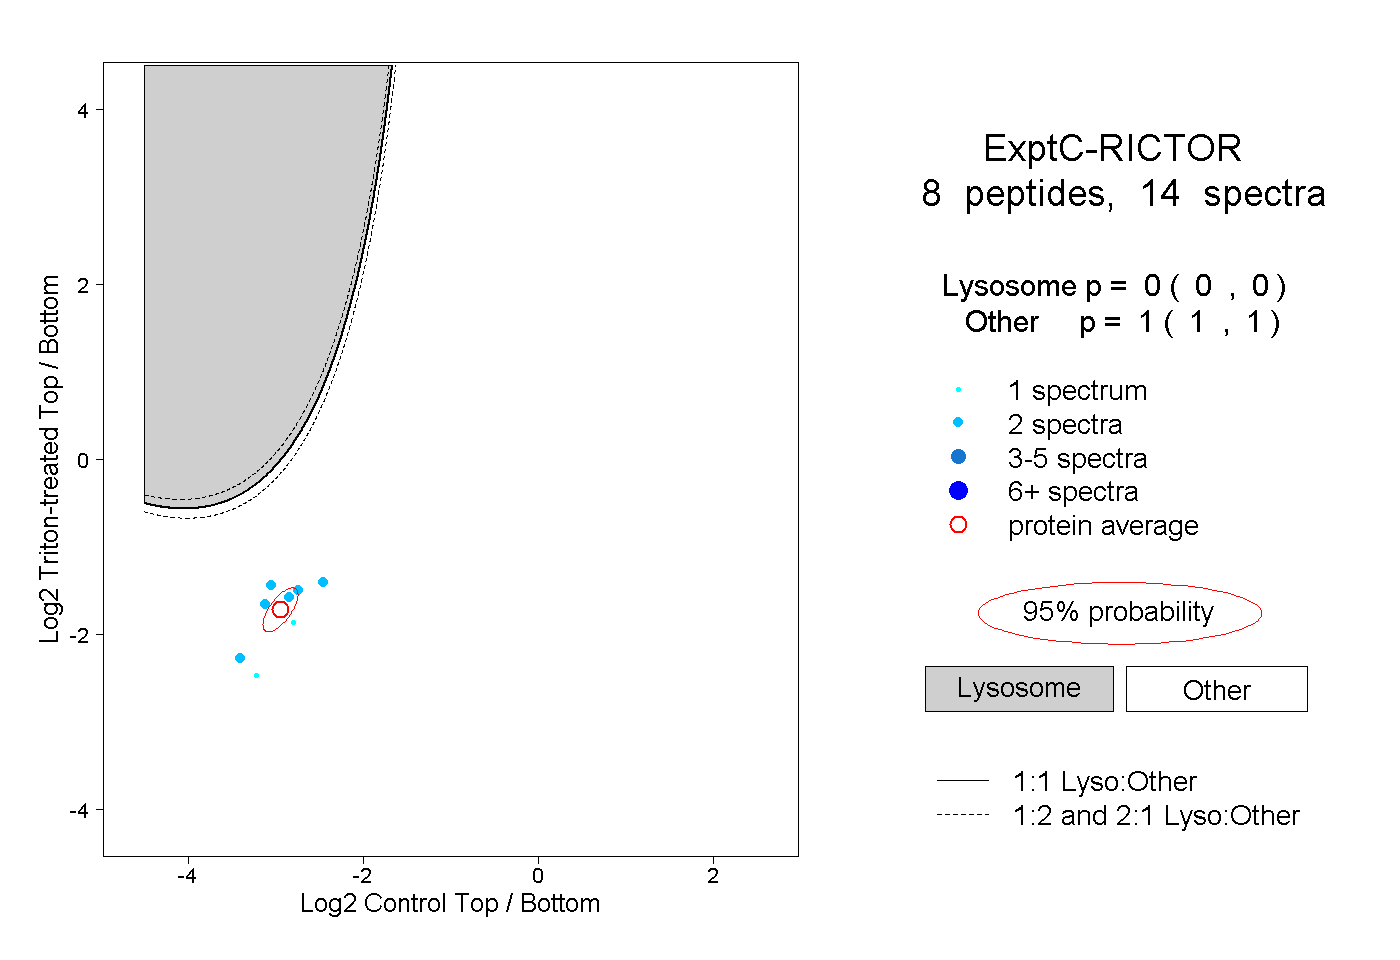
| Expt C |
8
peptides |
14
spectra |
 |
|
0.000
0.000 | 0.000 |
|
|
|
|
|
|
|
1.000
1.000 | 1.000 |
| | | Plot |
|
Lyso |
|
|
|
|
|
|
|
Other |
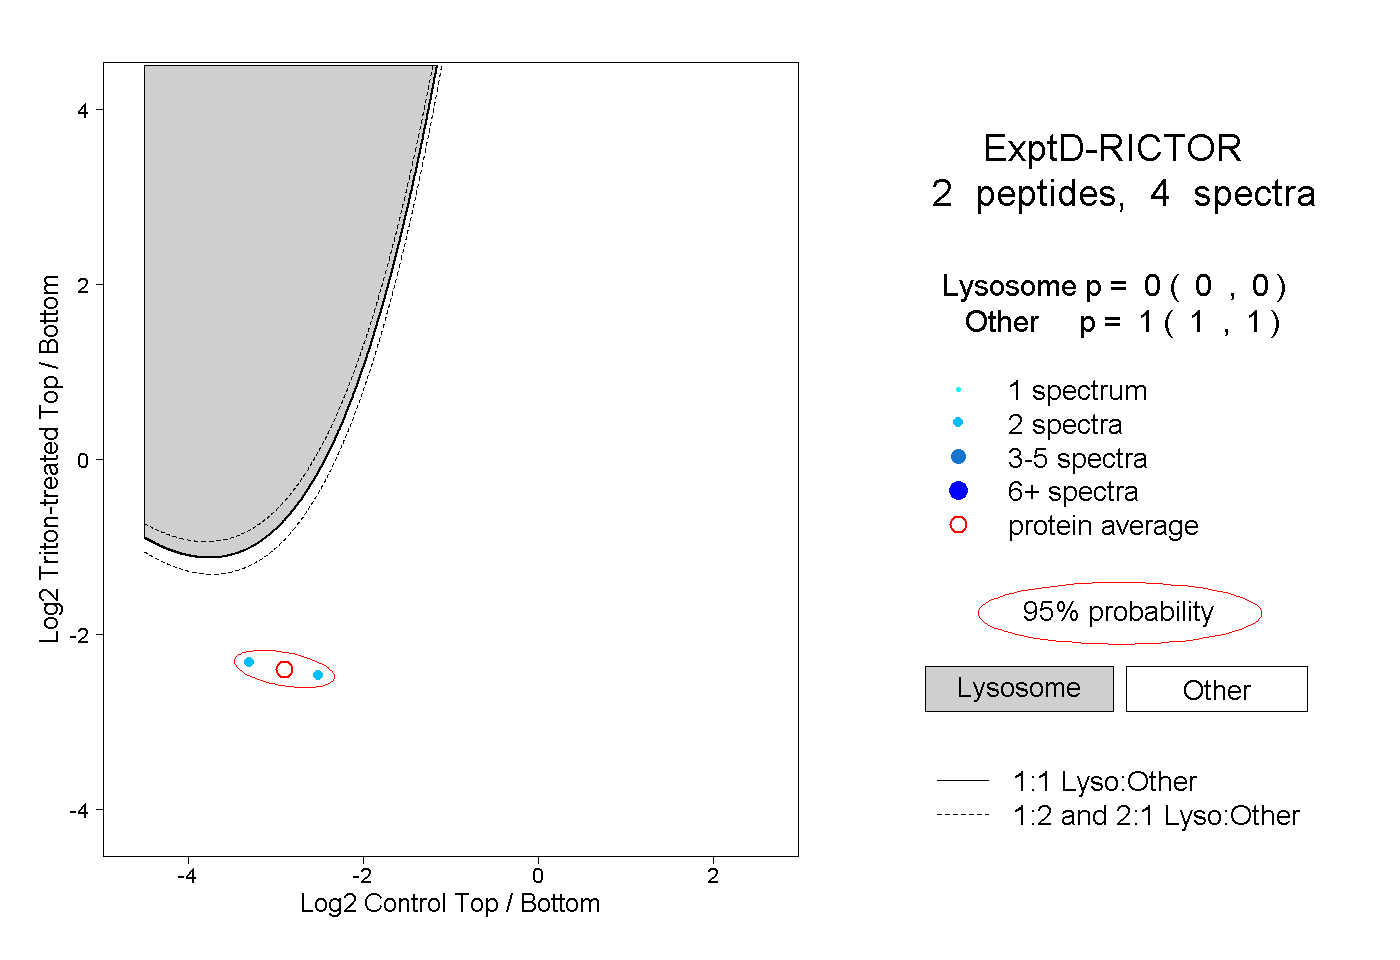
| Expt D |
2
peptides |
4
spectra |
 |
|
0.000
0.000 | 0.000 |
|
|
|
|
|
|
|
1.000
1.000 | 1.000 |