 9
9peptides
spectra
0.000 | 0.000
0.000 | 0.000
0.059 | 0.087
0.337 | 0.417
0.310 | 0.384
0.000 | 0.045
0.165 | 0.186
0.000 | 0.000
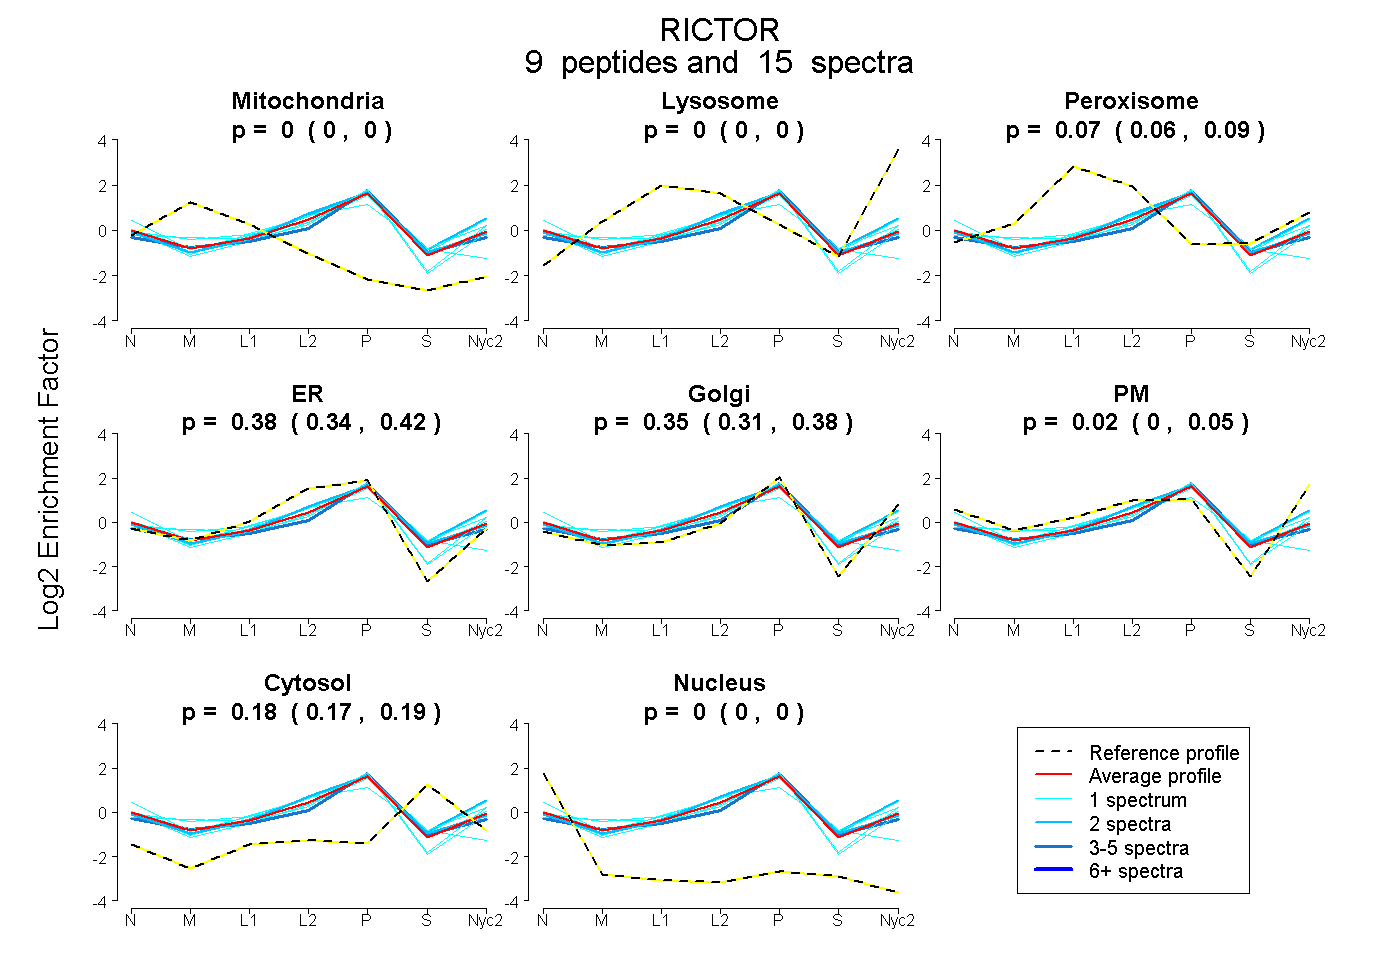
| Plot | Mito | Lyso | Perox | ER | Golgi | PM | Cytosol | Nucleus | |||||
| Expt A |
9 peptides |
15 spectra |
|
0.000 0.000 | 0.000 |
0.000 0.000 | 0.000 |
0.075 0.059 | 0.087 |
0.380 0.337 | 0.417 |
0.352 0.310 | 0.384 |
0.018 0.000 | 0.045 |
0.175 0.165 | 0.186 |
0.000 0.000 | 0.000 |
| 1 spectrum, WPNVNLR | 0.000 | 0.000 | 0.080 | 0.245 | 0.601 | 0.008 | 0.042 | 0.024 | ||
| 2 spectra, ADVELER | 0.000 | 0.000 | 0.091 | 0.210 | 0.347 | 0.177 | 0.177 | 0.000 | ||
| 1 spectrum, ASAALNCLK | 0.000 | 0.000 | 0.000 | 0.679 | 0.000 | 0.000 | 0.285 | 0.035 | ||
| 2 spectra, TILPHR | 0.000 | 0.000 | 0.044 | 0.522 | 0.206 | 0.018 | 0.210 | 0.000 | ||
| 1 spectrum, LLYFYKPSSK | 0.083 | 0.000 | 0.041 | 0.378 | 0.466 | 0.000 | 0.032 | 0.000 | ||
| 5 spectra, GLLLLLR | 0.000 | 0.000 | 0.024 | 0.378 | 0.368 | 0.000 | 0.230 | 0.000 | ||
| 1 spectrum, LTVSSLDYSR | 0.000 | 0.000 | 0.114 | 0.220 | 0.366 | 0.145 | 0.155 | 0.000 | ||
| 1 spectrum, GGLNTILK | 0.012 | 0.000 | 0.168 | 0.228 | 0.463 | 0.000 | 0.129 | 0.000 | ||
| 1 spectrum, EPSDNLR | 0.000 | 0.000 | 0.032 | 0.314 | 0.000 | 0.397 | 0.257 | 0.000 |
| Plot | Mito | Lyso or Perox | ER | Golgi | PM | Cytosol | Nucleus | ||||||
| Expt B |
2 peptides |
6 spectra |
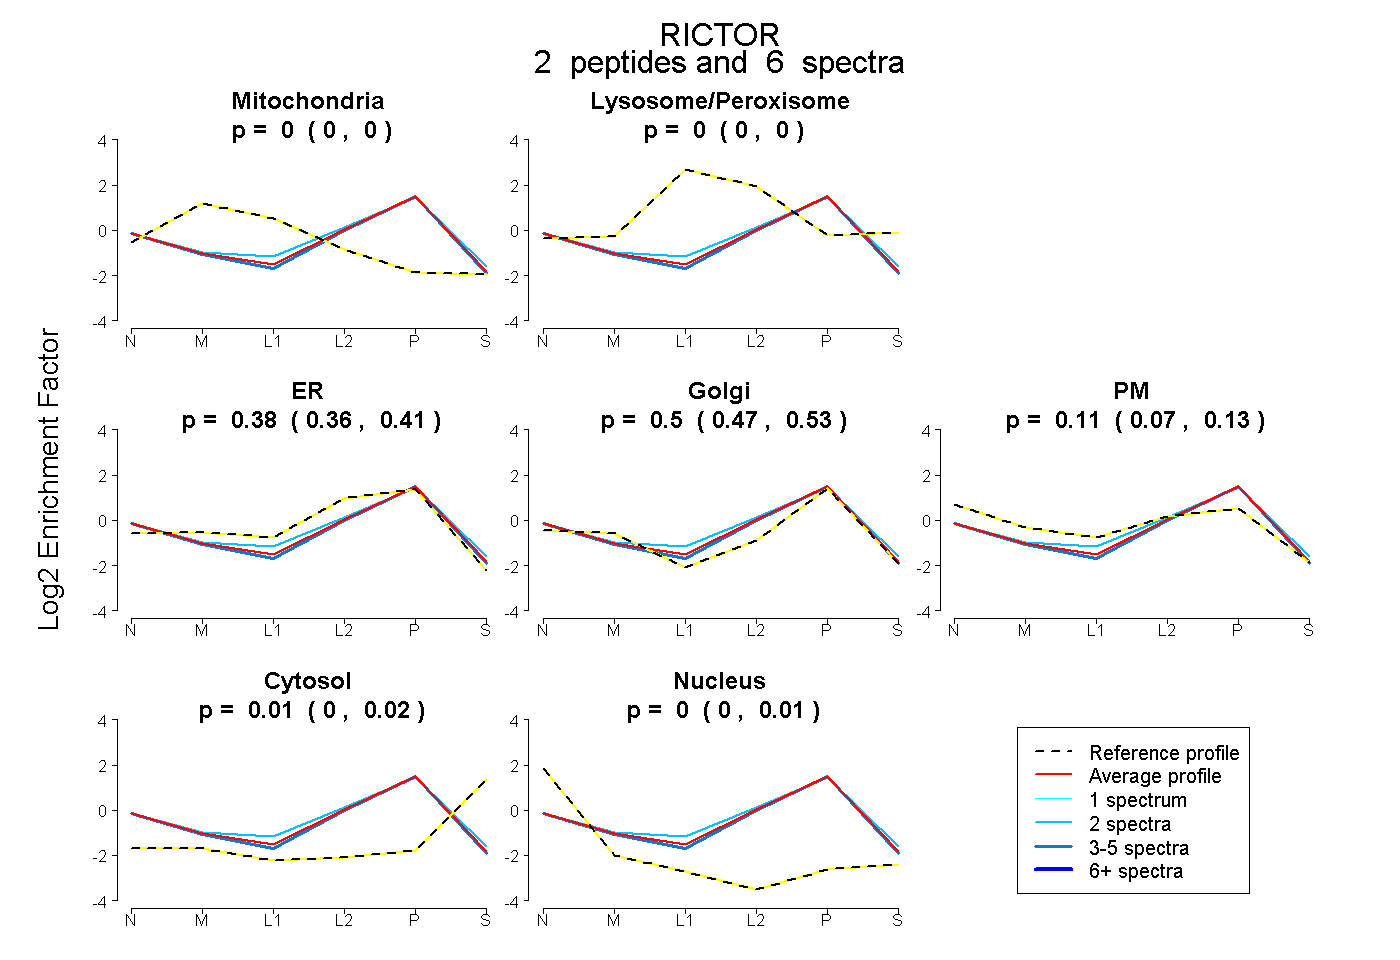 |
0.000 0.000 | 0.000 |
0.000 0.000 | 0.000 |
0.378 0.361 | 0.410 |
0.501 0.467 | 0.525 |
0.112 0.069 | 0.126 |
0.009 0.000 | 0.016 |
0.000 0.000 | 0.013 |
|||
| Plot | Lyso | Other | |||||||||||
| Expt C |
8 peptides |
14 spectra |
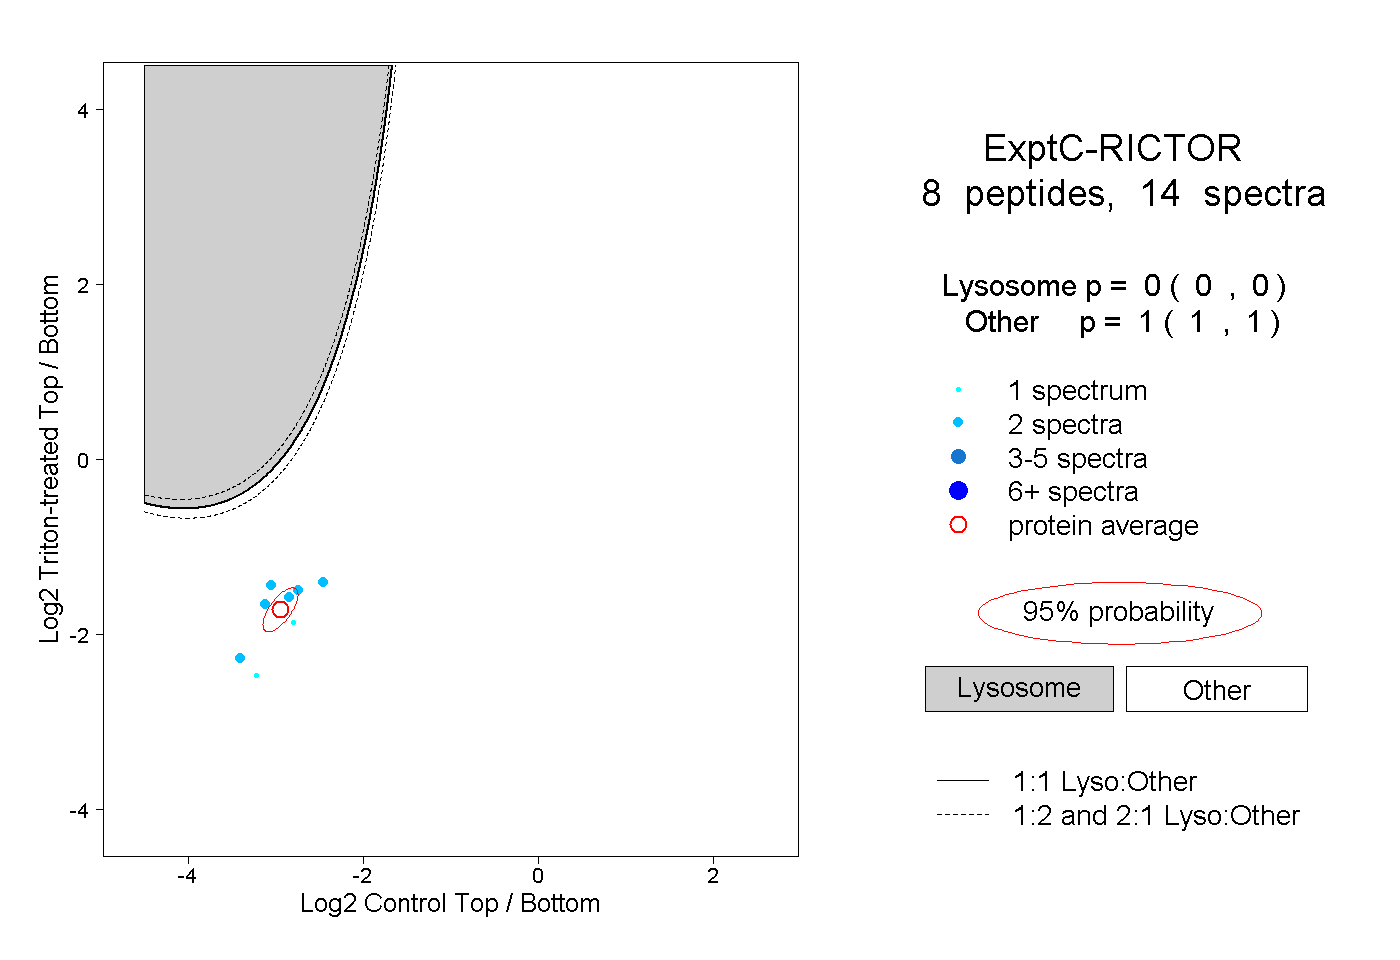 |
0.000 0.000 | 0.000 |
1.000 1.000 | 1.000 |
||||||||
| Plot | Lyso | Other | |||||||||||
| Expt D |
2 peptides |
4 spectra |
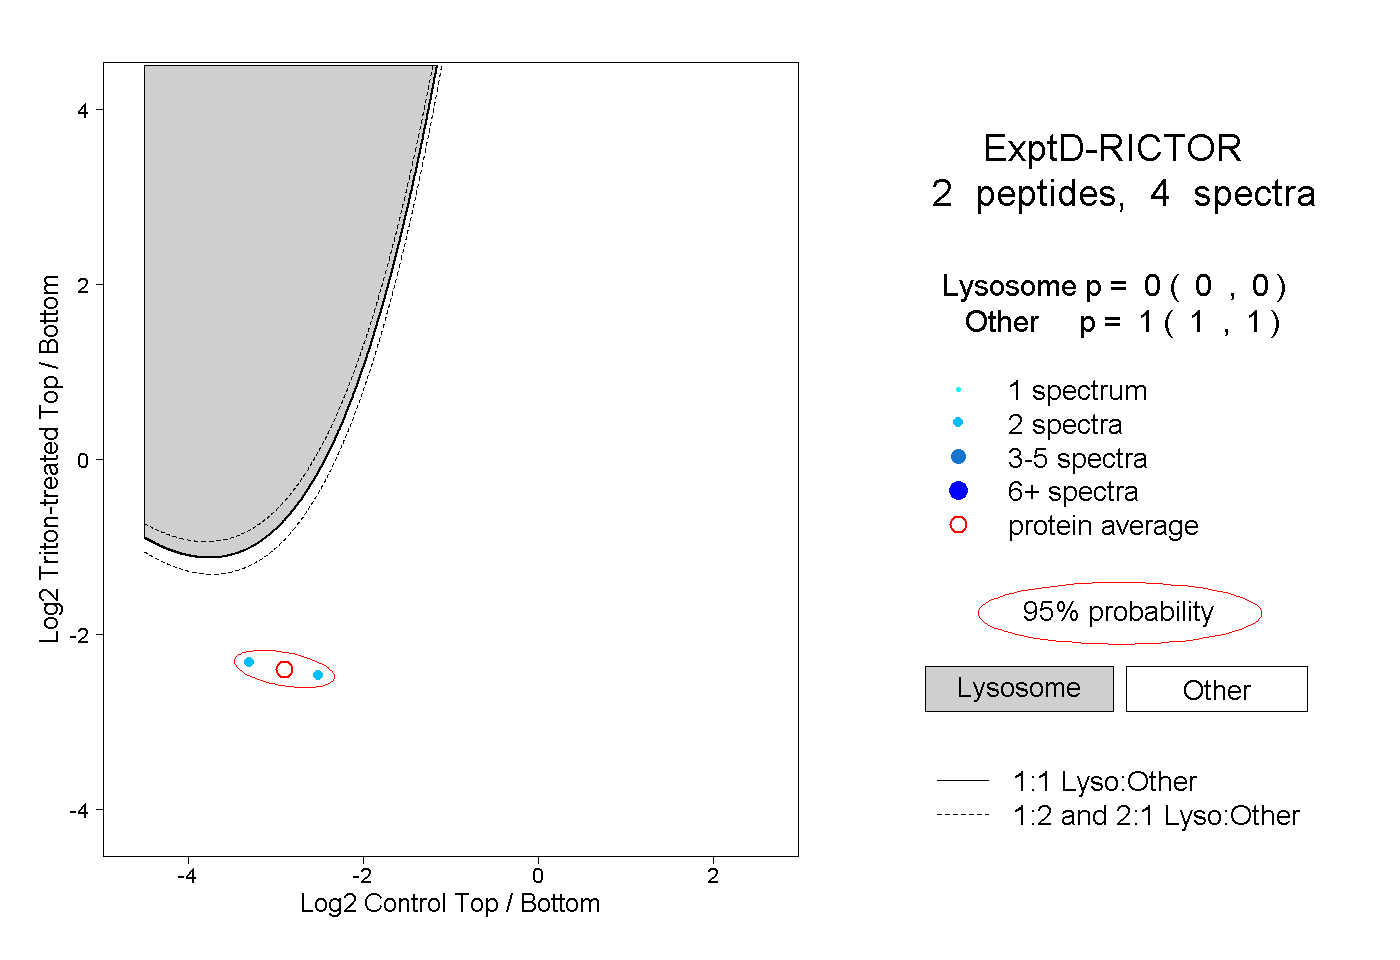 |
0.000 0.000 | 0.000 |
1.000 1.000 | 1.000 |