 15
15peptides
spectra
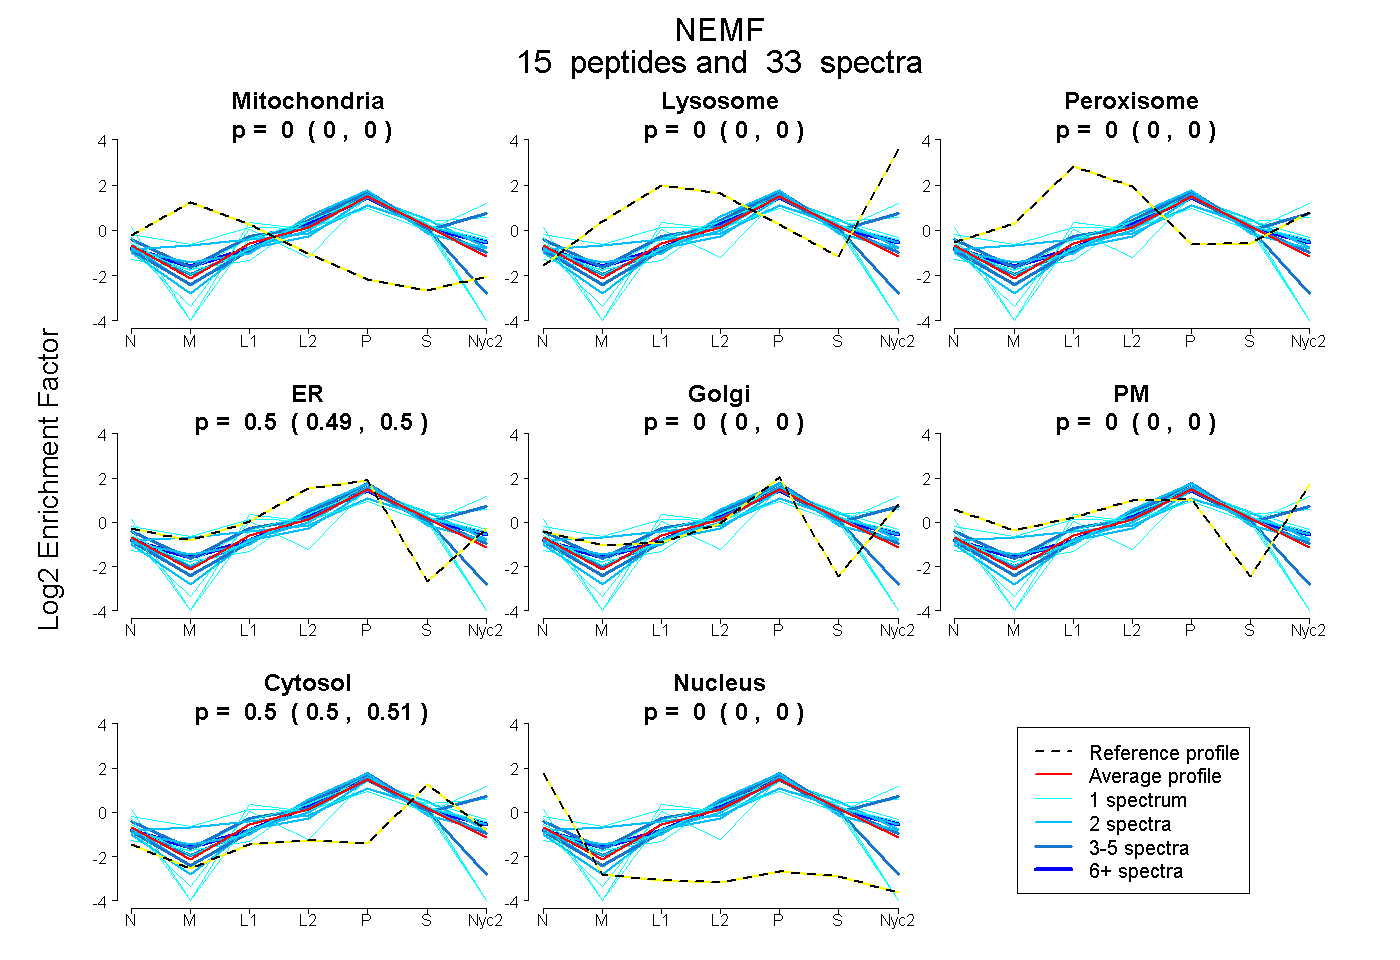
0.000 | 0.000
0.000 | 0.000
0.000 | 0.000
0.494 | 0.503
0.000 | 0.000
0.000 | 0.000
0.496 | 0.506
0.000 | 0.000
6peptides
spectra
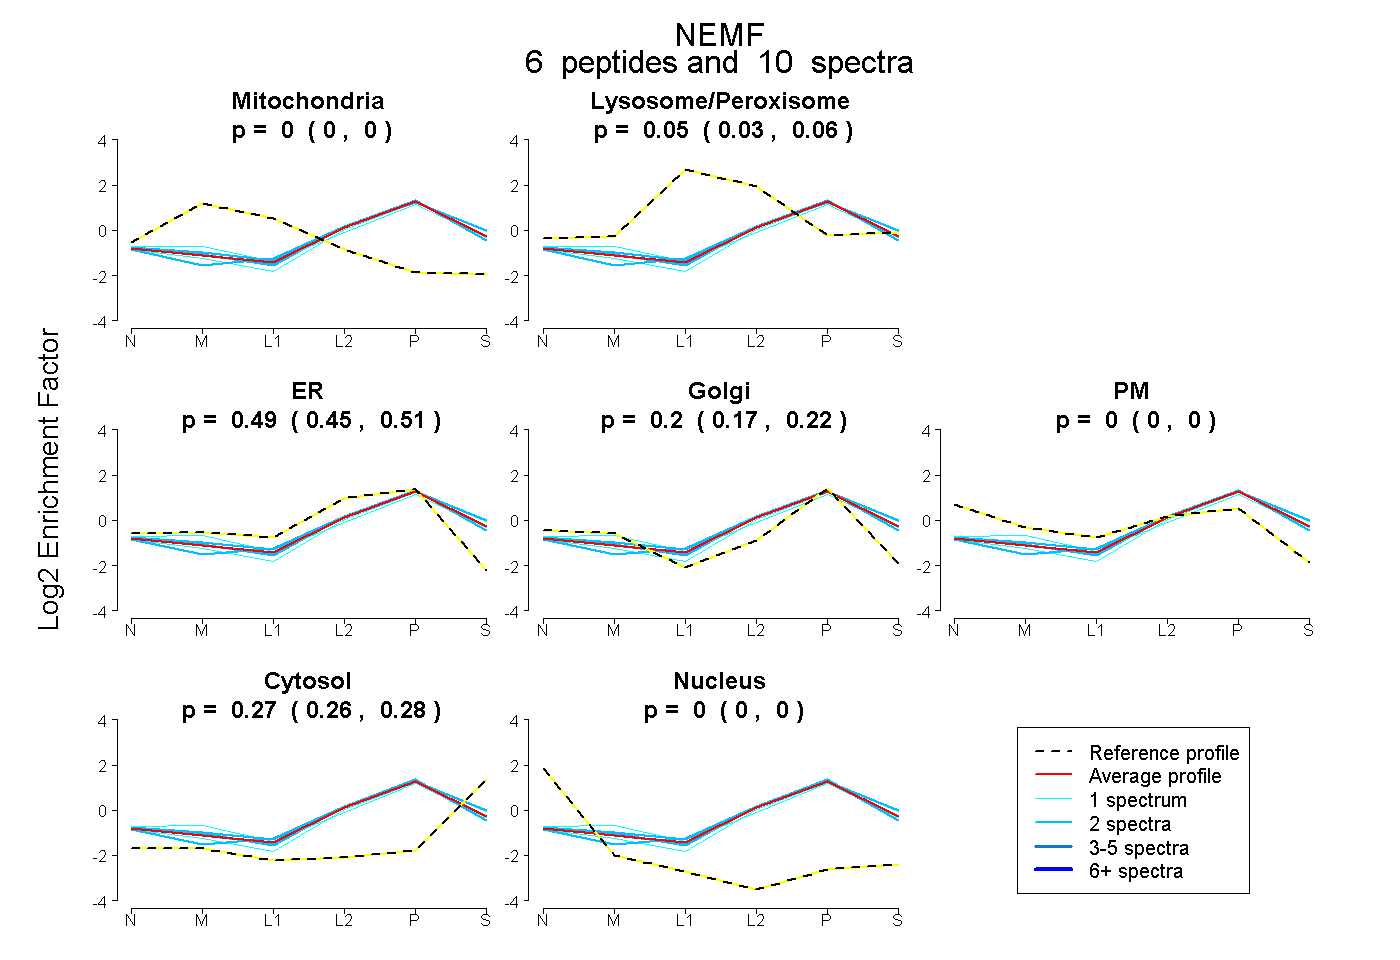
0.000 | 0.000
0.032 | 0.062
0.450 | 0.514
0.171 | 0.224
0.000 | 0.000
0.257 | 0.278
0.000 | 0.000
13peptides
spectra
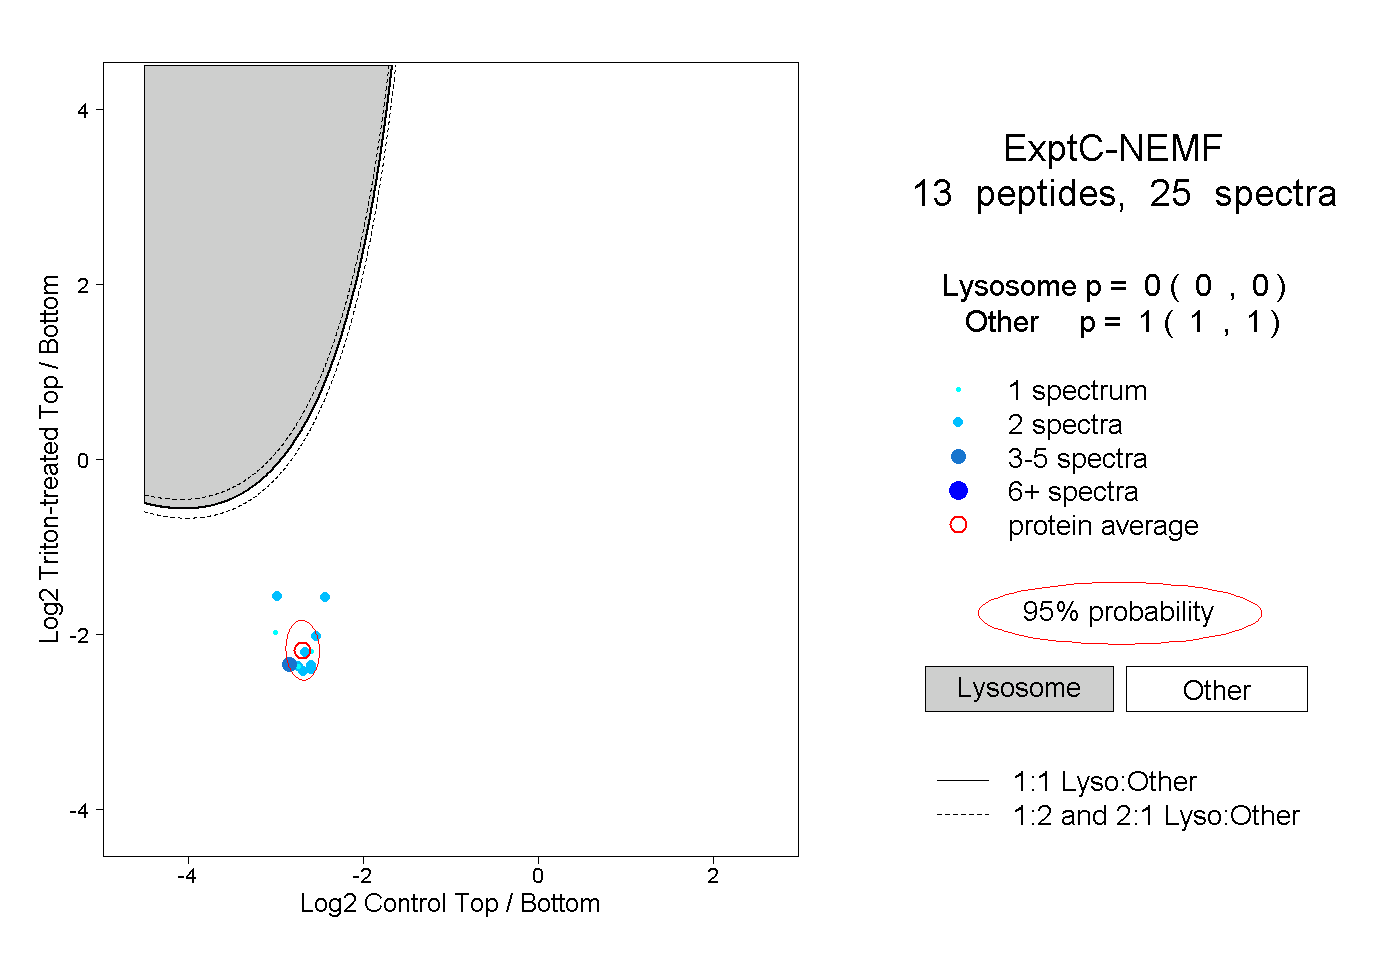
0.000 | 0.000
1.000 | 1.000
2peptides
spectra
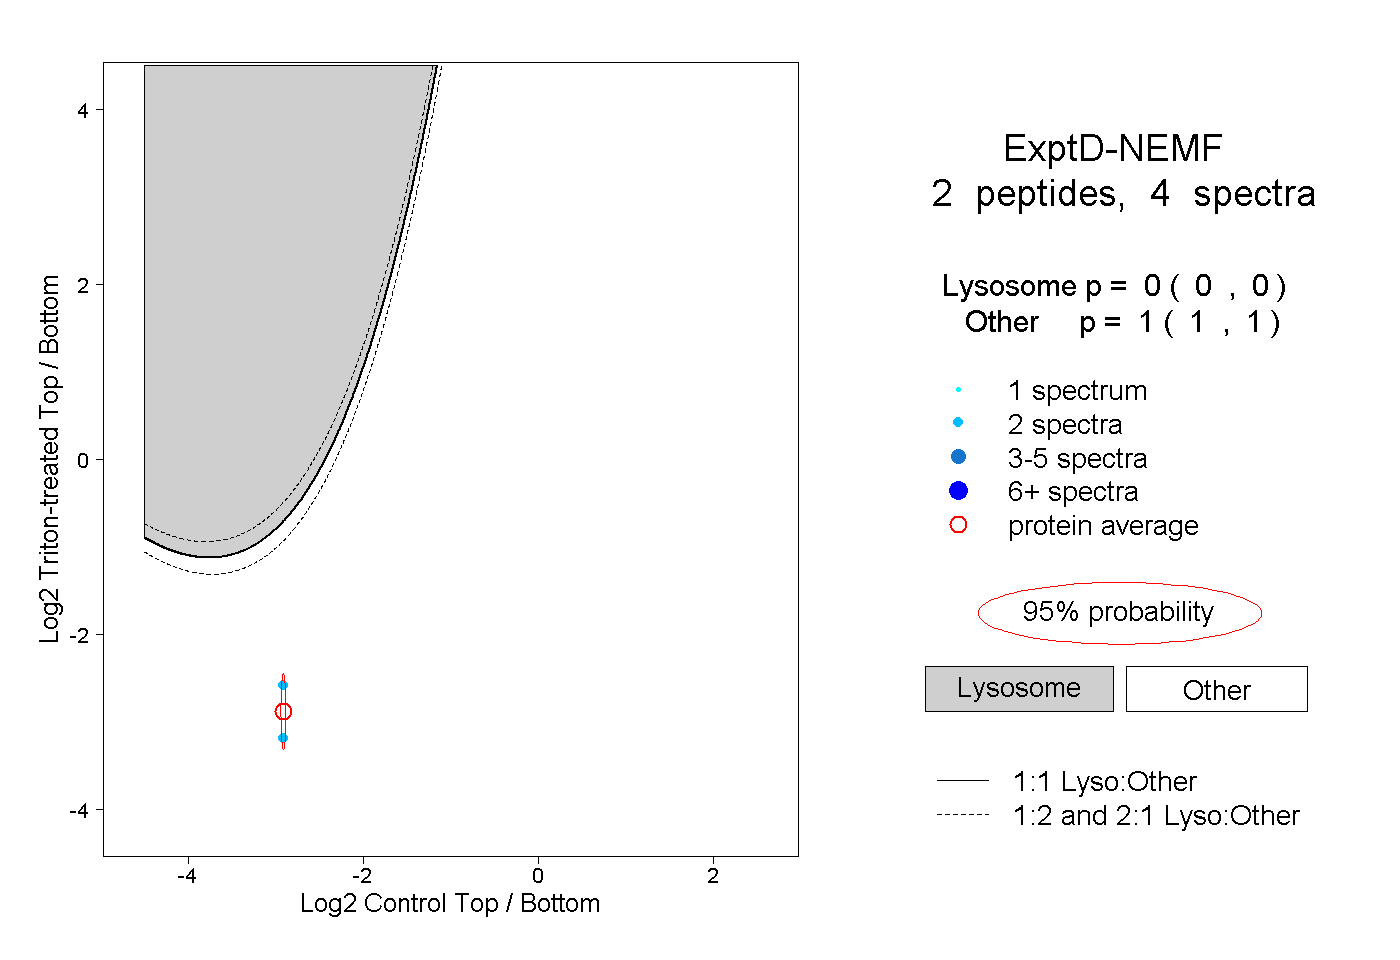
0.000 | 0.000
1.000 | 1.000