 15
15peptides
spectra
0.000 | 0.000
0.000 | 0.000
0.000 | 0.000
0.494 | 0.503
0.000 | 0.000
0.000 | 0.000
0.496 | 0.506
0.000 | 0.000
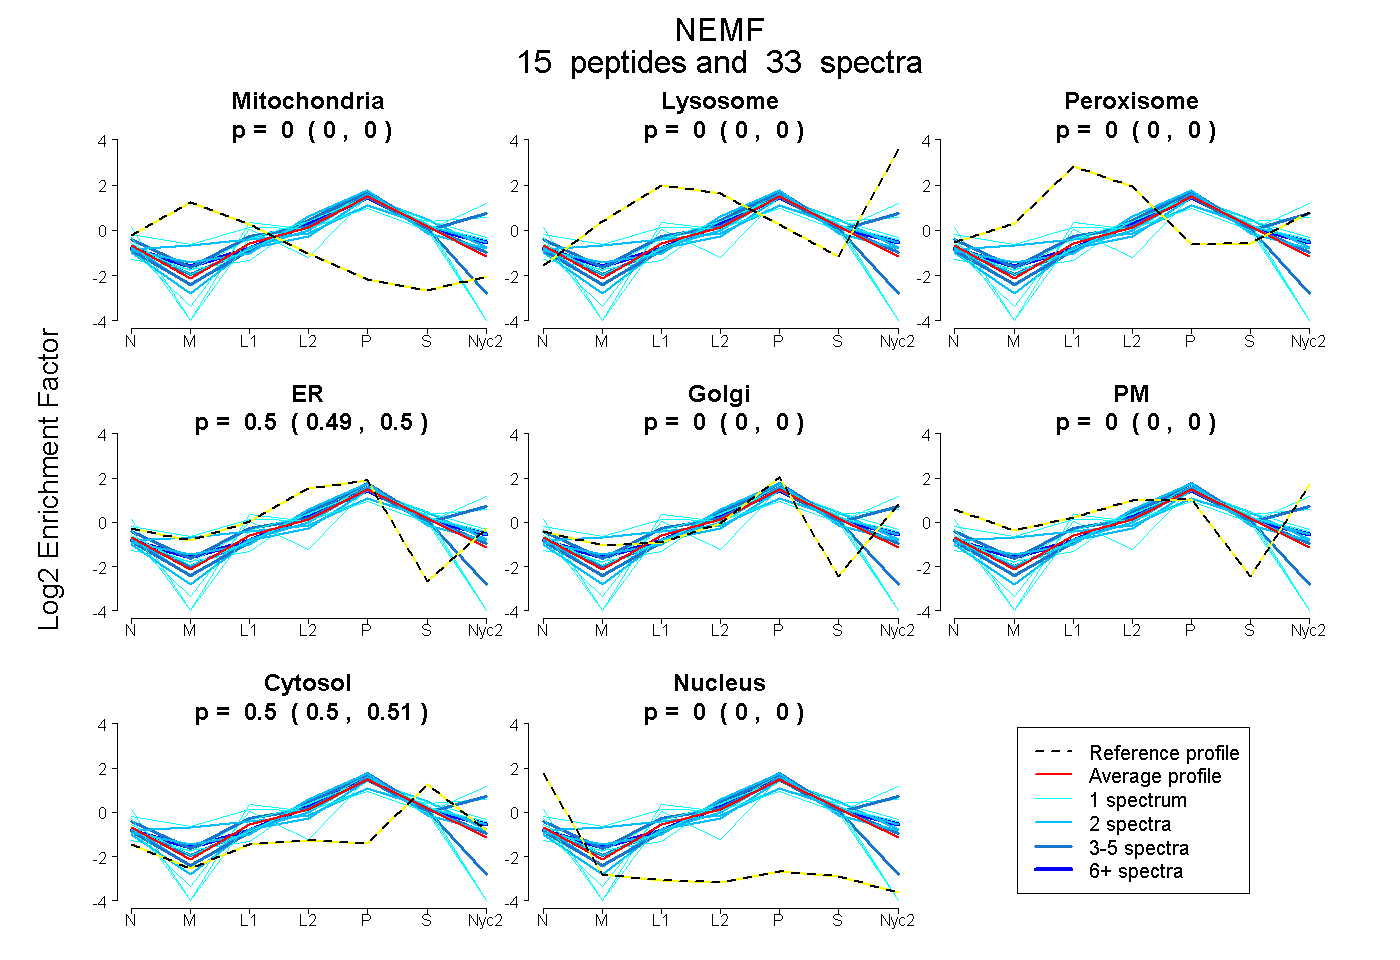
| Plot | Mito | Lyso | Perox | ER | Golgi | PM | Cytosol | Nucleus | |||||
| Expt A |
15 peptides |
33 spectra |
|
0.000 0.000 | 0.000 |
0.000 0.000 | 0.000 |
0.000 0.000 | 0.000 |
0.499 0.494 | 0.503 |
0.000 0.000 | 0.000 |
0.000 0.000 | 0.000 |
0.501 0.496 | 0.506 |
0.000 0.000 | 0.000 |
| 1 spectrum, VNNVYDVDNK | 0.000 | 0.000 | 0.000 | 0.385 | 0.000 | 0.000 | 0.475 | 0.140 | ||
| 6 spectra, AEDYLEK | 0.000 | 0.000 | 0.000 | 0.443 | 0.099 | 0.000 | 0.458 | 0.000 | ||
| 4 spectra, LQTNHITMLLR | 0.000 | 0.106 | 0.076 | 0.024 | 0.486 | 0.000 | 0.308 | 0.000 | ||
| 2 spectra, LTEVIAR | 0.000 | 0.000 | 0.000 | 0.560 | 0.038 | 0.000 | 0.401 | 0.000 | ||
| 2 spectra, VDESCVWR | 0.011 | 0.000 | 0.051 | 0.458 | 0.000 | 0.000 | 0.480 | 0.000 | ||
| 4 spectra, ILVCVQR | 0.000 | 0.000 | 0.000 | 0.491 | 0.000 | 0.000 | 0.481 | 0.027 | ||
| 2 spectra, GTTEEVELR | 0.000 | 0.000 | 0.000 | 0.317 | 0.190 | 0.000 | 0.493 | 0.000 | ||
| 1 spectrum, EVQTVTSIQK | 0.000 | 0.204 | 0.000 | 0.000 | 0.491 | 0.000 | 0.305 | 0.000 | ||
| 1 spectrum, YPIDHAR | 0.228 | 0.000 | 0.000 | 0.392 | 0.000 | 0.000 | 0.318 | 0.062 | ||
| 2 spectra, EELSSEDGEAIK | 0.000 | 0.000 | 0.000 | 0.273 | 0.149 | 0.000 | 0.578 | 0.000 | ||
| 1 spectrum, TDEADDVK | 0.000 | 0.000 | 0.000 | 0.435 | 0.097 | 0.000 | 0.468 | 0.000 | ||
| 1 spectrum, EESFNSSDSK | 0.000 | 0.000 | 0.000 | 0.000 | 0.427 | 0.000 | 0.573 | 0.000 | ||
| 4 spectra, AAEPLLTLER | 0.000 | 0.000 | 0.000 | 0.517 | 0.000 | 0.000 | 0.483 | 0.000 | ||
| 1 spectrum, EAQAQGDPVASAIK | 0.000 | 0.000 | 0.000 | 0.145 | 0.049 | 0.268 | 0.538 | 0.000 | ||
| 1 spectrum, ATLLLESGIR | 0.000 | 0.000 | 0.000 | 0.469 | 0.000 | 0.000 | 0.446 | 0.085 |
| Plot | Mito | Lyso or Perox | ER | Golgi | PM | Cytosol | Nucleus | ||||||
| Expt B |
6 peptides |
10 spectra |
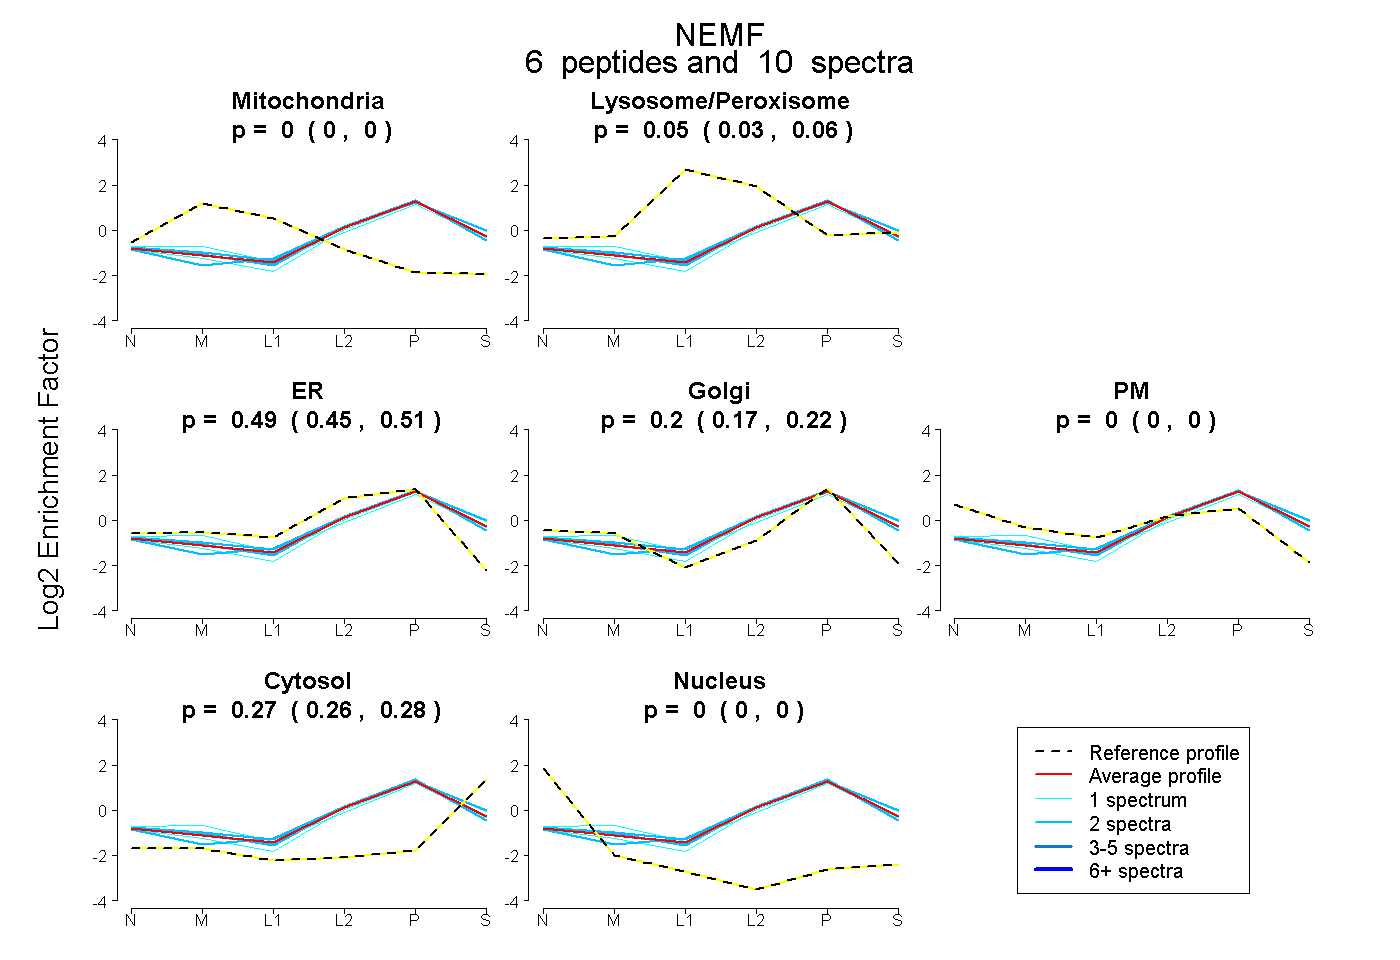 |
0.000 0.000 | 0.000 |
0.048 0.032 | 0.062 |
0.486 0.450 | 0.514 |
0.198 0.171 | 0.224 |
0.000 0.000 | 0.000 |
0.269 0.257 | 0.278 |
0.000 0.000 | 0.000 |
|||
| Plot | Lyso | Other | |||||||||||
| Expt C |
13 peptides |
25 spectra |
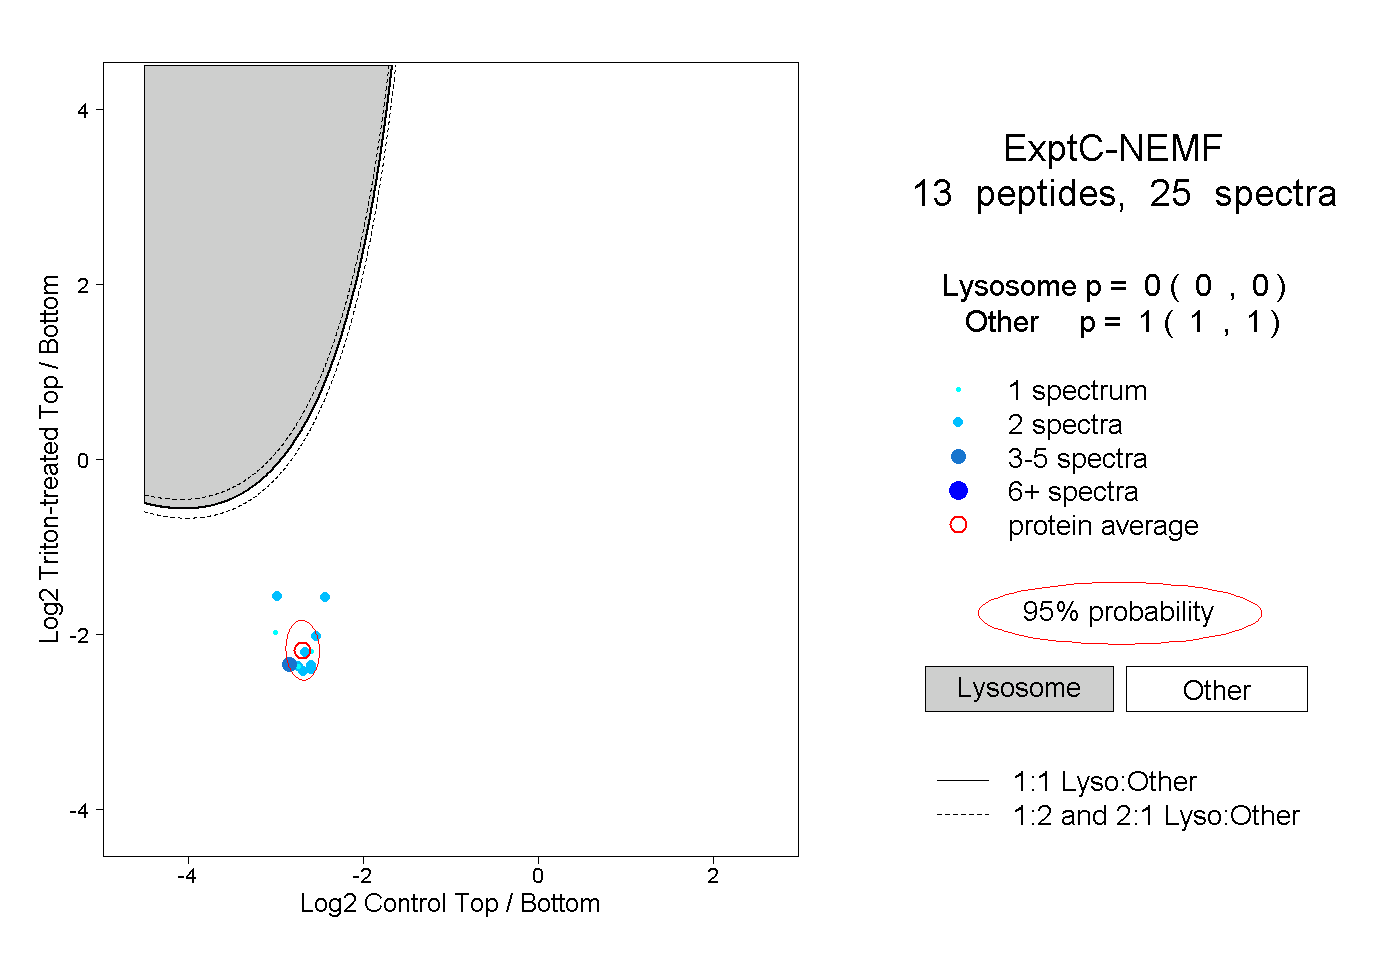 |
0.000 0.000 | 0.000 |
1.000 1.000 | 1.000 |
||||||||
| Plot | Lyso | Other | |||||||||||
| Expt D |
2 peptides |
4 spectra |
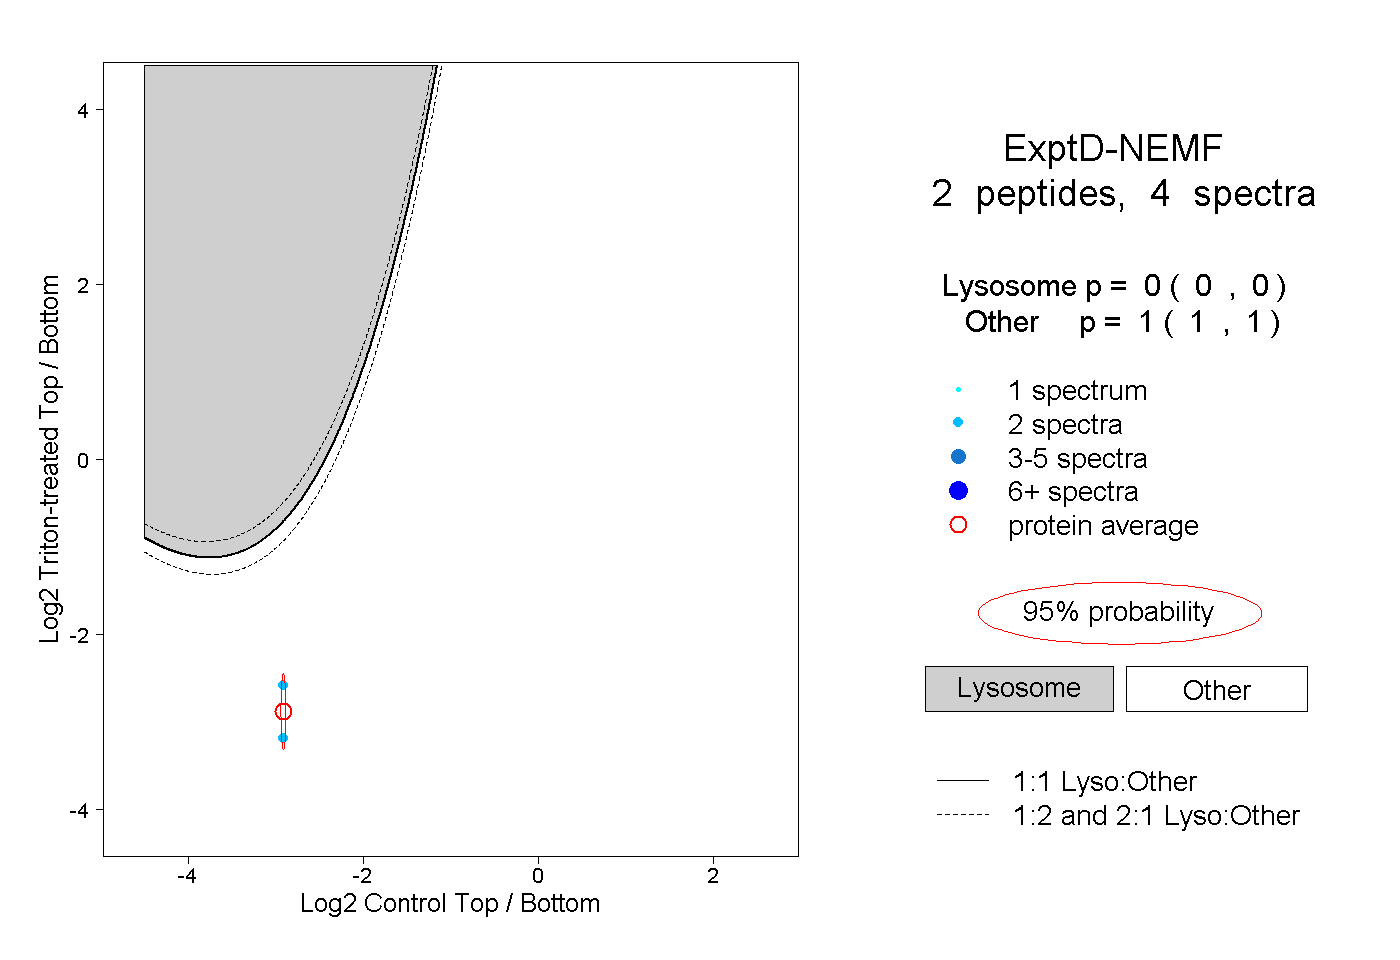 |
0.000 0.000 | 0.000 |
1.000 1.000 | 1.000 |