NEMF
[ENSRNOP00000030552]
Main page
| | | Plot |
Mito |
Lyso |
|
Perox |
ER |
Golgi |
PM |
Cytosol |
Nucleus |
|
| Expt A |
 15
15
peptides |
33
spectra |
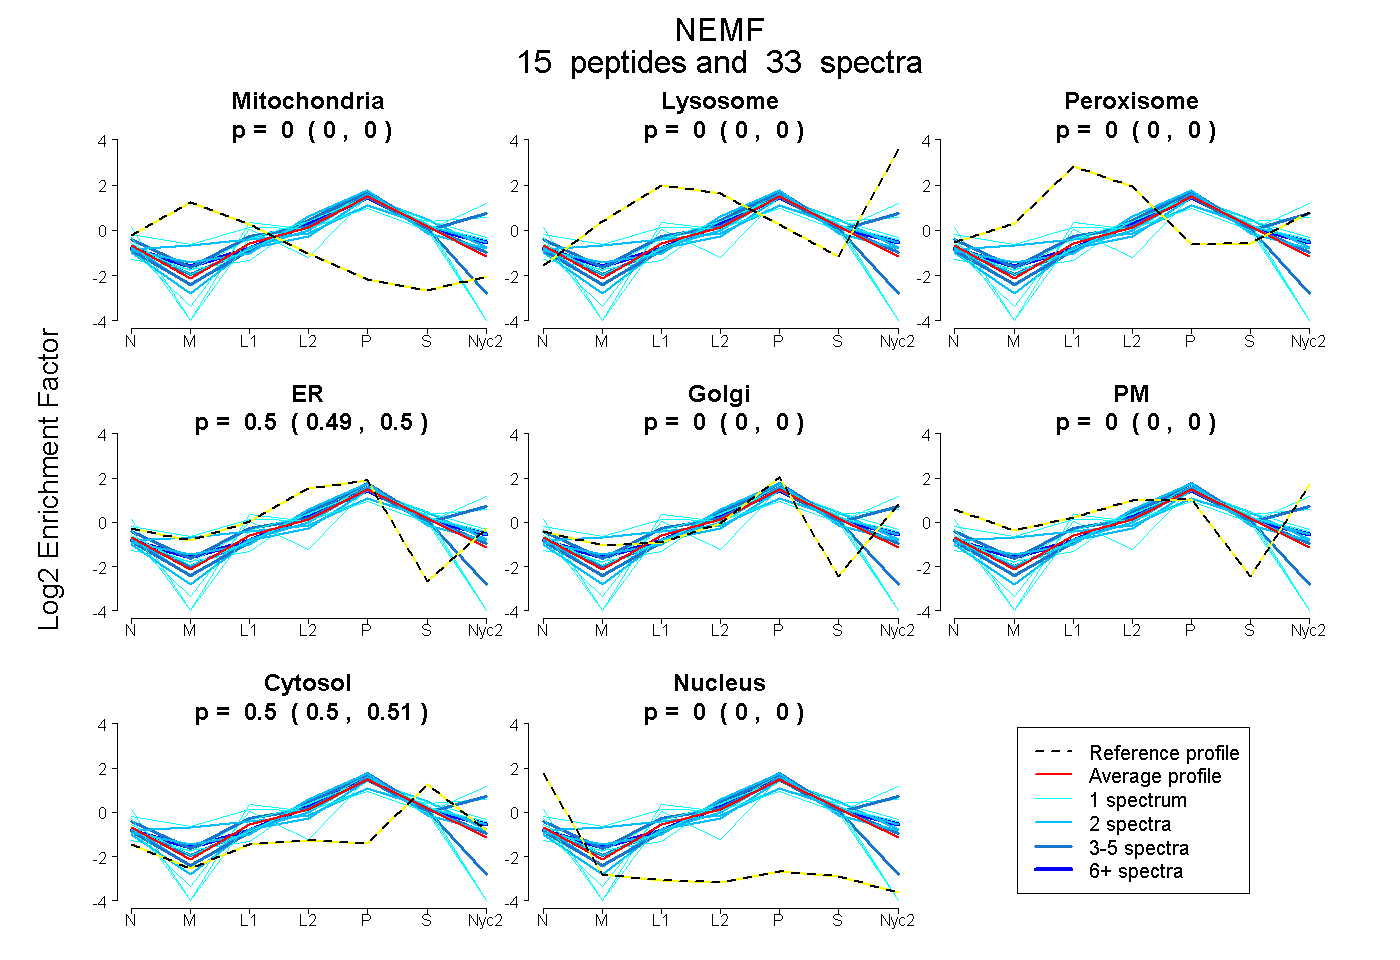 |
0.000
0.000 | 0.000 |
0.000
0.000 | 0.000 |
|
0.000
0.000 | 0.000 |
0.499
0.494 | 0.503 |
0.000
0.000 | 0.000 |
0.000
0.000 | 0.000 |
0.501
0.496 | 0.506 |
0.000
0.000 | 0.000 |
|
| | | Plot |
Mito |
|
Lyso or Perox |
|
ER |
Golgi |
PM |
Cytosol |
Nucleus |
|
| Expt B |
6
peptides |
10
spectra |
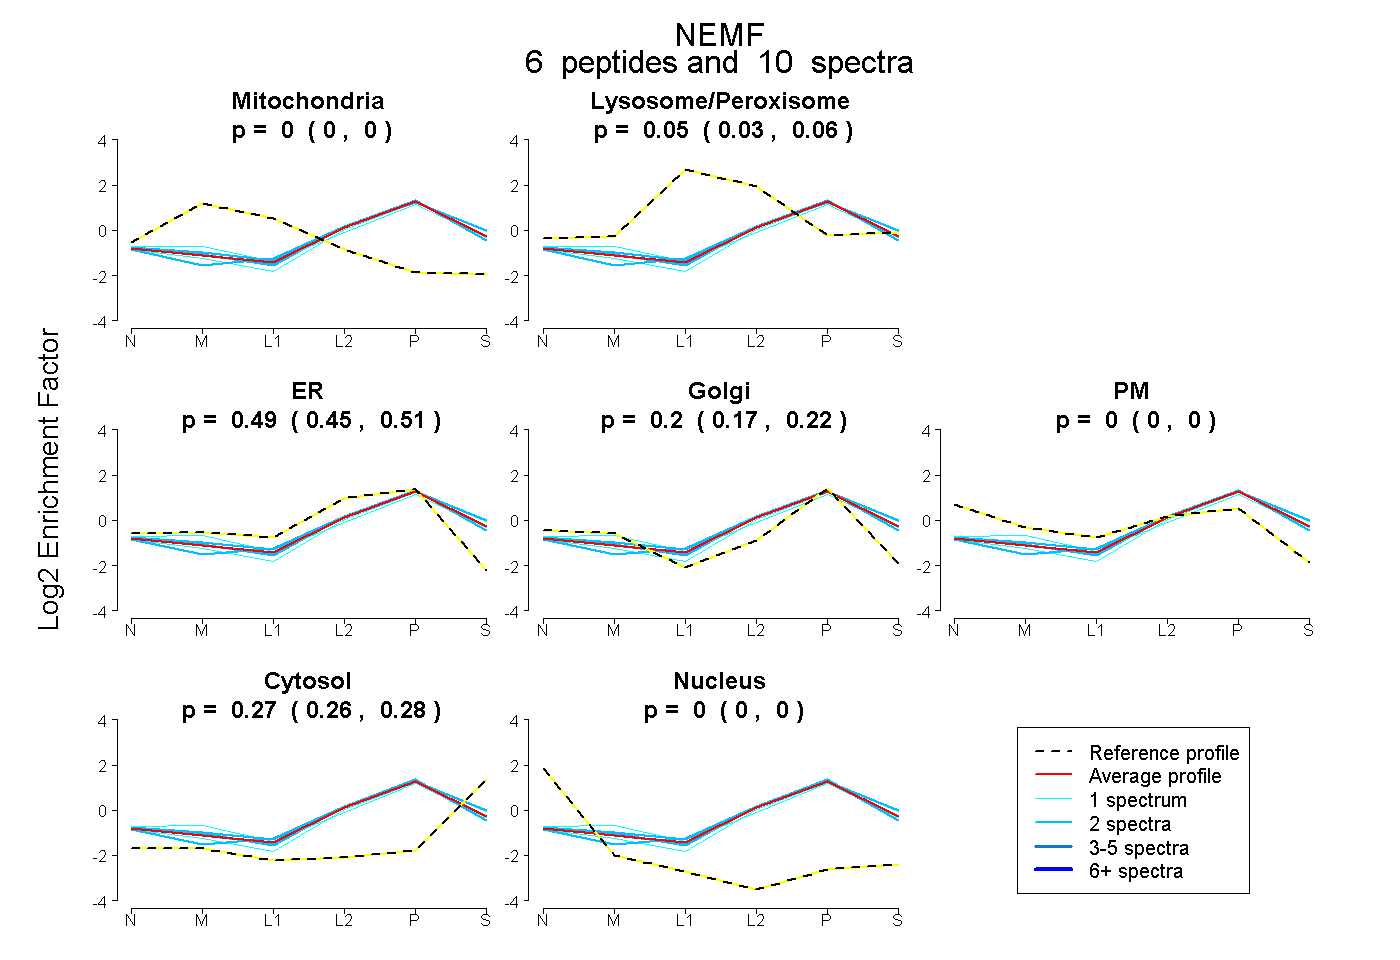 |
0.000
0.000 | 0.000 |
|
0.048
0.032 | 0.062 |
|
0.486
0.450 | 0.514 |
0.198
0.171 | 0.224 |
0.000
0.000 | 0.000 |
0.269
0.257 | 0.278 |
0.000
0.000 | 0.000 |
|
| 2 spectra, AEDYLEK |
0.000 |
|
0.033 |
|
0.530 |
0.160 |
0.000 |
0.277 |
0.000 |
|
| 2 spectra, LTEVIAR |
0.000 |
|
0.047 |
|
0.572 |
0.047 |
0.000 |
0.333 |
0.000 |
|
| 2 spectra, ILVCVQR |
0.000 |
|
0.092 |
|
0.398 |
0.302 |
0.000 |
0.209 |
0.000 |
|
| 2 spectra, AAEPLLTLER |
0.000 |
|
0.003 |
|
0.576 |
0.165 |
0.000 |
0.256 |
0.000 |
|
| 1 spectrum, GTTEEVELR |
0.000 |
|
0.152 |
|
0.174 |
0.477 |
0.000 |
0.196 |
0.000 |
|
| 1 spectrum, ATLLLESGIR |
0.000 |
|
0.000 |
|
0.494 |
0.177 |
0.000 |
0.329 |
0.000 |
|
| | | Plot |
|
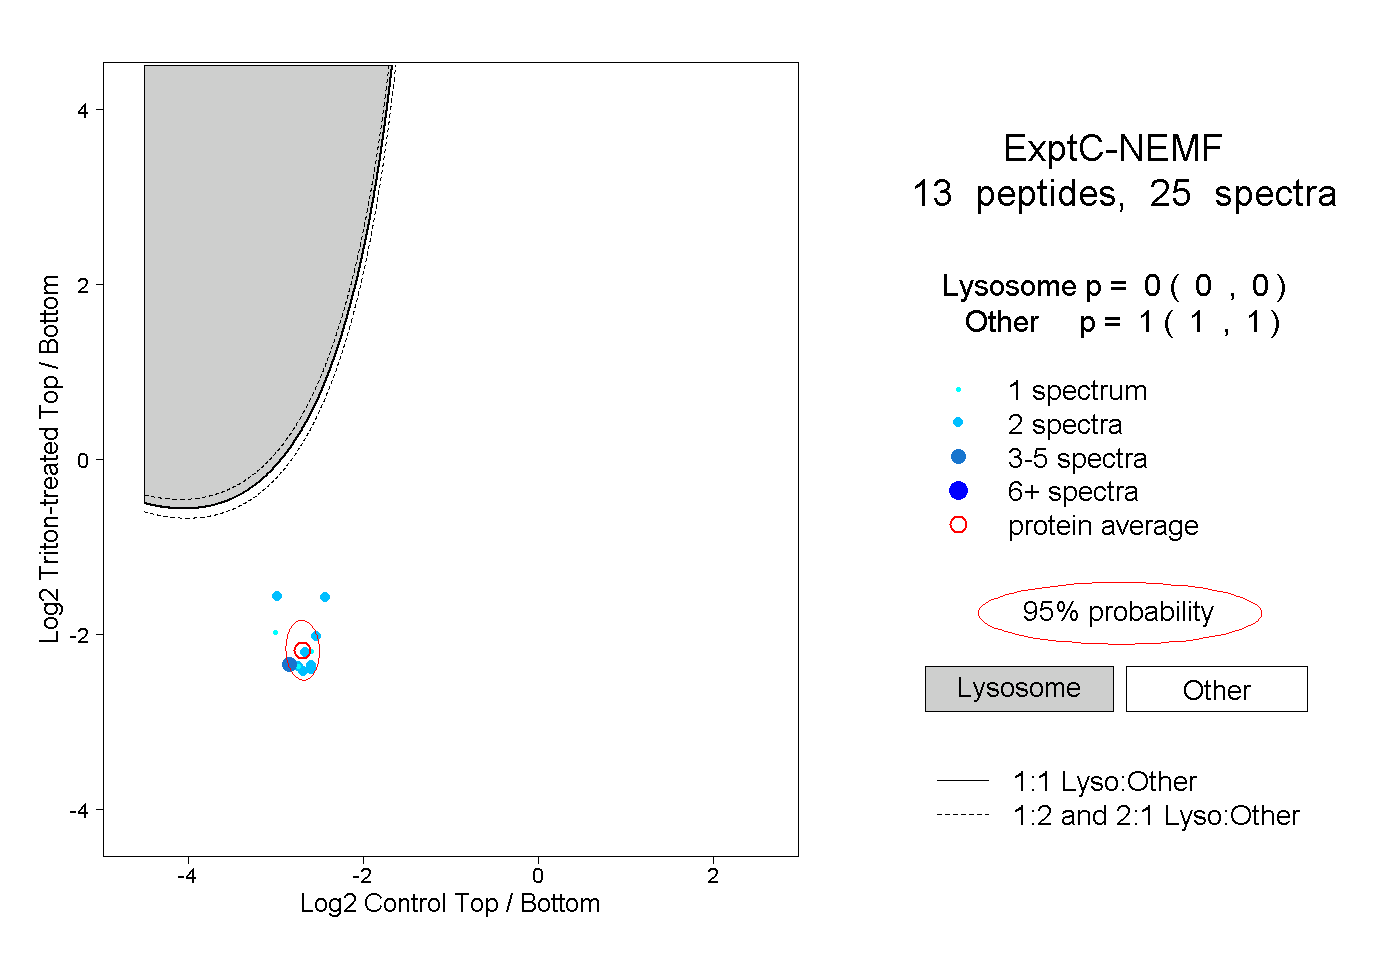
Lyso |
|
|
|
|
|
|
|
Other |
| Expt C |
13
peptides |
25
spectra |
 |
|
0.000
0.000 | 0.000 |
|
|
|
|
|
|
|
1.000
1.000 | 1.000 |
| | | Plot |
|
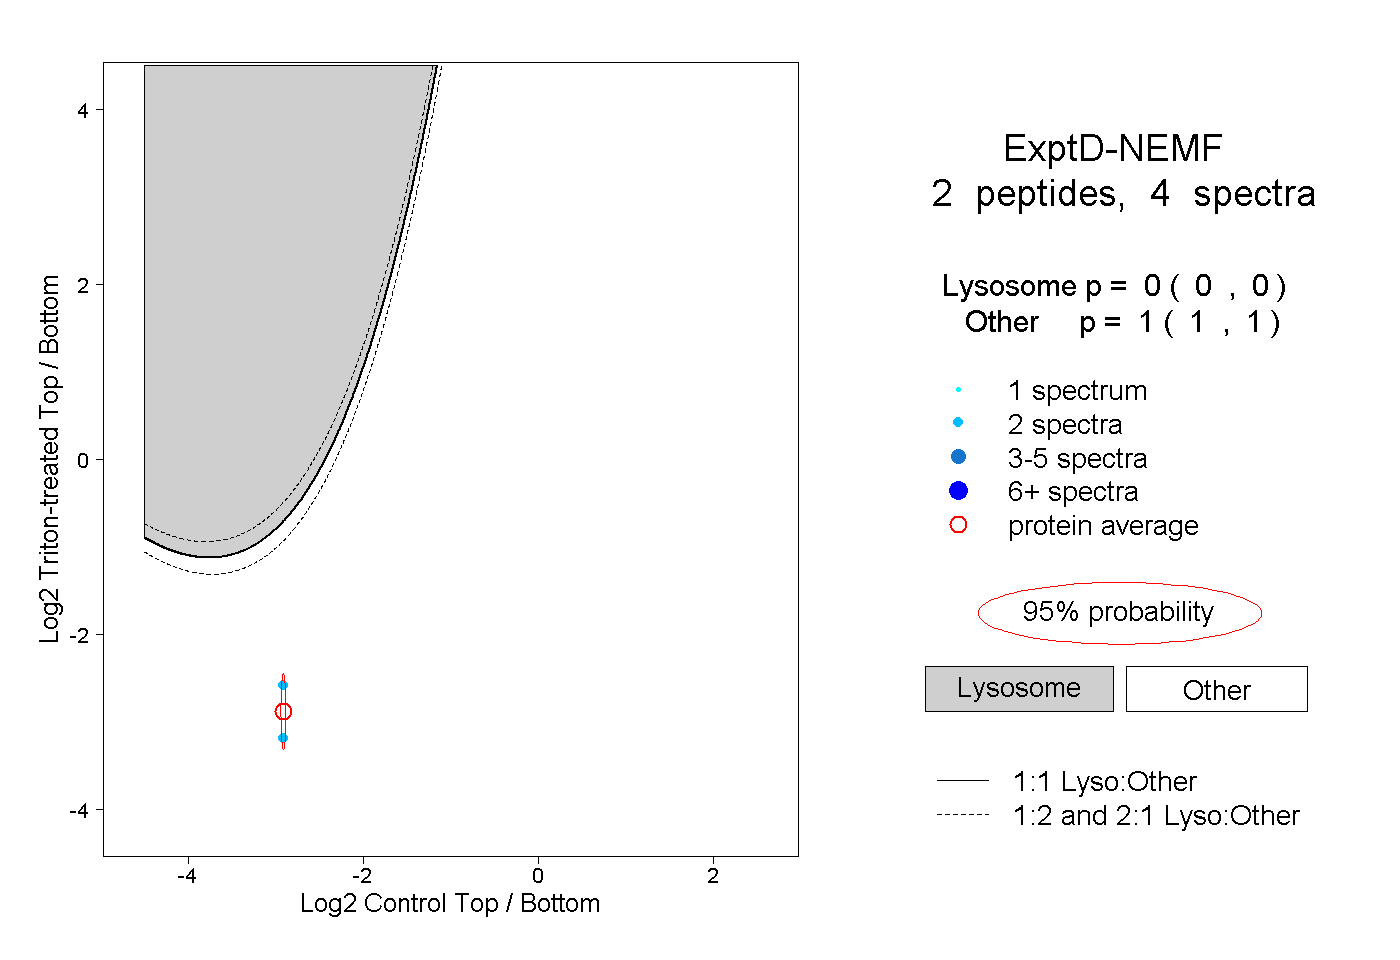
Lyso |
|
|
|
|
|
|
|
Other |
| Expt D |
2
peptides |
4
spectra |
 |
|
0.000
0.000 | 0.000 |
|
|
|
|
|
|
|
1.000
1.000 | 1.000 |