 33
33peptides
spectra
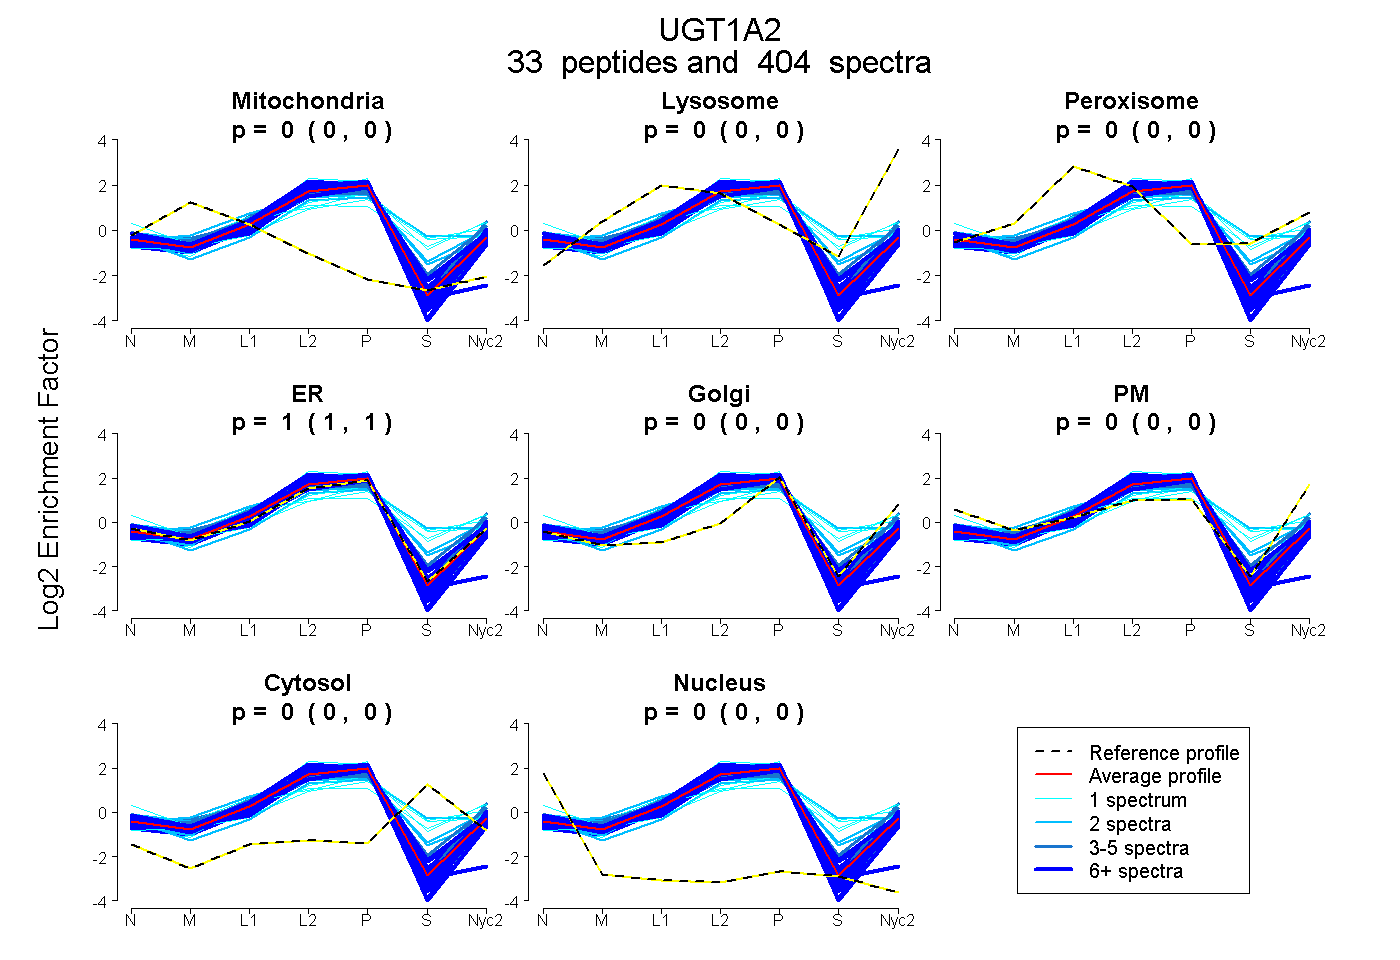
0.000 | 0.000
0.001 | 0.004
0.000 | 0.000
0.996 | 0.998
0.000 | 0.000
0.000 | 0.000
0.000 | 0.000
0.000 | 0.000
26peptides
spectra
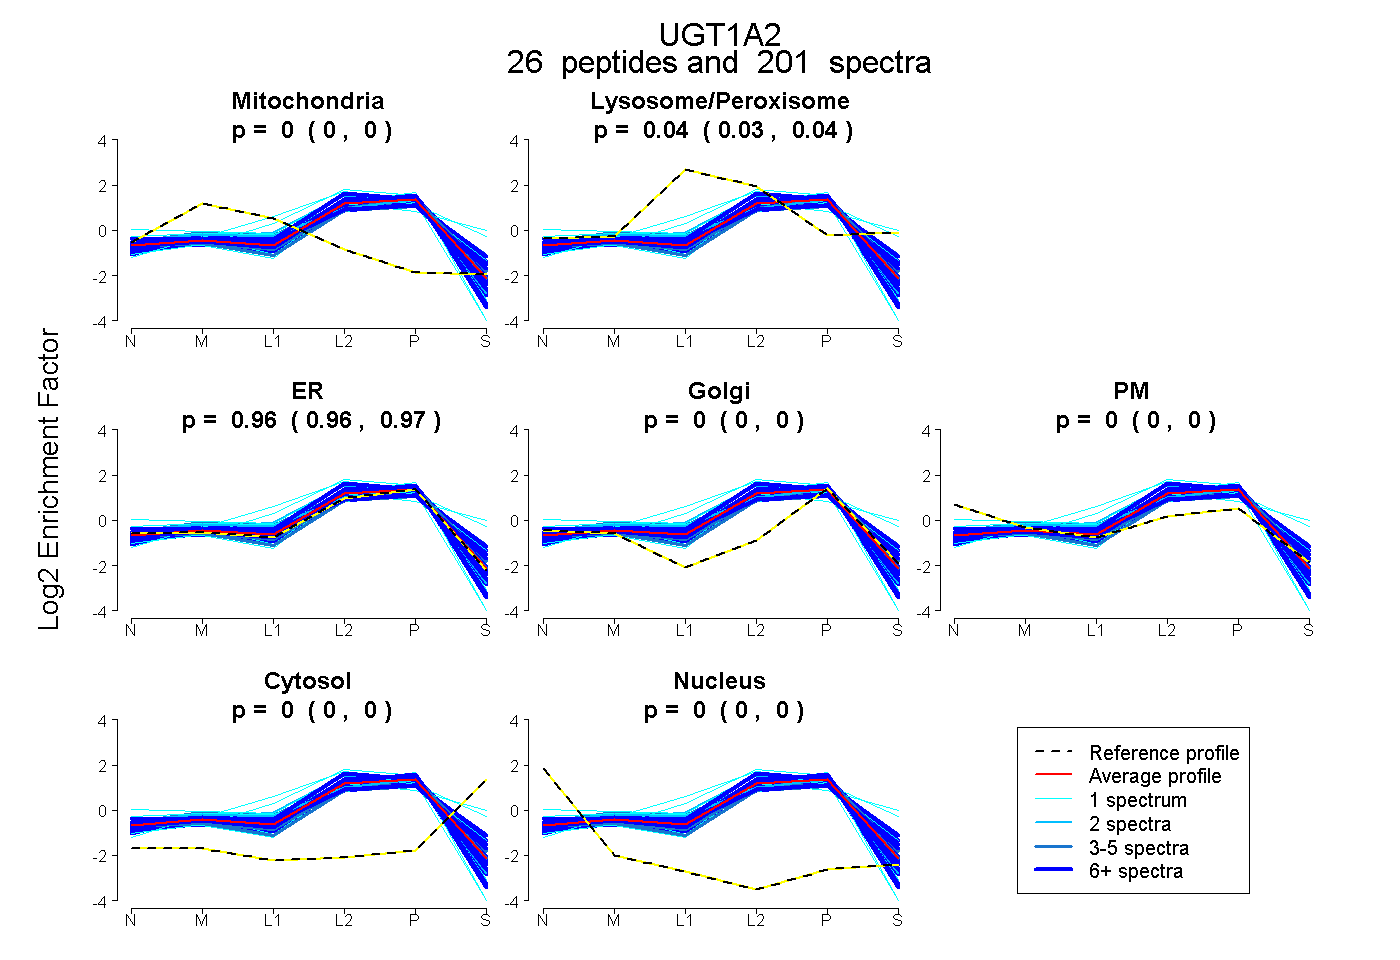
0.000 | 0.000
0.035 | 0.039
0.960 | 0.965
0.000 | 0.000
0.000 | 0.000
0.000 | 0.000
0.000 | 0.000
31peptides
spectra
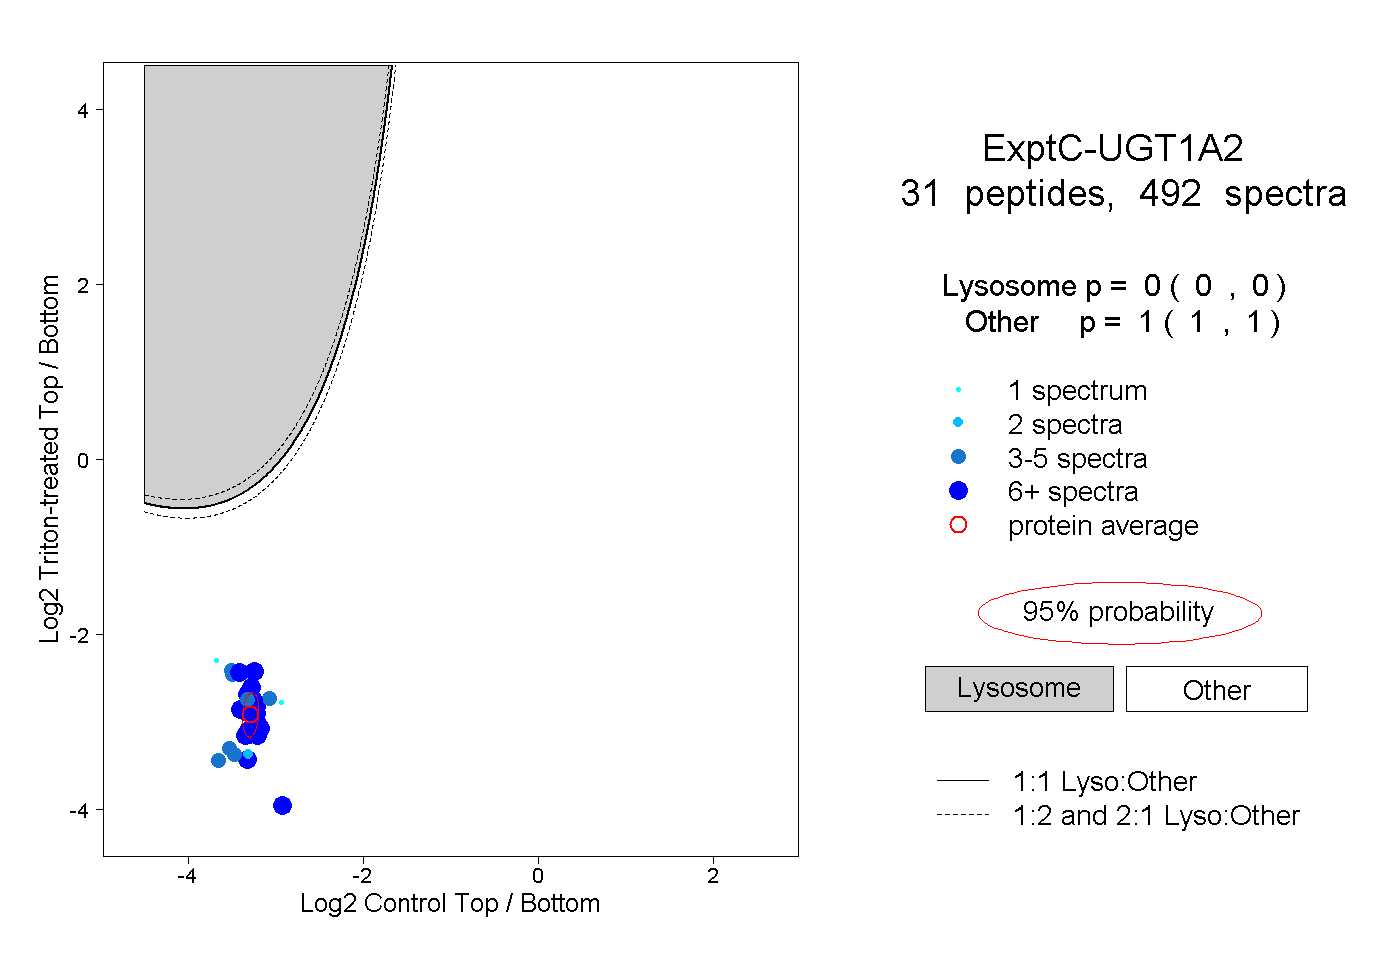
0.000 | 0.000
1.000 | 1.000
10peptides
spectra
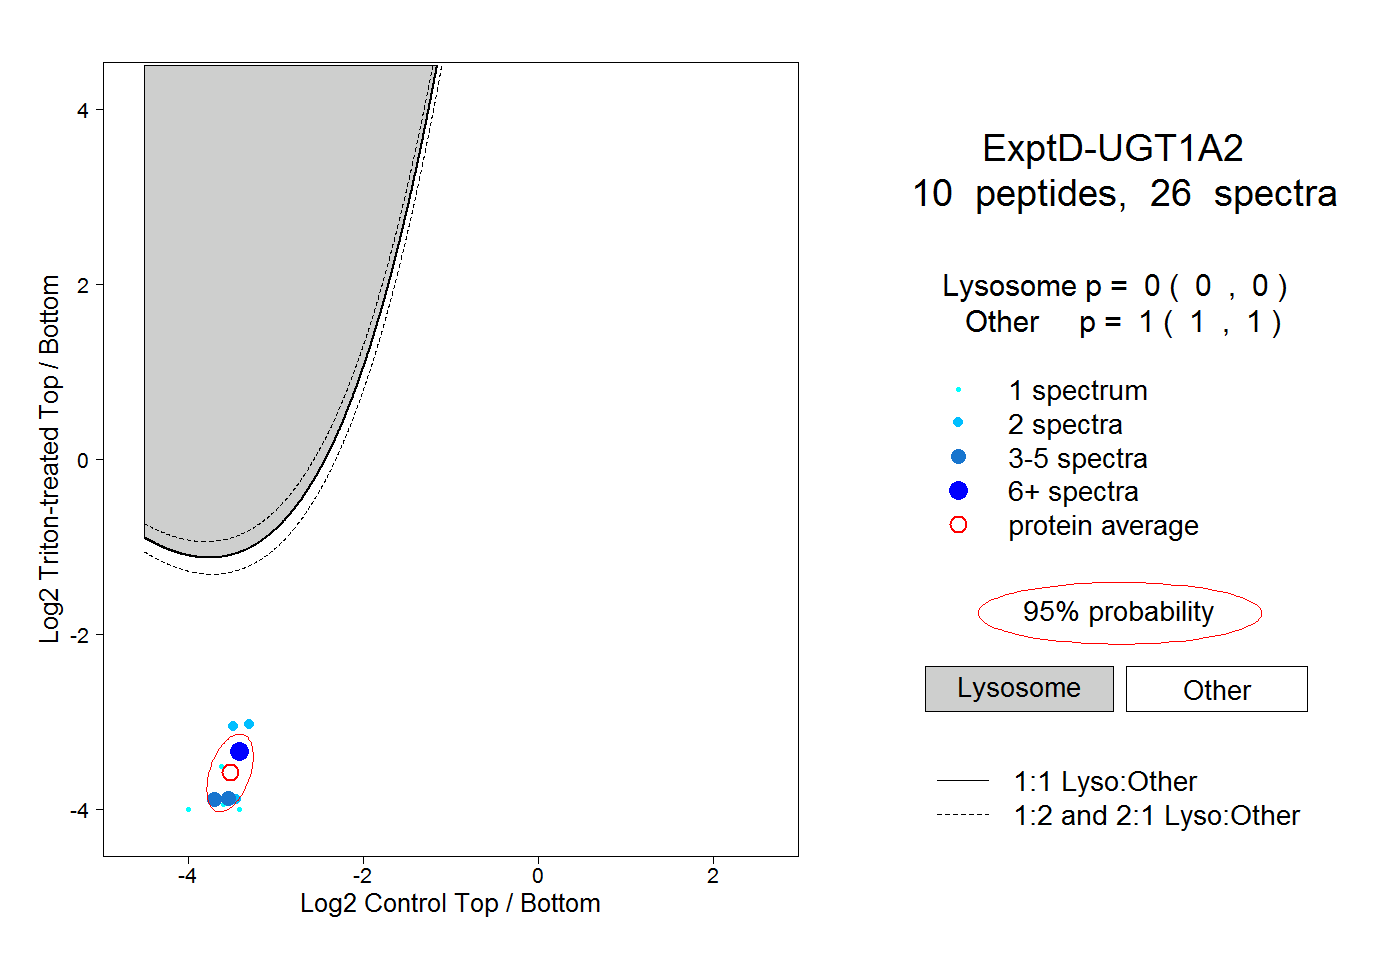
0.000 | 0.000
1.000 | 1.000