 33
33peptides
spectra
0.000 | 0.000
0.001 | 0.004
0.000 | 0.000
0.996 | 0.998
0.000 | 0.000
0.000 | 0.000
0.000 | 0.000
0.000 | 0.000
| Plot | Mito | Lyso | Perox | ER | Golgi | PM | Cytosol | Nucleus | |||||
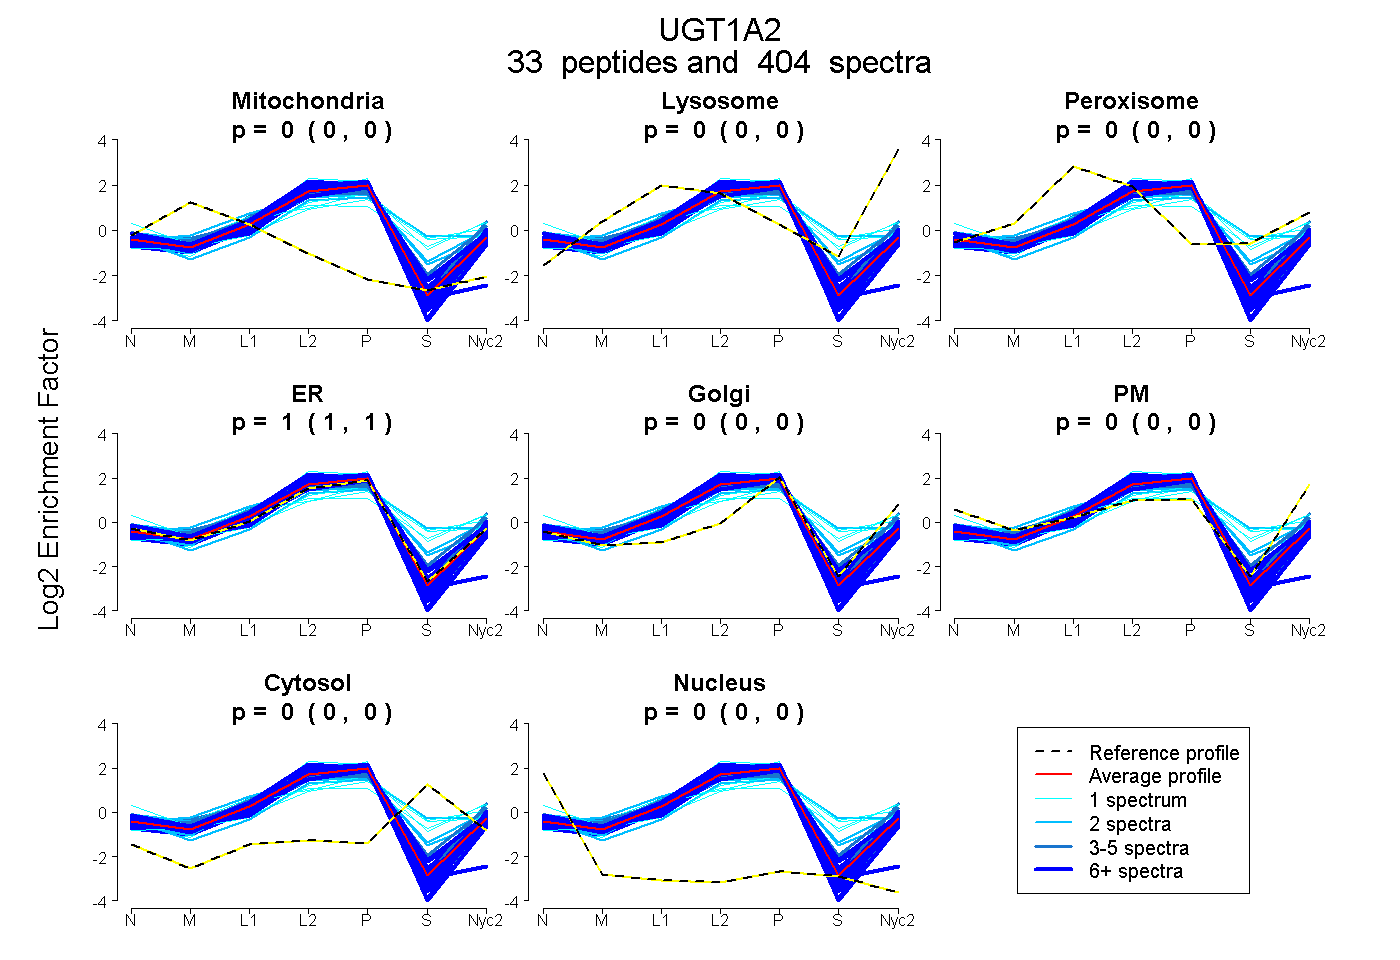
| Expt A |
33 peptides |
404 spectra |
|
0.000 0.000 | 0.000 |
0.003 0.001 | 0.004 |
0.000 0.000 | 0.000 |
0.997 0.996 | 0.998 |
0.000 0.000 | 0.000 |
0.000 0.000 | 0.000 |
0.000 0.000 | 0.000 |
0.000 0.000 | 0.000 |
| 2 spectra, EVSVVEILR | 0.000 | 0.000 | 0.000 | 1.000 | 0.000 | 0.000 | 0.000 | 0.000 | ||
| 1 spectrum, FSDHMTFPQR | 0.000 | 0.050 | 0.282 | 0.288 | 0.298 | 0.000 | 0.082 | 0.000 | ||
| 24 spectra, SLSSNTDR | 0.000 | 0.000 | 0.000 | 1.000 | 0.000 | 0.000 | 0.000 | 0.000 | ||
| 29 spectra, IPQTVLWR | 0.000 | 0.000 | 0.025 | 0.975 | 0.000 | 0.000 | 0.000 | 0.000 | ||
| 1 spectrum, DYPRPIMPNMVFIGGINCLQK | 0.000 | 0.000 | 0.000 | 1.000 | 0.000 | 0.000 | 0.000 | 0.000 | ||
| 6 spectra, YEILASDLLK | 0.000 | 0.000 | 0.002 | 0.998 | 0.000 | 0.000 | 0.000 | 0.000 | ||
| 26 spectra, TVINNK | 0.000 | 0.000 | 0.000 | 1.000 | 0.000 | 0.000 | 0.000 | 0.000 | ||
| 17 spectra, VLVFPMEGSHWLSMR | 0.000 | 0.052 | 0.052 | 0.872 | 0.000 | 0.000 | 0.023 | 0.000 | ||
| 3 spectra, LTDTMTFK | 0.000 | 0.000 | 0.093 | 0.880 | 0.000 | 0.000 | 0.027 | 0.000 | ||
| 12 spectra, NTILVK | 0.000 | 0.000 | 0.000 | 0.998 | 0.000 | 0.002 | 0.000 | 0.000 | ||
| 6 spectra, SCAYGCR | 0.050 | 0.000 | 0.000 | 0.894 | 0.000 | 0.000 | 0.000 | 0.055 | ||
| 6 spectra, YFSLPSVVFSR | 0.000 | 0.000 | 0.000 | 0.973 | 0.000 | 0.027 | 0.000 | 0.000 | ||
| 8 spectra, SFPVPYNLEELR | 0.000 | 0.000 | 0.000 | 1.000 | 0.000 | 0.000 | 0.000 | 0.000 | ||
| 51 spectra, AMEIAEALGR | 0.000 | 0.007 | 0.000 | 0.993 | 0.000 | 0.000 | 0.000 | 0.000 | ||
| 1 spectrum, TYSVSHTQEDLNR | 0.000 | 0.000 | 0.207 | 0.305 | 0.000 | 0.308 | 0.180 | 0.000 | ||
| 4 spectra, LSSLHK | 0.000 | 0.131 | 0.000 | 0.869 | 0.000 | 0.000 | 0.000 | 0.000 | ||
| 4 spectra, SFGNNHFAASSPLMAPLR | 0.000 | 0.068 | 0.142 | 0.754 | 0.027 | 0.000 | 0.008 | 0.000 | ||
| 2 spectra, LLVVPQDGSHWLSMK | 0.000 | 0.001 | 0.000 | 0.999 | 0.000 | 0.000 | 0.000 | 0.000 | ||
| 1 spectrum, QSSFDAVFLDPFDVCGLTVAK | 0.000 | 0.154 | 0.000 | 0.584 | 0.000 | 0.000 | 0.261 | 0.000 | ||
| 1 spectrum, GHQAVVLAPEVTVHIK | 0.000 | 0.000 | 0.160 | 0.524 | 0.065 | 0.000 | 0.252 | 0.000 | ||
| 1 spectrum, NMIIALTENFLCR | 0.000 | 0.030 | 0.000 | 0.970 | 0.000 | 0.000 | 0.000 | 0.000 | ||
| 2 spectra, GIFCHYLEEGSQCPSPPSYVPR | 0.000 | 0.000 | 0.242 | 0.718 | 0.000 | 0.000 | 0.040 | 0.000 | ||
| 19 spectra, LPSVYLFR | 0.000 | 0.000 | 0.000 | 1.000 | 0.000 | 0.000 | 0.000 | 0.000 | ||
| 3 spectra, DSATLSFLR | 0.035 | 0.000 | 0.000 | 0.965 | 0.000 | 0.000 | 0.000 | 0.000 | ||
| 3 spectra, DVSLPALHQNSLWLLR | 0.000 | 0.000 | 0.034 | 0.966 | 0.000 | 0.000 | 0.000 | 0.000 | ||
| 13 spectra, EGSFYTMR | 0.000 | 0.000 | 0.000 | 0.938 | 0.000 | 0.000 | 0.062 | 0.000 | ||
| 17 spectra, SVFDQDPFLLR | 0.000 | 0.000 | 0.000 | 1.000 | 0.000 | 0.000 | 0.000 | 0.000 | ||
| 2 spectra, FFIDSQWK | 0.000 | 0.000 | 0.157 | 0.649 | 0.038 | 0.071 | 0.084 | 0.000 | ||
| 32 spectra, DLLSPASIWLMR | 0.000 | 0.000 | 0.000 | 1.000 | 0.000 | 0.000 | 0.000 | 0.000 | ||
| 2 spectra, LVEYLK | 0.000 | 0.000 | 0.088 | 0.619 | 0.000 | 0.000 | 0.294 | 0.000 | ||
| 4 spectra, EIVEHLSER | 0.000 | 0.000 | 0.030 | 0.970 | 0.000 | 0.000 | 0.000 | 0.000 | ||
| 26 spectra, YTGTRPSNLAK | 0.000 | 0.000 | 0.000 | 1.000 | 0.000 | 0.000 | 0.000 | 0.000 | ||
| 75 spectra, MNFLQR | 0.000 | 0.041 | 0.000 | 0.959 | 0.000 | 0.000 | 0.000 | 0.000 |
| Plot | Mito | Lyso or Perox | ER | Golgi | PM | Cytosol | Nucleus | ||||||
| Expt B |
26 peptides |
201 spectra |
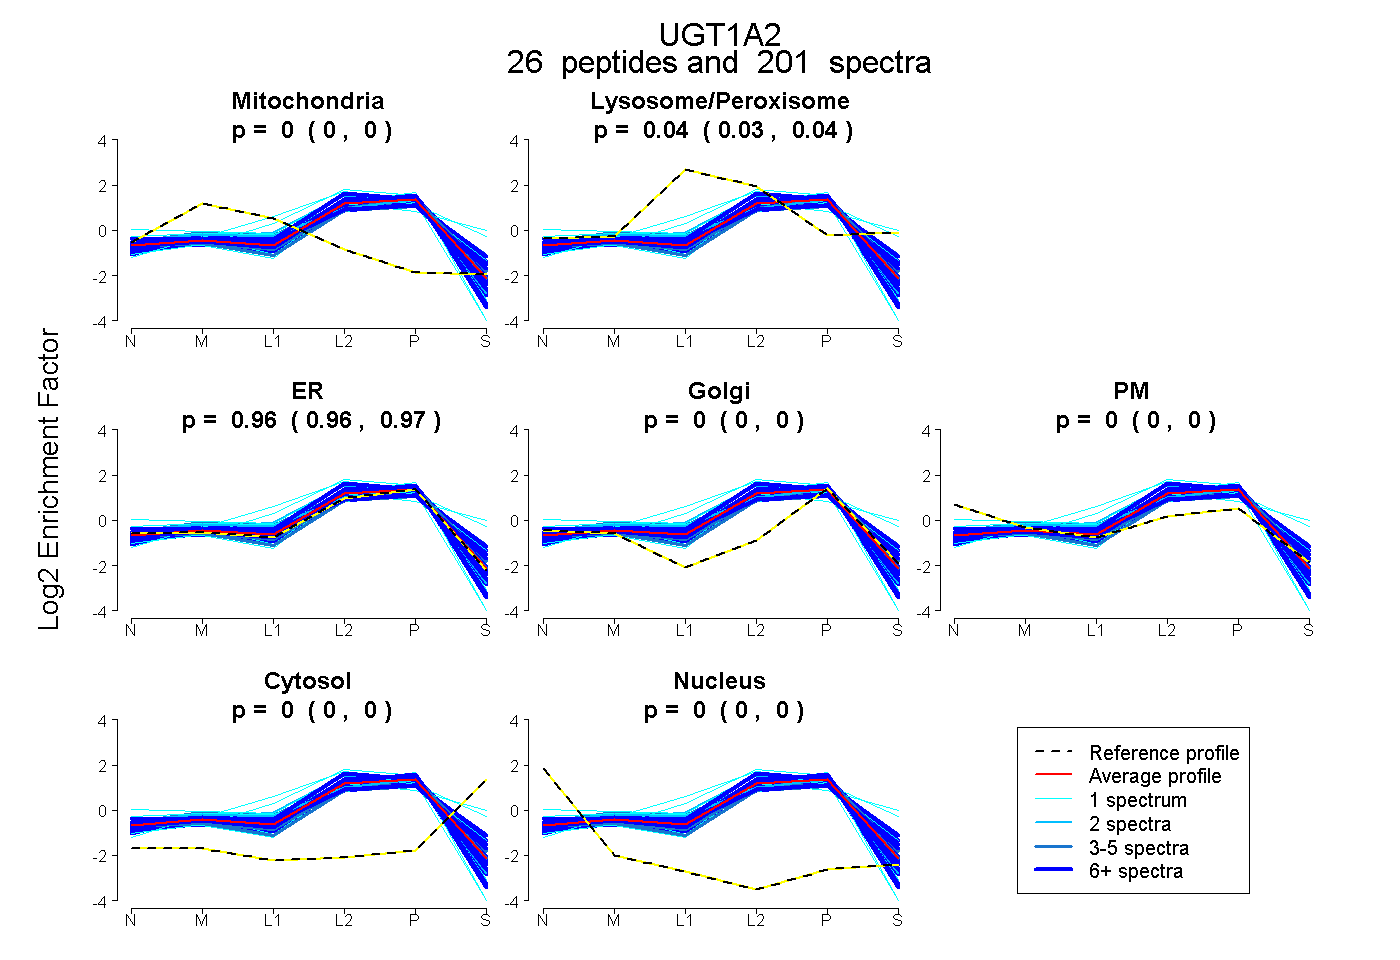 |
0.000 0.000 | 0.000 |
0.037 0.035 | 0.039 |
0.963 0.960 | 0.965 |
0.000 0.000 | 0.000 |
0.000 0.000 | 0.000 |
0.000 0.000 | 0.000 |
0.000 0.000 | 0.000 |
|||
| Plot | Lyso | Other | |||||||||||
| Expt C |
31 peptides |
492 spectra |
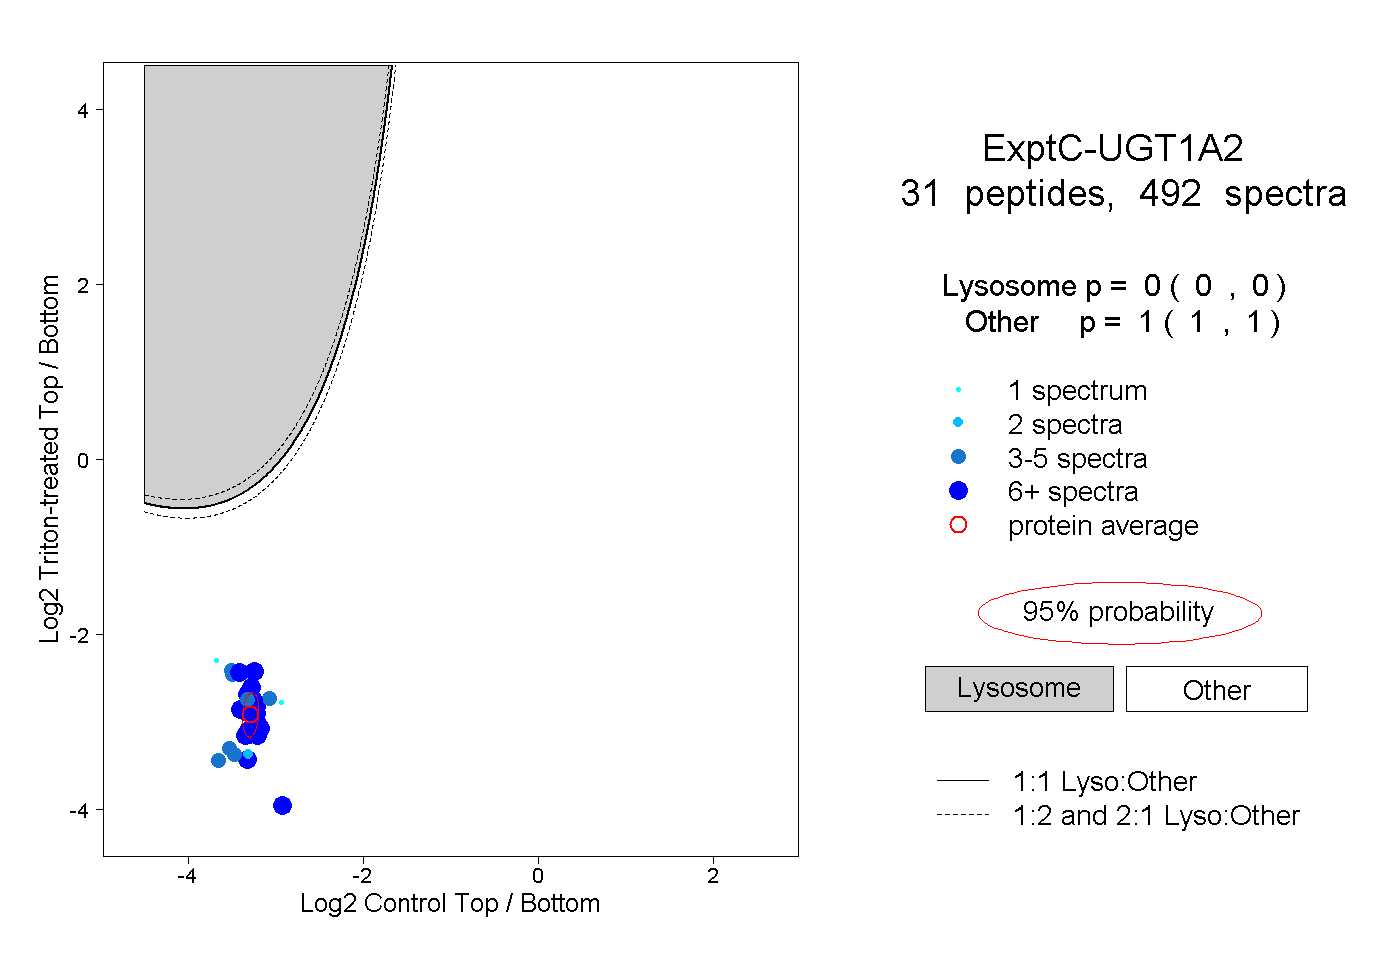 |
0.000 0.000 | 0.000 |
1.000 1.000 | 1.000 |
||||||||
| Plot | Lyso | Other | |||||||||||
| Expt D |
10 peptides |
26 spectra |
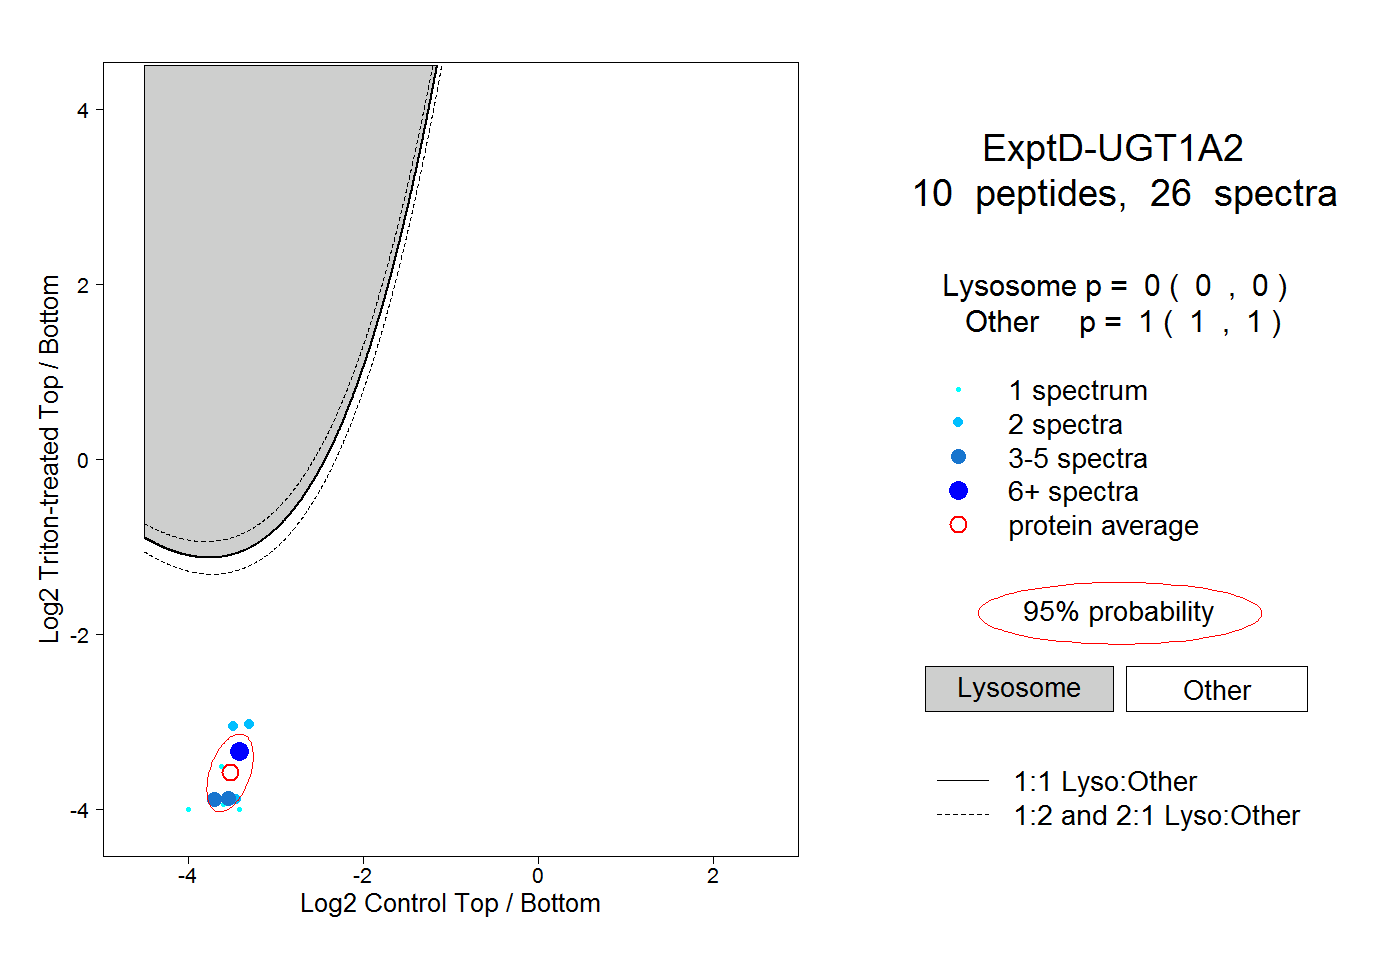 |
0.000 0.000 | 0.000 |
1.000 1.000 | 1.000 |