 21
21peptides
spectra
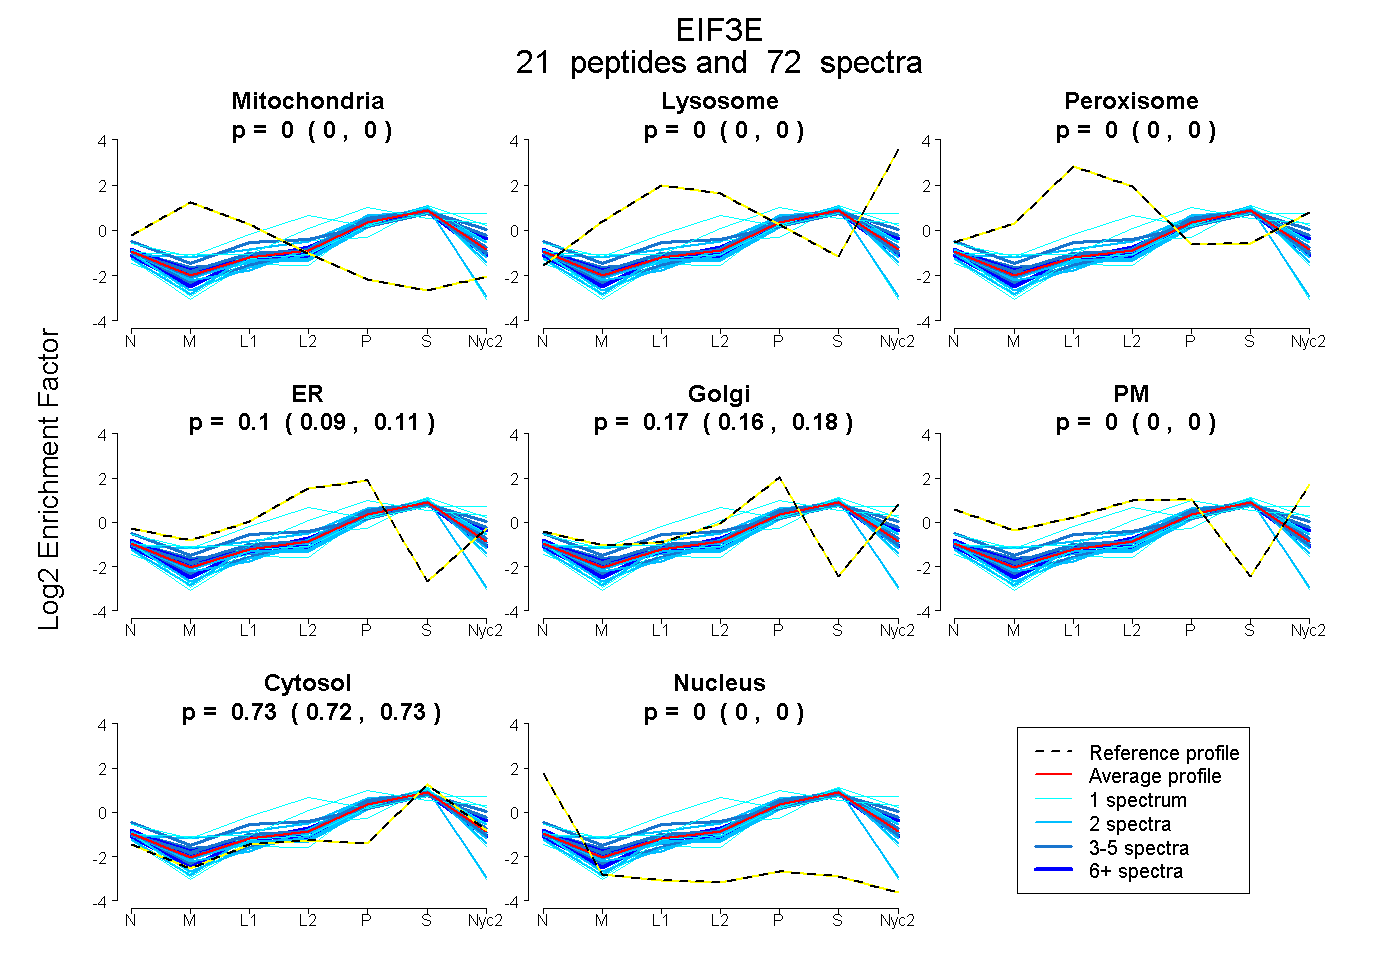
0.000 | 0.000
0.000 | 0.000
0.000 | 0.000
0.093 | 0.113
0.156 | 0.180
0.000 | 0.000
0.723 | 0.729
0.000 | 0.000
11peptides
spectra
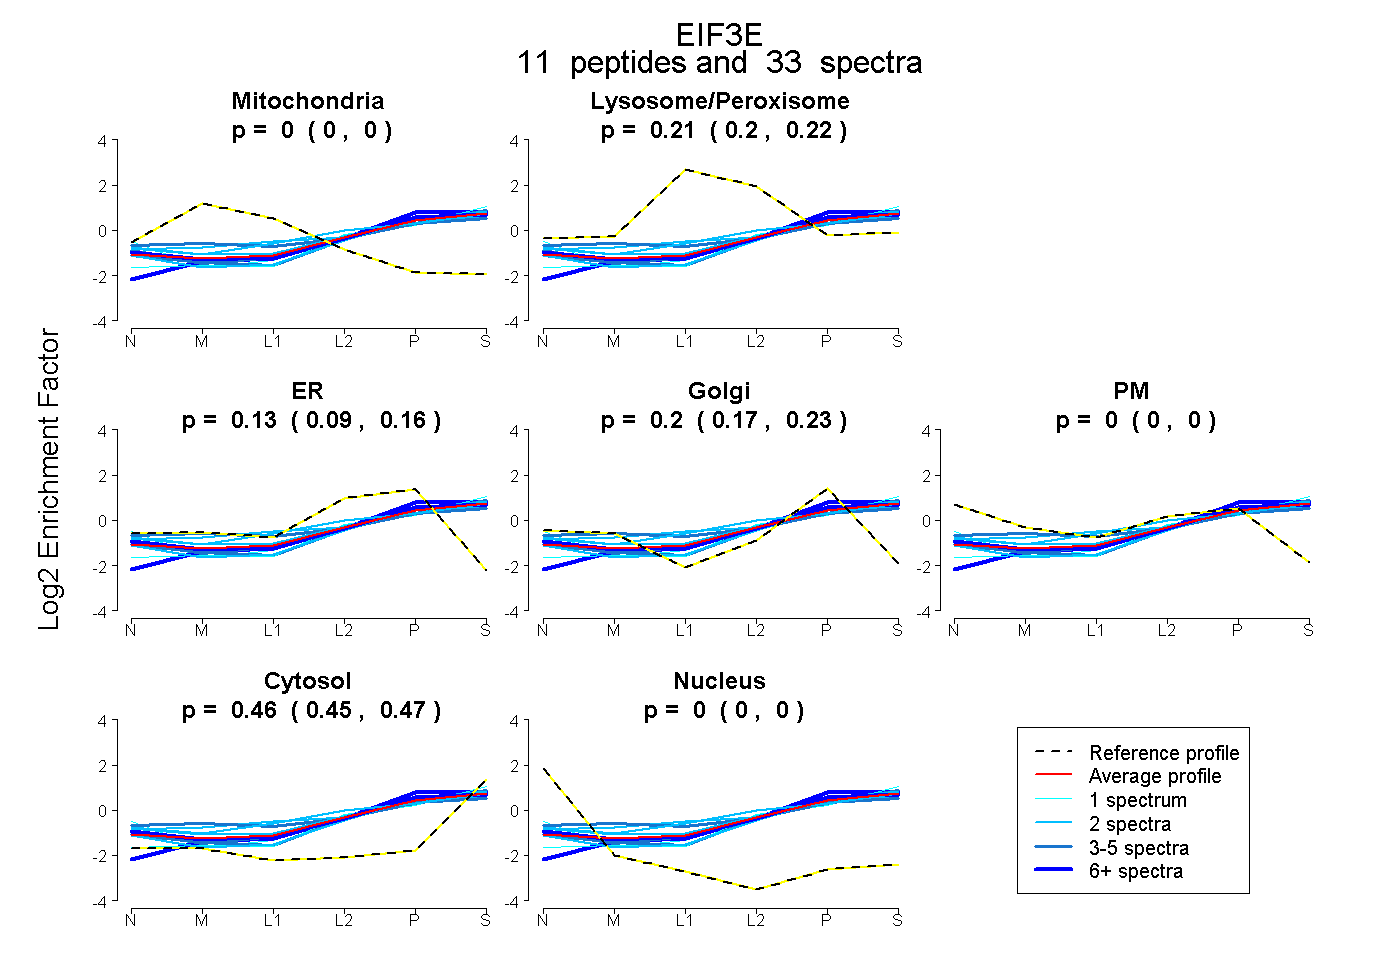
0.000 | 0.000
0.198 | 0.224
0.094 | 0.155
0.175 | 0.230
0.000 | 0.000
0.445 | 0.466
0.000 | 0.000
15peptides
spectra
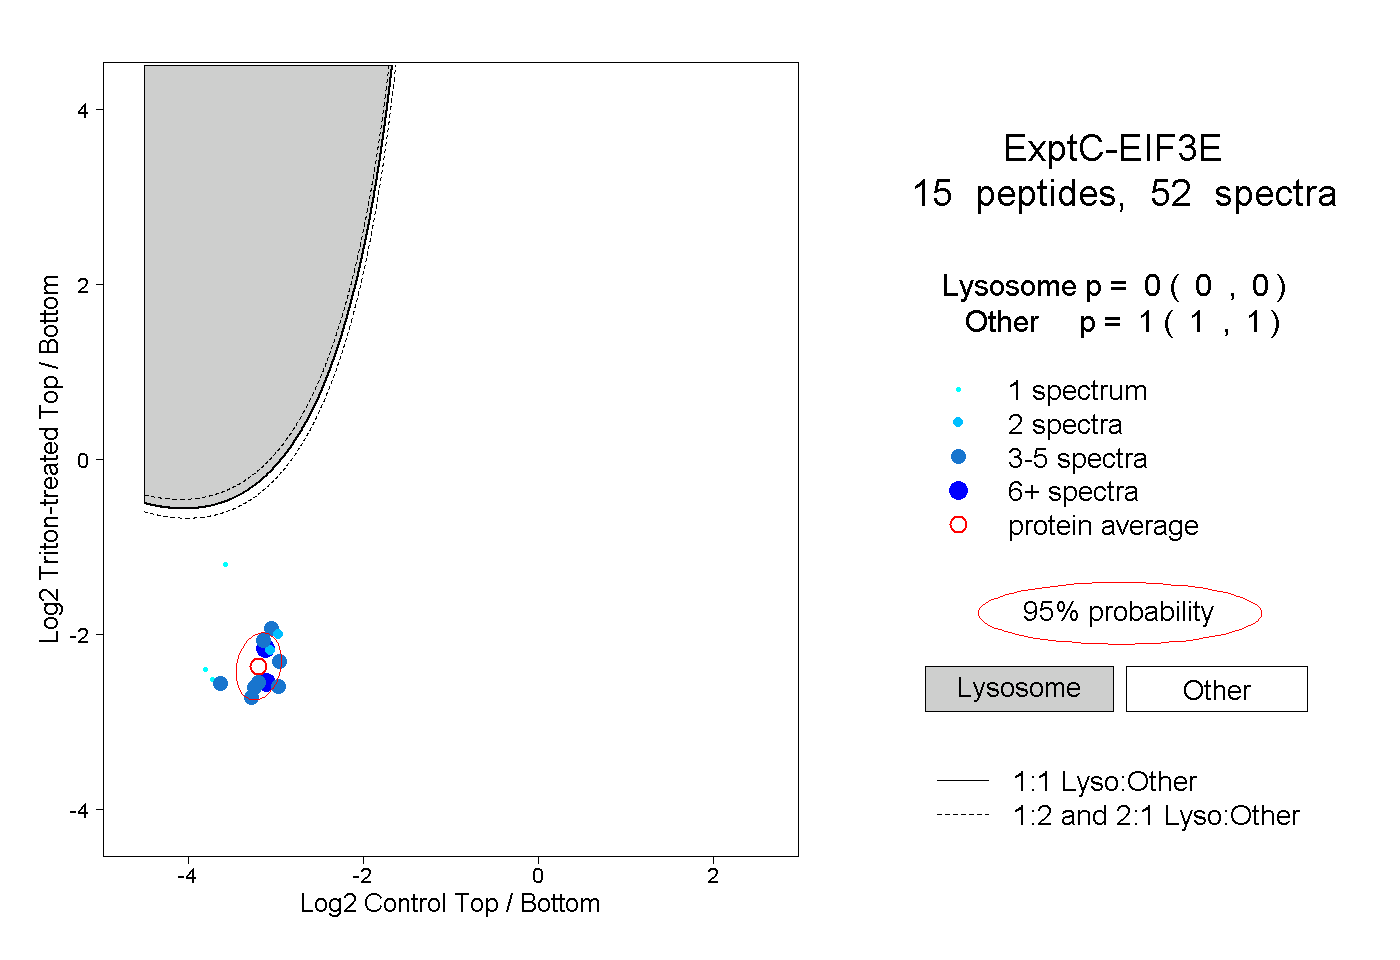
0.000 | 0.000
1.000 | 1.000
4peptides
spectra
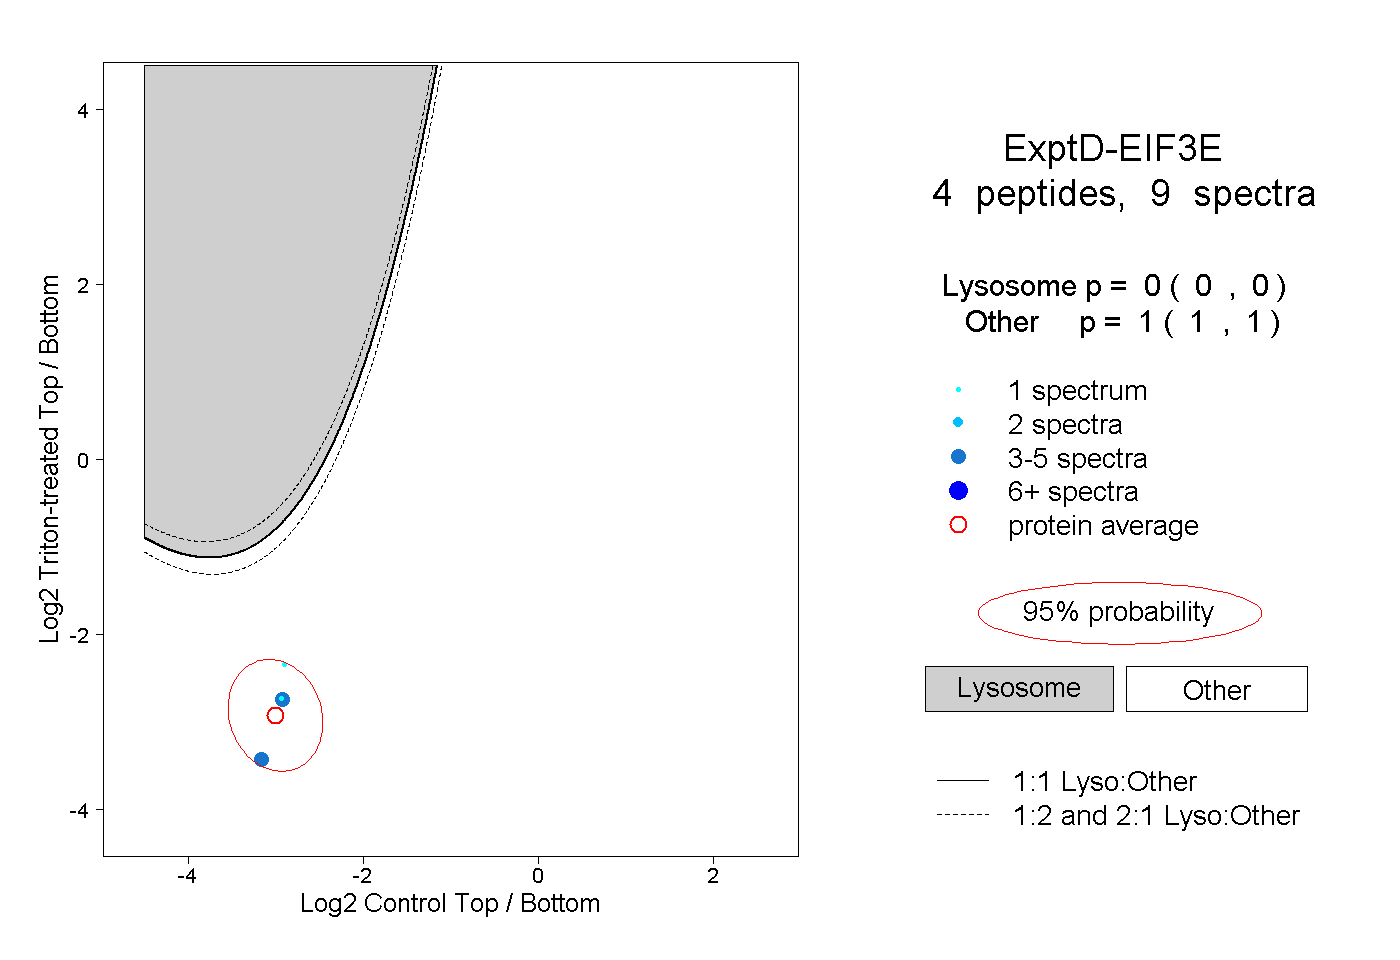
0.000 | 0.000
1.000 | 1.000