EIF3E
[ENSRNOP00000029790]
Main page
| | | Plot |
Mito |
Lyso |
|
Perox |
ER |
Golgi |
PM |
Cytosol |
Nucleus |
|
| Expt A |
 21
21
peptides |
72
spectra |
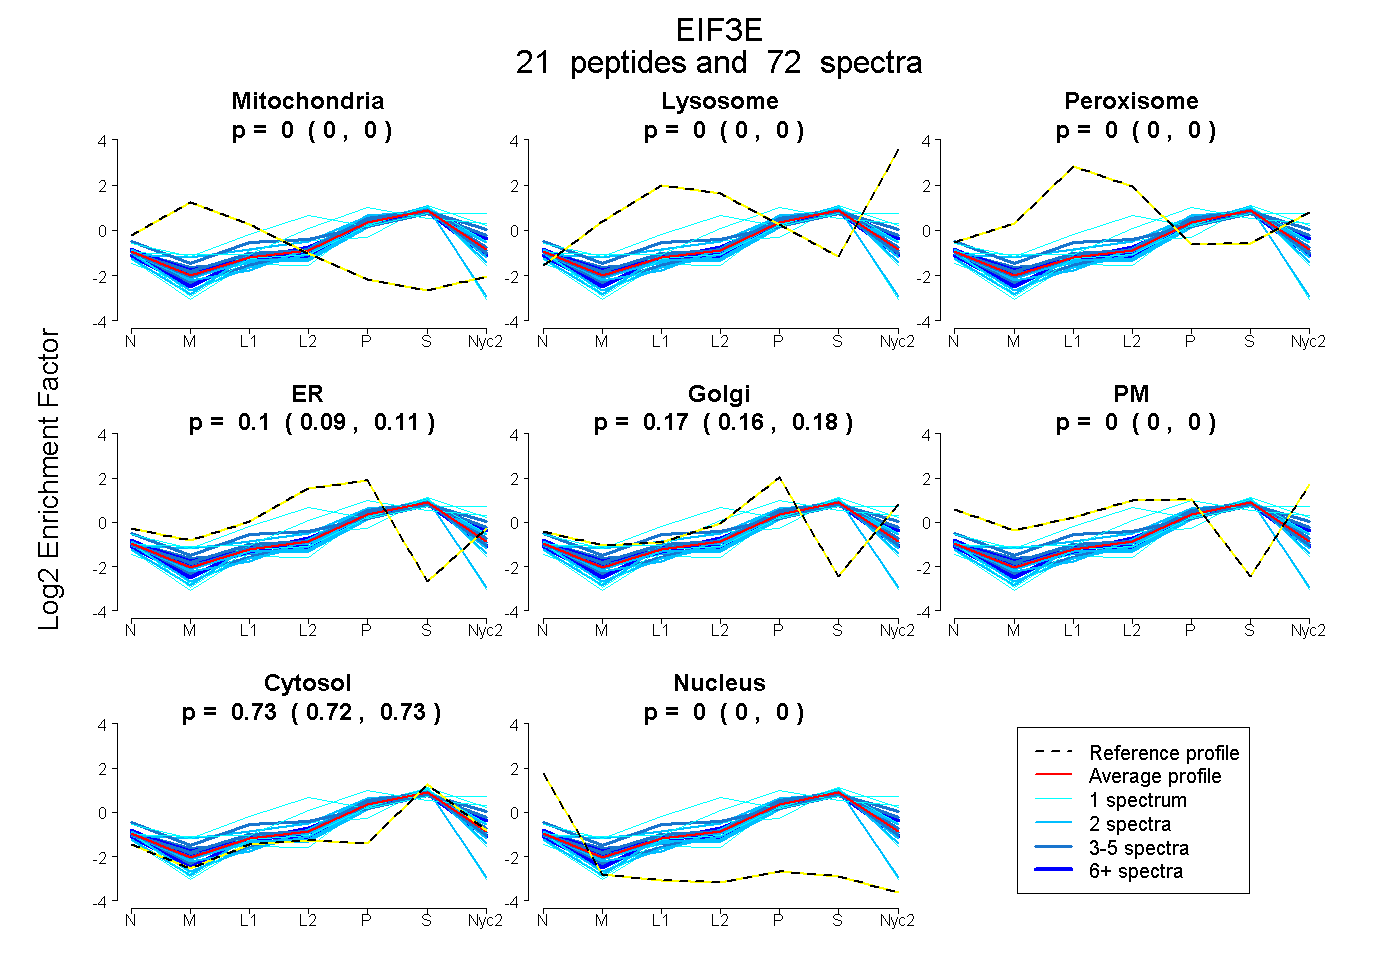 |
0.000
0.000 | 0.000 |
0.000
0.000 | 0.000 |
|
0.000
0.000 | 0.000 |
0.104
0.093 | 0.113 |
0.169
0.156 | 0.180 |
0.000
0.000 | 0.000 |
0.726
0.723 | 0.729 |
0.000
0.000 | 0.000 |
|
| | | Plot |
Mito |
|
Lyso or Perox |
|
ER |
Golgi |
PM |
Cytosol |
Nucleus |
|
| Expt B |
11
peptides |
33
spectra |
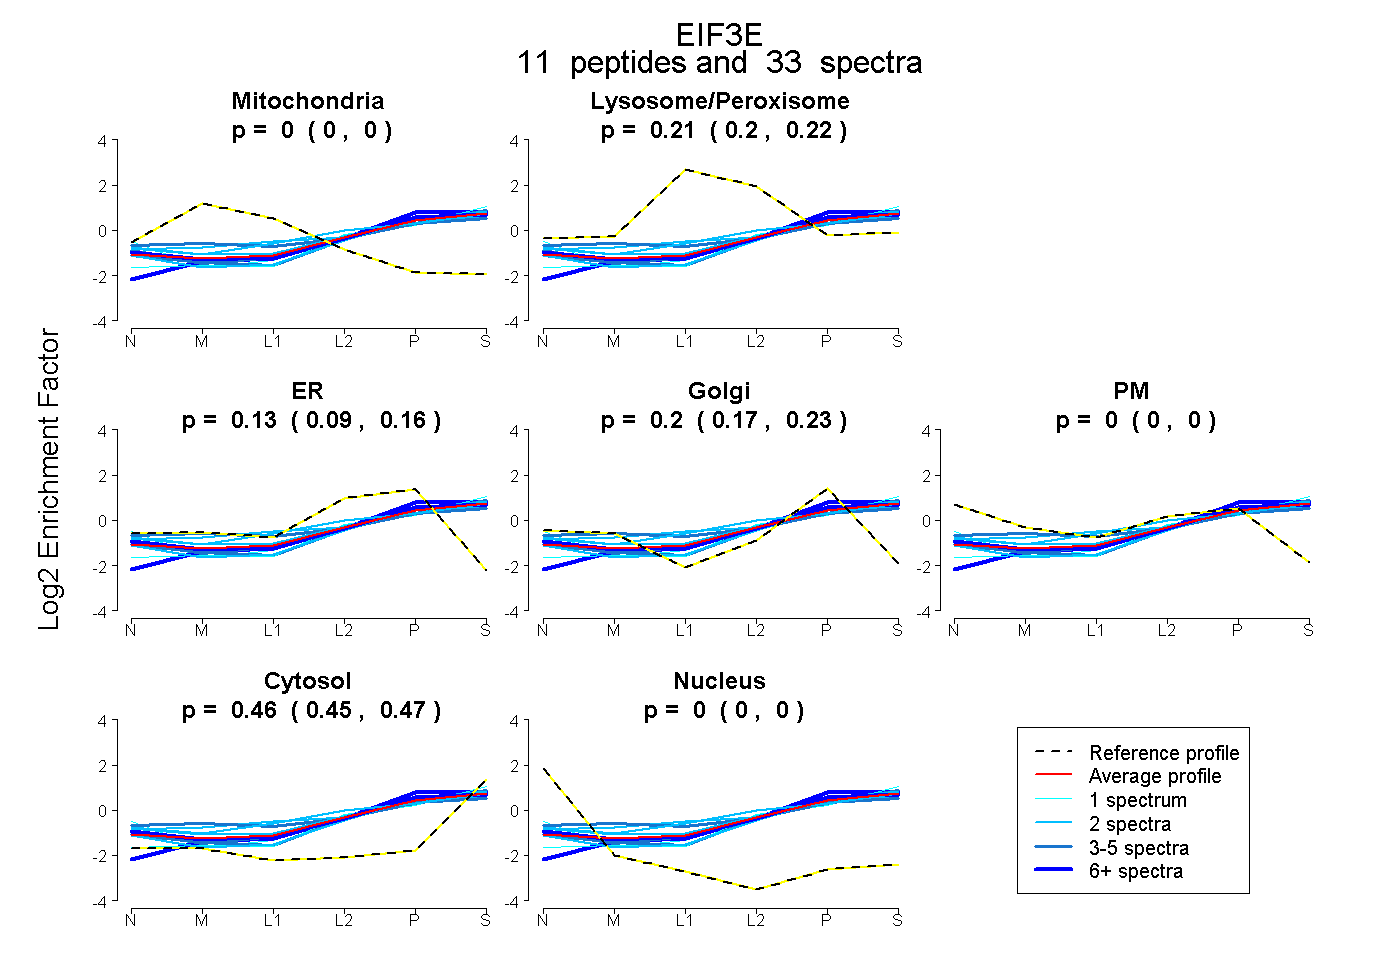 |
0.000
0.000 | 0.000 |
|
0.212
0.198 | 0.224 |
|
0.128
0.094 | 0.155 |
0.204
0.175 | 0.230 |
0.000
0.000 | 0.000 |
0.457
0.445 | 0.466 |
0.000
0.000 | 0.000 |
|
| 2 spectra, QEYLDTLYR |
0.000 |
|
0.083 |
|
0.309 |
0.063 |
0.000 |
0.545 |
0.000 |
|
| 2 spectra, NLYSDDIPHALR |
0.000 |
|
0.279 |
|
0.000 |
0.324 |
0.000 |
0.396 |
0.000 |
|
| 6 spectra, VLVPATDR |
0.000 |
|
0.220 |
|
0.061 |
0.295 |
0.000 |
0.424 |
0.000 |
|
| 3 spectra, LFIFETFCR |
0.000 |
|
0.205 |
|
0.141 |
0.155 |
0.000 |
0.499 |
0.000 |
|
| 2 spectra, YLTTAVITNK |
0.000 |
|
0.366 |
|
0.000 |
0.259 |
0.000 |
0.375 |
0.000 |
|
| 7 spectra, IAHFLDR |
0.000 |
|
0.074 |
|
0.386 |
0.000 |
0.000 |
0.541 |
0.000 |
|
| 1 spectrum, ELLQGK |
0.000 |
|
0.191 |
|
0.136 |
0.225 |
0.000 |
0.448 |
0.000 |
|
| 3 spectra, NALSSLWGK |
0.000 |
|
0.321 |
|
0.000 |
0.331 |
0.000 |
0.348 |
0.000 |
|
| 4 spectra, MFEDPETTR |
0.000 |
|
0.079 |
|
0.320 |
0.076 |
0.000 |
0.525 |
0.000 |
|
| 1 spectrum, MLFDYLADK |
0.000 |
|
0.091 |
|
0.309 |
0.000 |
0.000 |
0.601 |
0.000 |
|
| 2 spectra, AEYDLTTR |
0.000 |
|
0.350 |
|
0.000 |
0.297 |
0.000 |
0.352 |
0.000 |
|
| | | Plot |
|
Lyso |
|
|
|
|
|
|
|
Other |
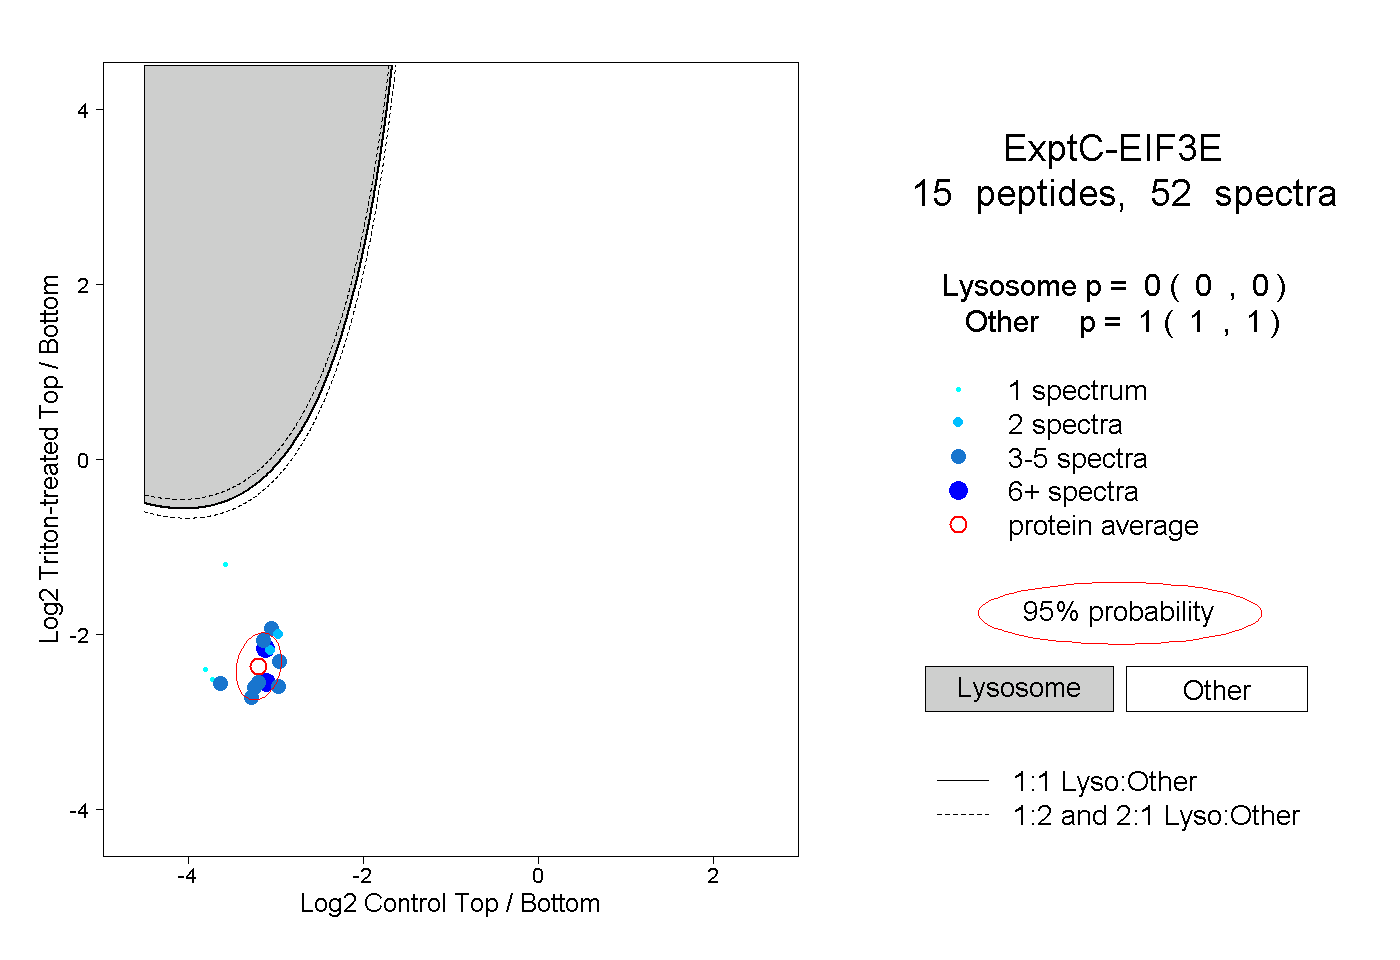
| Expt C |
15
peptides |
52
spectra |
 |
|
0.000
0.000 | 0.000 |
|
|
|
|
|
|
|
1.000
1.000 | 1.000 |
| | | Plot |
|
Lyso |
|
|
|
|
|
|
|
Other |
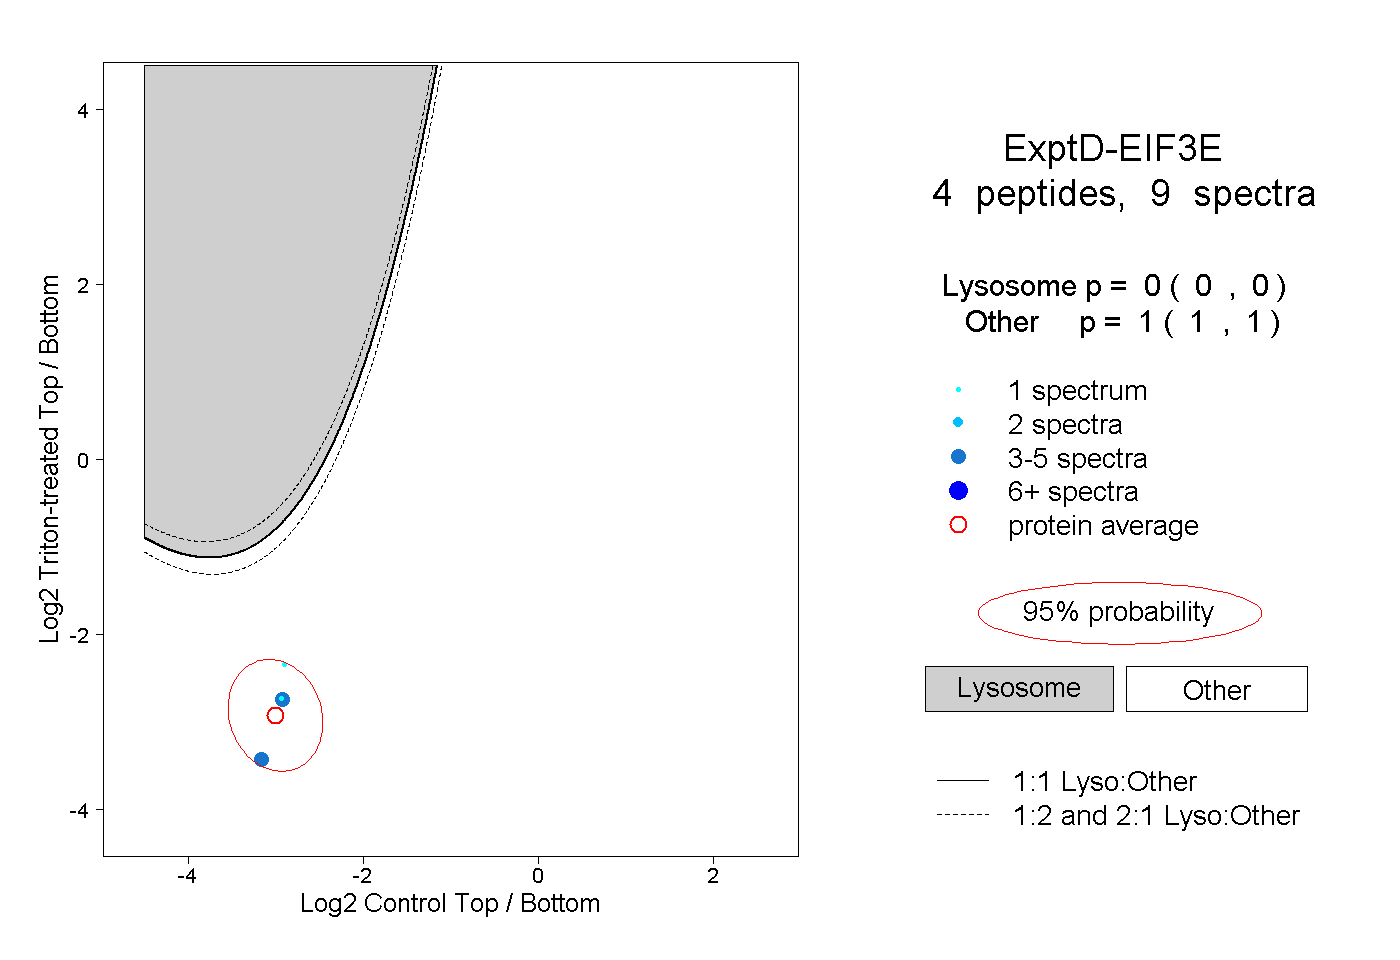
| Expt D |
4
peptides |
9
spectra |
 |
|
0.000
0.000 | 0.000 |
|
|
|
|
|
|
|
1.000
1.000 | 1.000 |