 21
21peptides
spectra
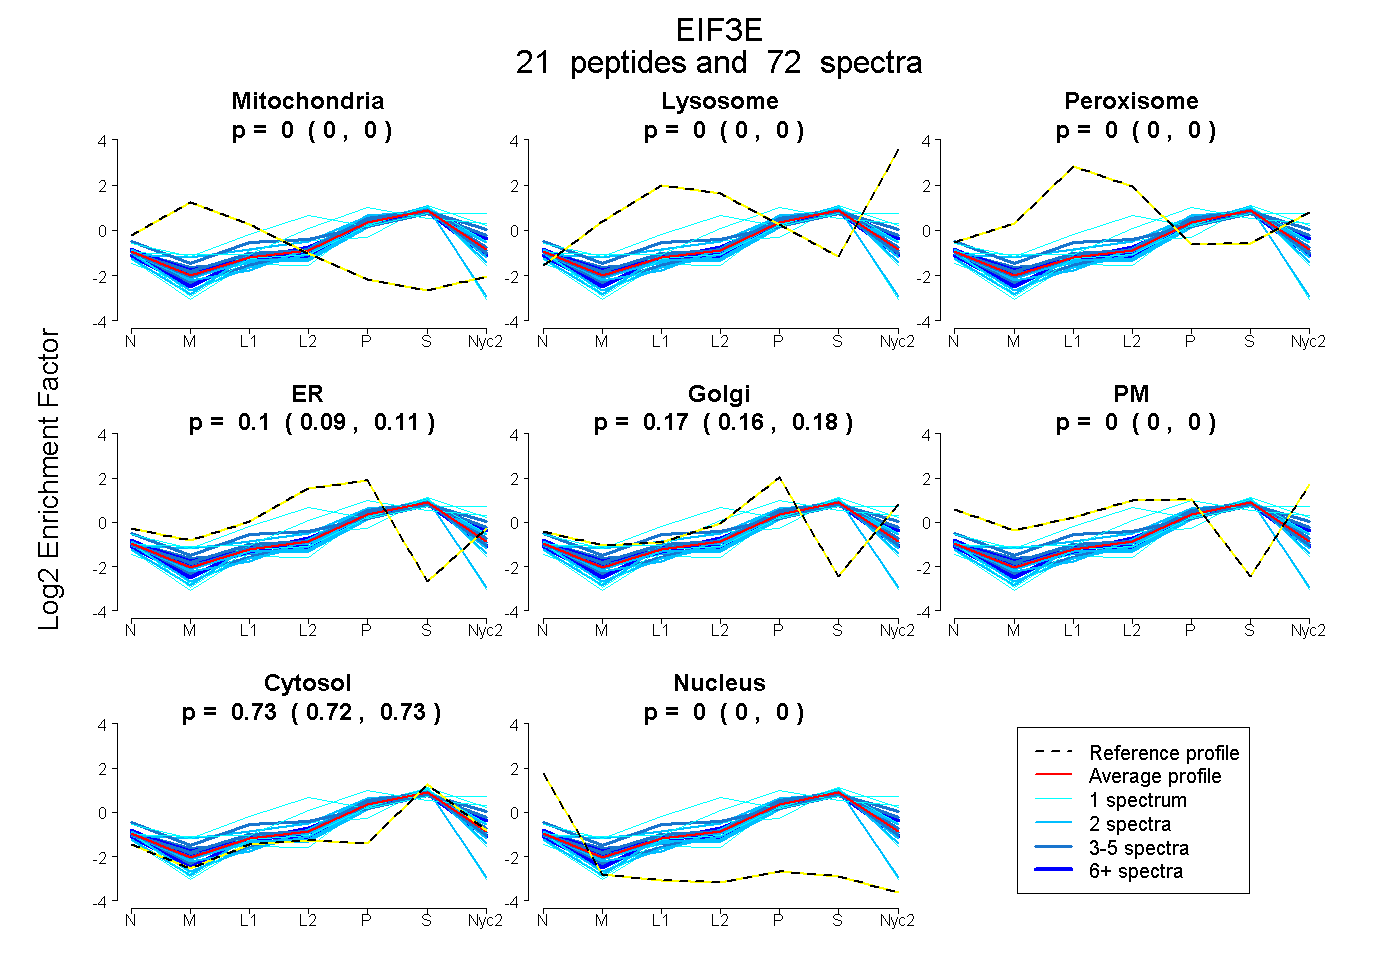
0.000 | 0.000
0.000 | 0.000
0.000 | 0.000
0.093 | 0.113
0.156 | 0.180
0.000 | 0.000
0.723 | 0.729
0.000 | 0.000
| Plot | Mito | Lyso | Perox | ER | Golgi | PM | Cytosol | Nucleus | |||||
| Expt A |
21 peptides |
72 spectra |
|
0.000 0.000 | 0.000 |
0.000 0.000 | 0.000 |
0.000 0.000 | 0.000 |
0.104 0.093 | 0.113 |
0.169 0.156 | 0.180 |
0.000 0.000 | 0.000 |
0.726 0.723 | 0.729 |
0.000 0.000 | 0.000 |
| 2 spectra, QEYLDTLYR | 0.000 | 0.000 | 0.000 | 0.000 | 0.248 | 0.000 | 0.752 | 0.000 | ||
| 3 spectra, SQMLAMNIEK | 0.000 | 0.000 | 0.178 | 0.000 | 0.246 | 0.000 | 0.577 | 0.000 | ||
| 2 spectra, LFIFETFCR | 0.000 | 0.000 | 0.000 | 0.130 | 0.000 | 0.000 | 0.742 | 0.128 | ||
| 1 spectrum, YLTTAVITNK | 0.000 | 0.137 | 0.000 | 0.080 | 0.307 | 0.000 | 0.476 | 0.000 | ||
| 16 spectra, IAHFLDR | 0.000 | 0.000 | 0.000 | 0.144 | 0.129 | 0.000 | 0.727 | 0.000 | ||
| 1 spectrum, ETIDNNSVSSPLQSLQQR | 0.000 | 0.000 | 0.000 | 0.052 | 0.069 | 0.000 | 0.866 | 0.012 | ||
| 3 spectra, ELLQGK | 0.000 | 0.000 | 0.000 | 0.109 | 0.182 | 0.000 | 0.709 | 0.000 | ||
| 2 spectra, NALSSLWGK | 0.000 | 0.000 | 0.000 | 0.041 | 0.248 | 0.000 | 0.710 | 0.000 | ||
| 4 spectra, MFEDPETTR | 0.000 | 0.000 | 0.000 | 0.052 | 0.214 | 0.000 | 0.734 | 0.000 | ||
| 9 spectra, LNMTPEEAER | 0.000 | 0.000 | 0.000 | 0.014 | 0.292 | 0.000 | 0.694 | 0.000 | ||
| 7 spectra, MLFDYLADK | 0.000 | 0.000 | 0.000 | 0.064 | 0.169 | 0.000 | 0.767 | 0.000 | ||
| 1 spectrum, LGHVVMGNNAVSPYQQVIEK | 0.000 | 0.087 | 0.000 | 0.000 | 0.047 | 0.093 | 0.774 | 0.000 | ||
| 2 spectra, LNQNSR | 0.000 | 0.000 | 0.078 | 0.113 | 0.215 | 0.000 | 0.594 | 0.000 | ||
| 2 spectra, NLYSDDIPHALR | 0.000 | 0.000 | 0.000 | 0.179 | 0.000 | 0.000 | 0.821 | 0.000 | ||
| 2 spectra, QLQAETEPIVK | 0.000 | 0.000 | 0.000 | 0.010 | 0.196 | 0.000 | 0.794 | 0.000 | ||
| 4 spectra, VLVPATDR | 0.000 | 0.063 | 0.000 | 0.000 | 0.286 | 0.000 | 0.651 | 0.000 | ||
| 1 spectrum, LDLLSDTNMVDFAMDVYK | 0.000 | 0.000 | 0.000 | 0.094 | 0.000 | 0.000 | 0.794 | 0.112 | ||
| 1 spectrum, TTVVAQLK | 0.000 | 0.000 | 0.000 | 0.000 | 0.217 | 0.000 | 0.783 | 0.000 | ||
| 4 spectra, EIYNEK | 0.000 | 0.000 | 0.000 | 0.000 | 0.253 | 0.000 | 0.747 | 0.000 | ||
| 1 spectrum, VIQQESYTYK | 0.000 | 0.194 | 0.124 | 0.067 | 0.000 | 0.133 | 0.482 | 0.000 | ||
| 4 spectra, QMQSTR | 0.000 | 0.000 | 0.000 | 0.147 | 0.131 | 0.000 | 0.723 | 0.000 |
| Plot | Mito | Lyso or Perox | ER | Golgi | PM | Cytosol | Nucleus | ||||||
| Expt B |
11 peptides |
33 spectra |
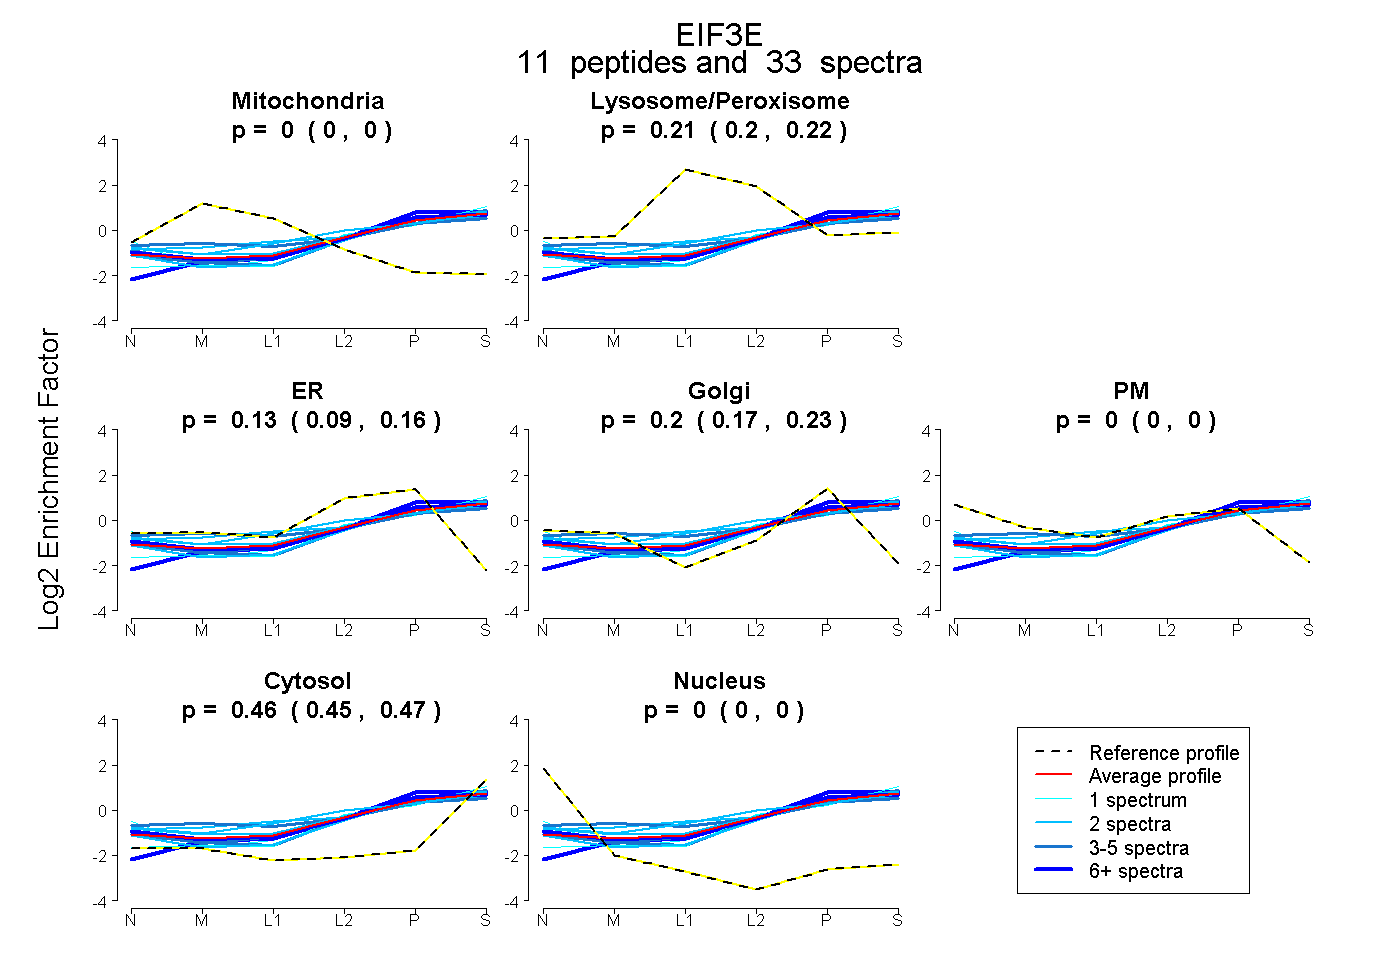 |
0.000 0.000 | 0.000 |
0.212 0.198 | 0.224 |
0.128 0.094 | 0.155 |
0.204 0.175 | 0.230 |
0.000 0.000 | 0.000 |
0.457 0.445 | 0.466 |
0.000 0.000 | 0.000 |
|||
| Plot | Lyso | Other | |||||||||||
| Expt C |
15 peptides |
52 spectra |
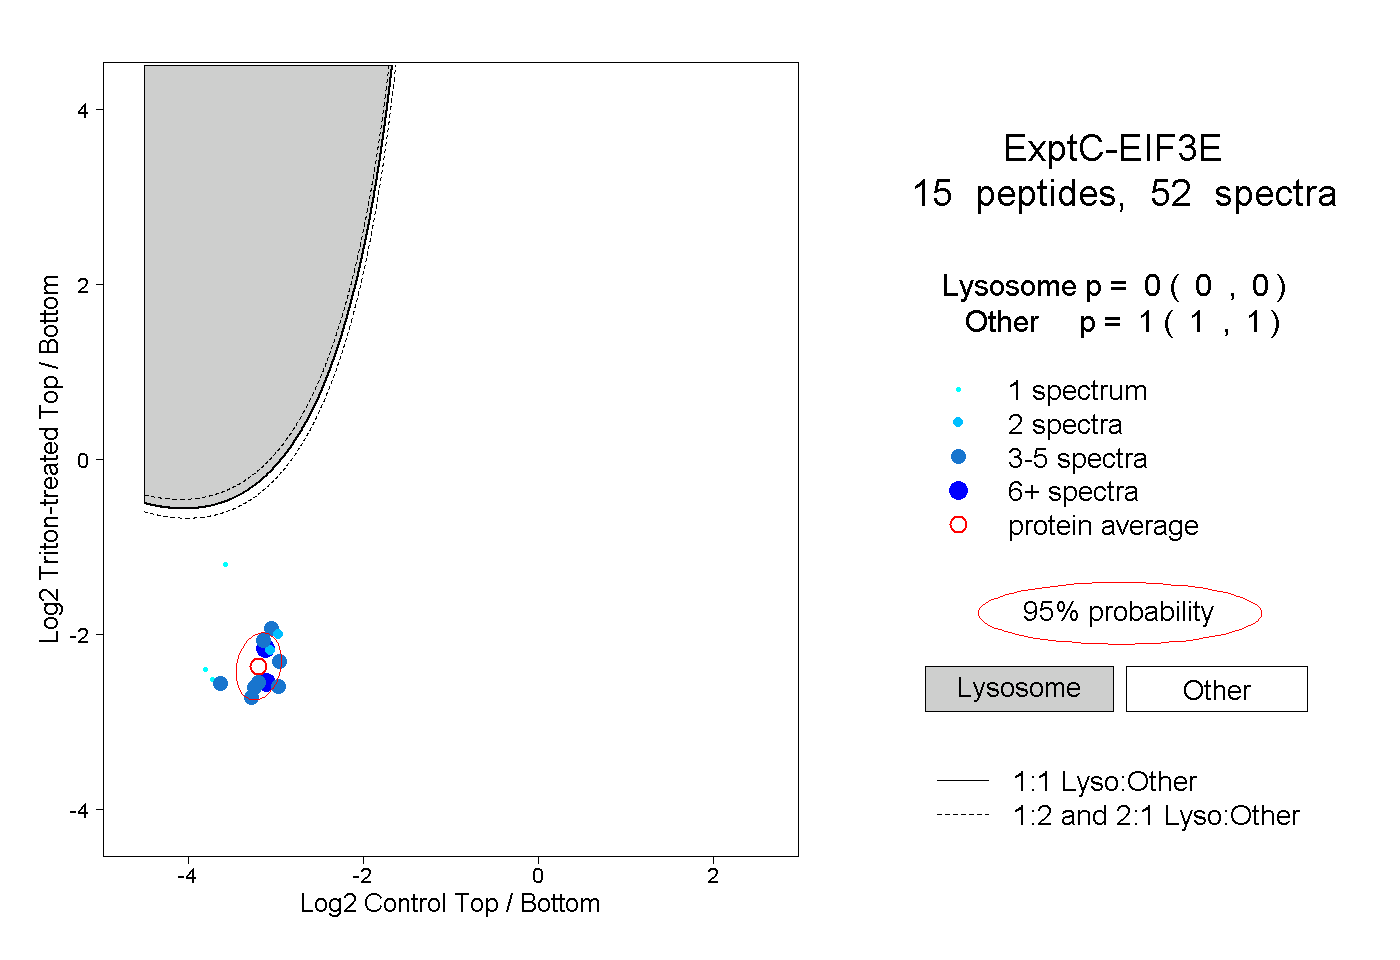 |
0.000 0.000 | 0.000 |
1.000 1.000 | 1.000 |
||||||||
| Plot | Lyso | Other | |||||||||||
| Expt D |
4 peptides |
9 spectra |
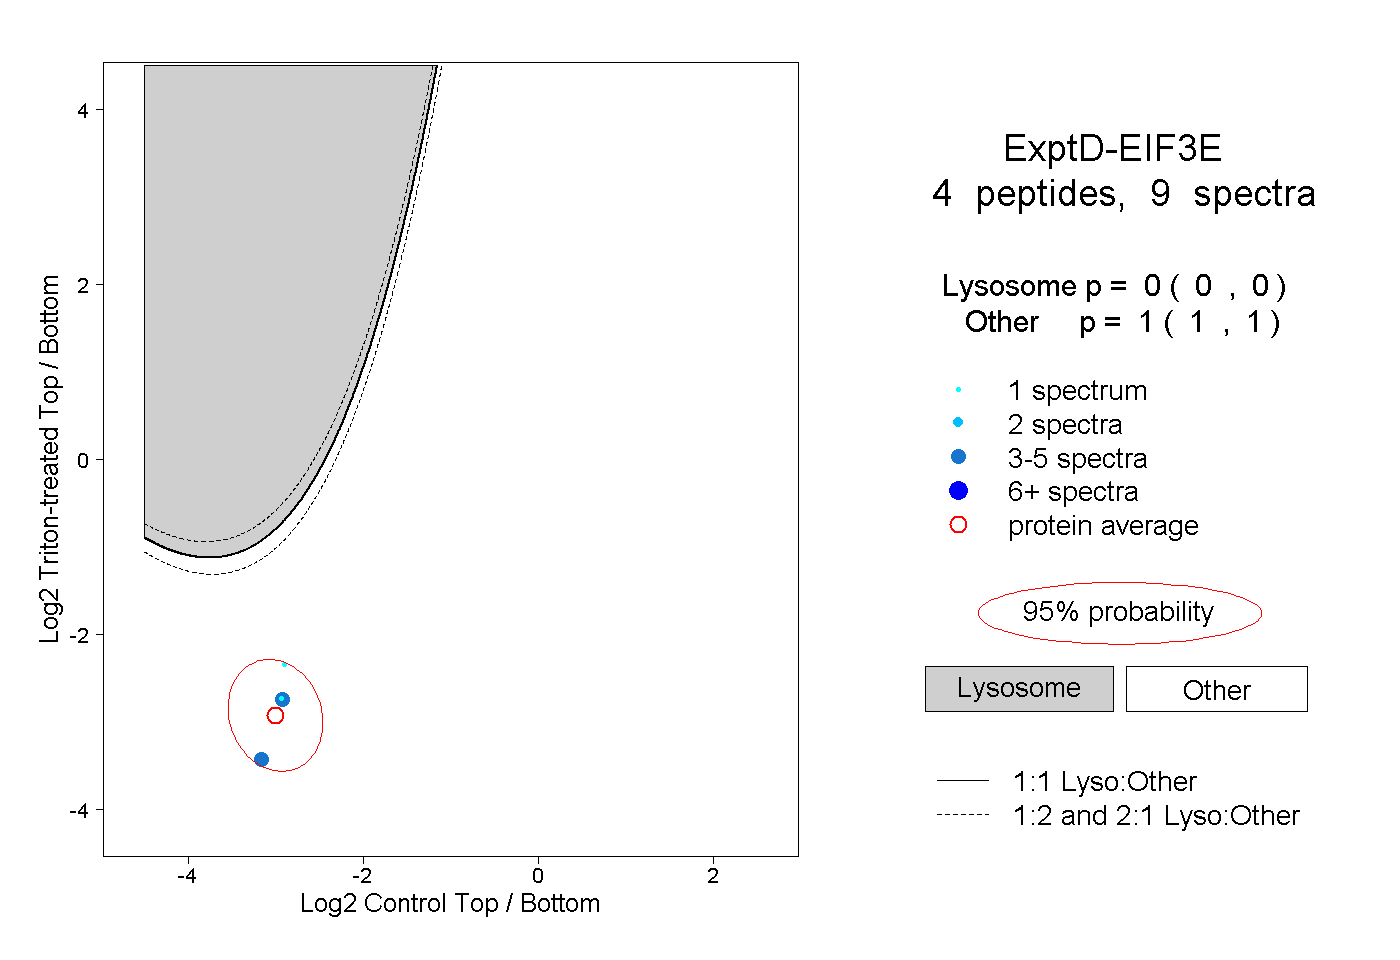 |
0.000 0.000 | 0.000 |
1.000 1.000 | 1.000 |