 25
25peptides
spectra
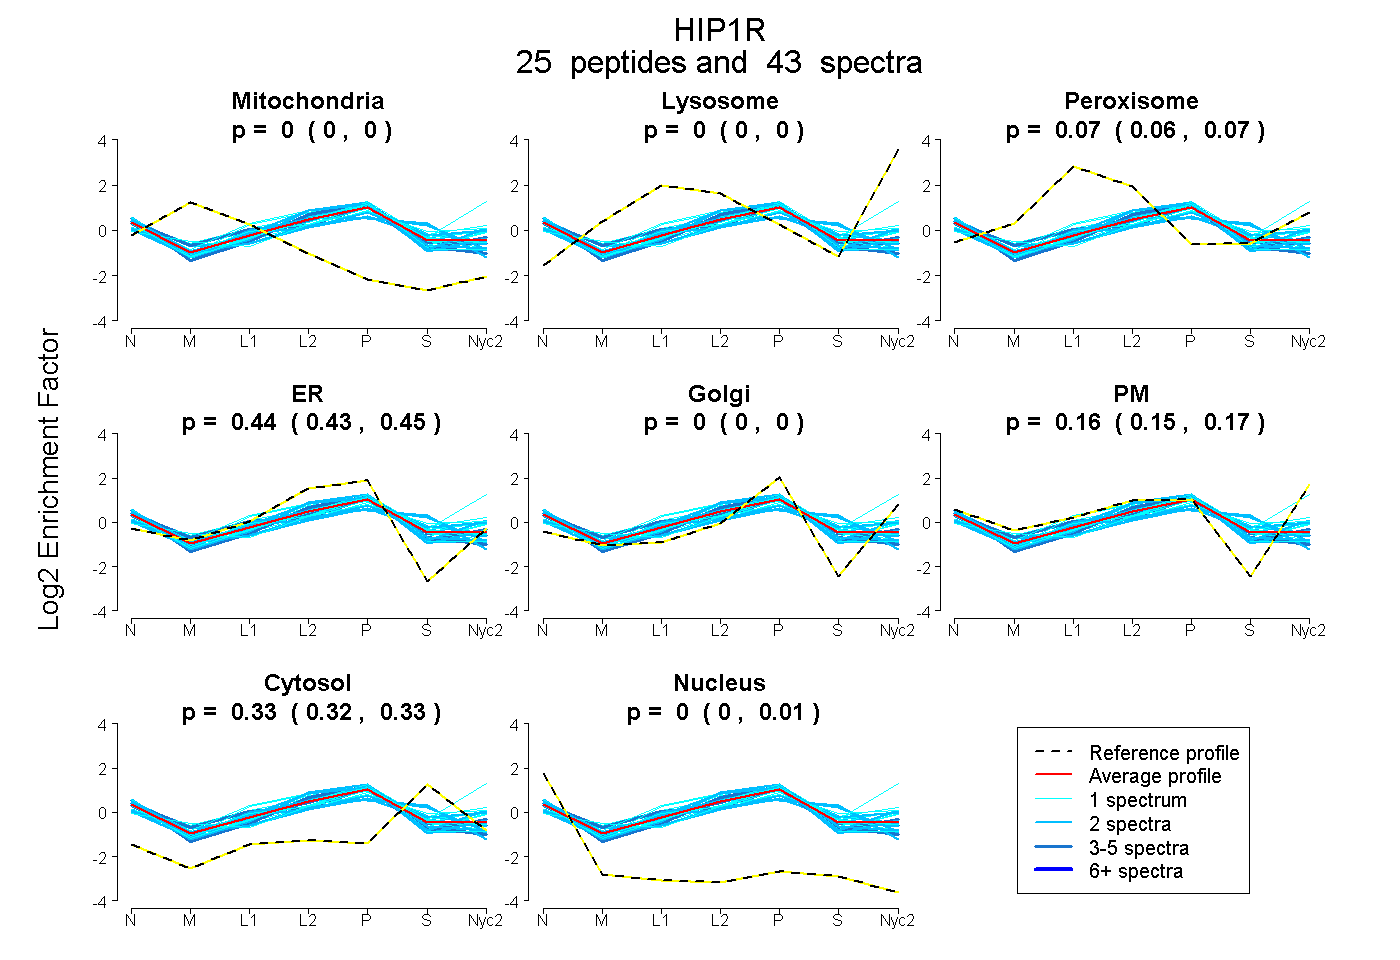
0.000 | 0.000
0.000 | 0.000
0.062 | 0.071
0.431 | 0.448
0.000 | 0.000
0.148 | 0.172
0.325 | 0.333
0.000 | 0.006
4peptides
spectra
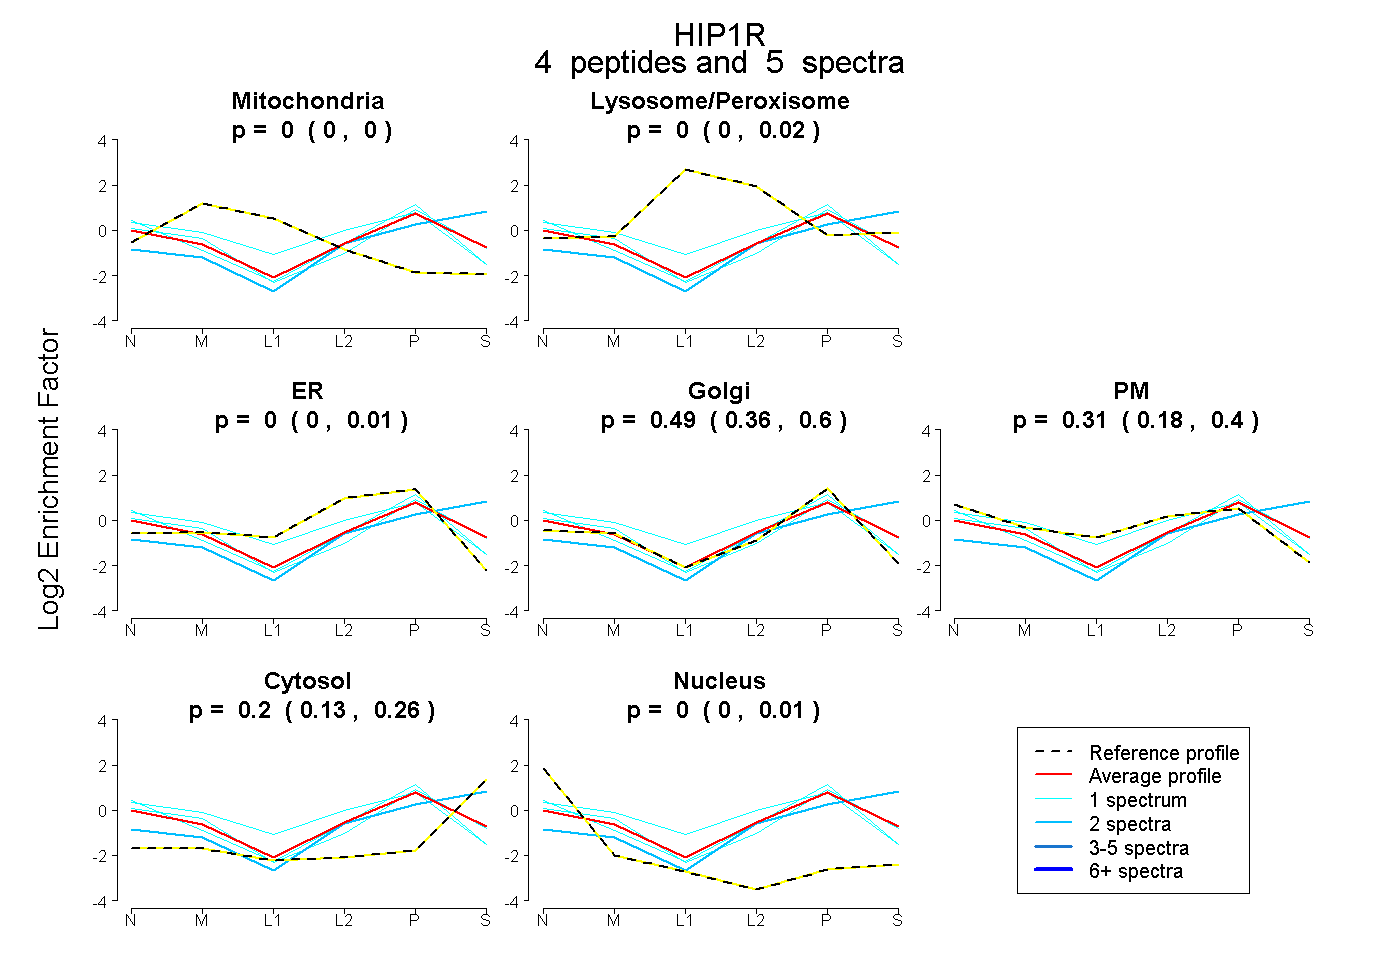
0.000 | 0.000
0.000 | 0.022
0.000 | 0.010
0.358 | 0.596
0.180 | 0.399
0.129 | 0.257
0.000 | 0.005
23peptides
spectra
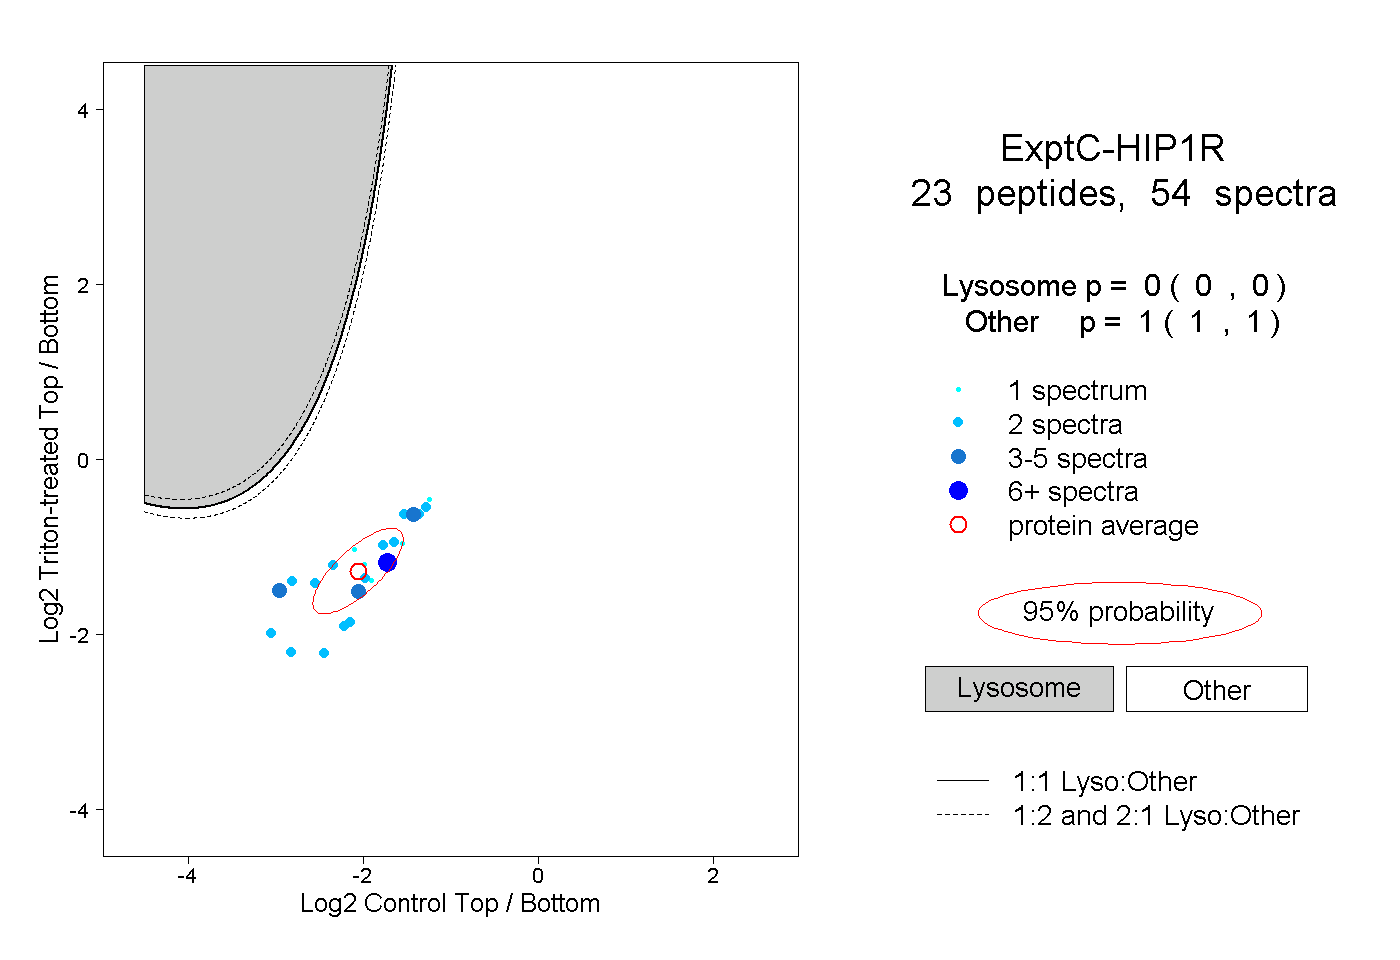
0.000 | 0.000
1.000 | 1.000
2peptides
spectra
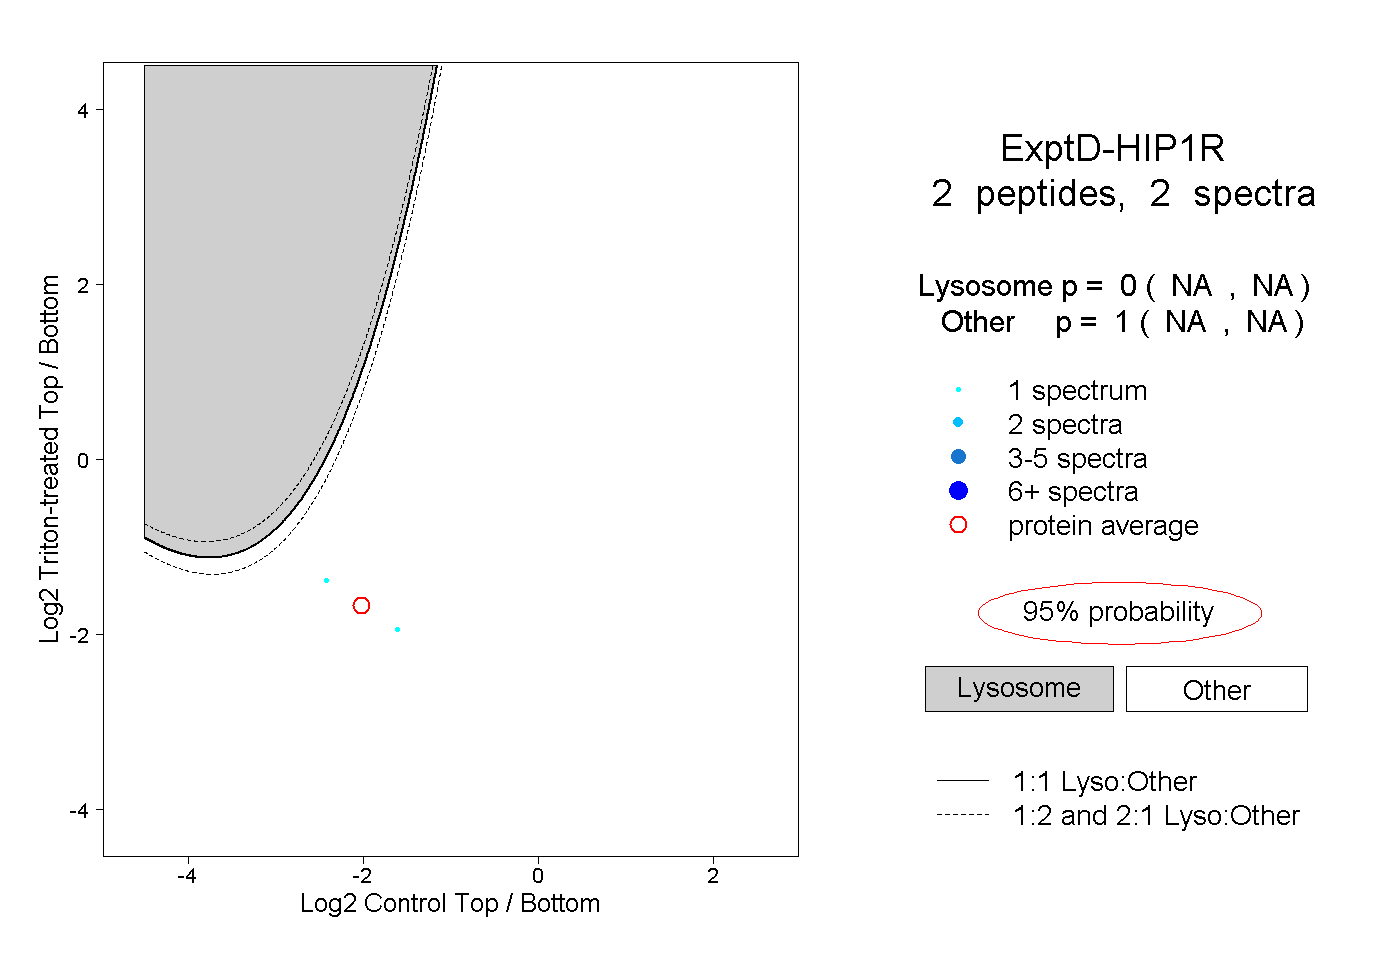
NA | NA
NA | NA