HIP1R
[ENSRNOP00000029635]
Main page
| | | Plot |
Mito |
Lyso |
|
Perox |
ER |
Golgi |
PM |
Cytosol |
Nucleus |
|
| Expt A |
 25
25
peptides |
43
spectra |
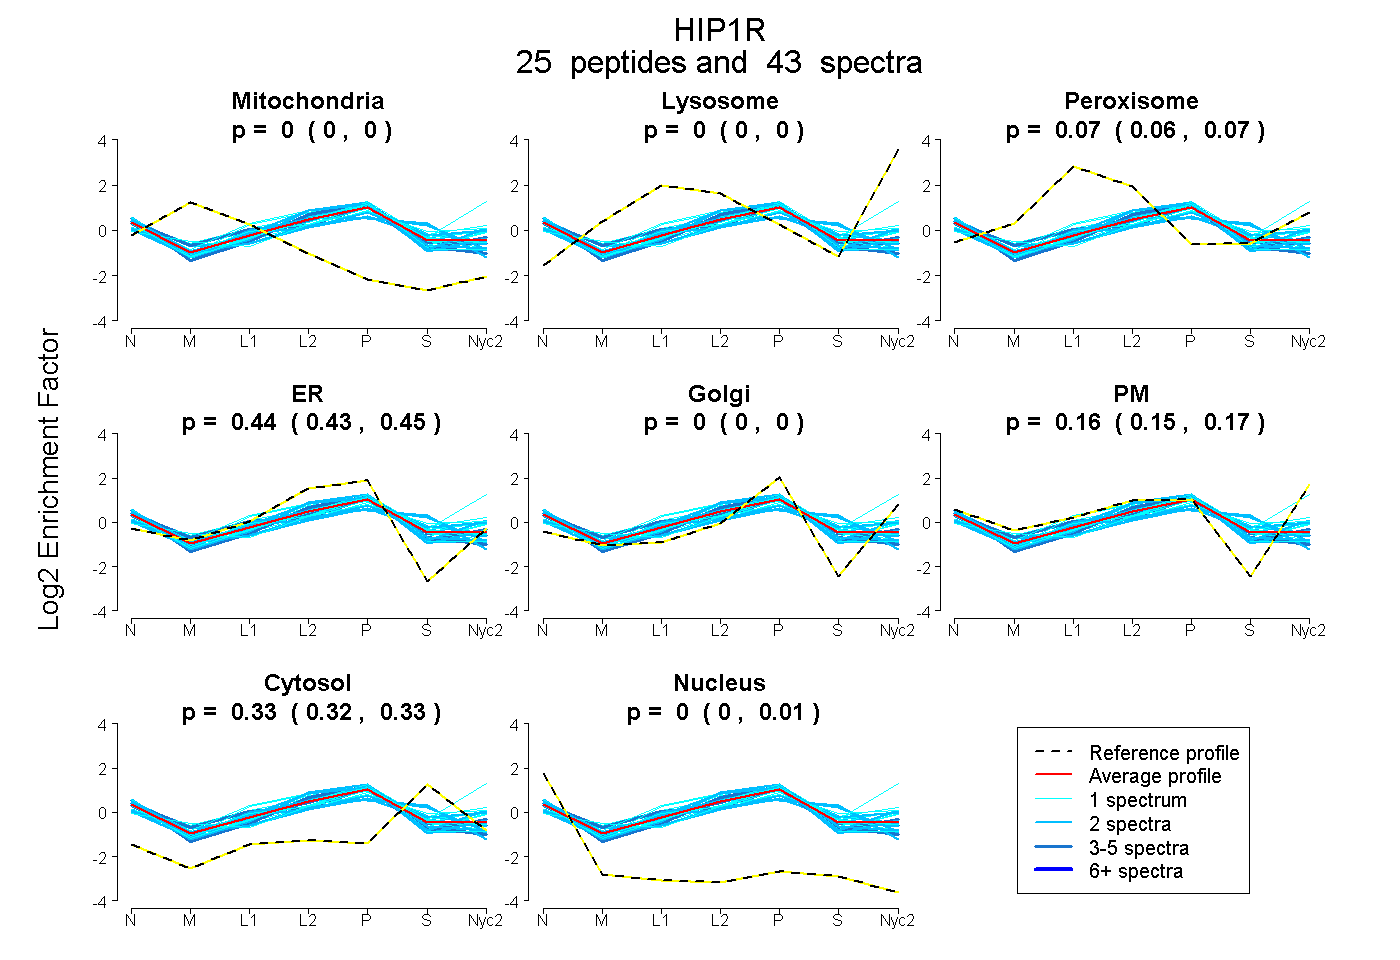 |
0.000
0.000 | 0.000 |
0.000
0.000 | 0.000 |
|
0.067
0.062 | 0.071 |
0.440
0.431 | 0.448 |
0.000
0.000 | 0.000 |
0.161
0.148 | 0.172 |
0.329
0.325 | 0.333 |
0.003
0.000 | 0.006 |
|
| | | Plot |
Mito |
|
Lyso or Perox |
|
ER |
Golgi |
PM |
Cytosol |
Nucleus |
|
| Expt B |
4
peptides |
5
spectra |
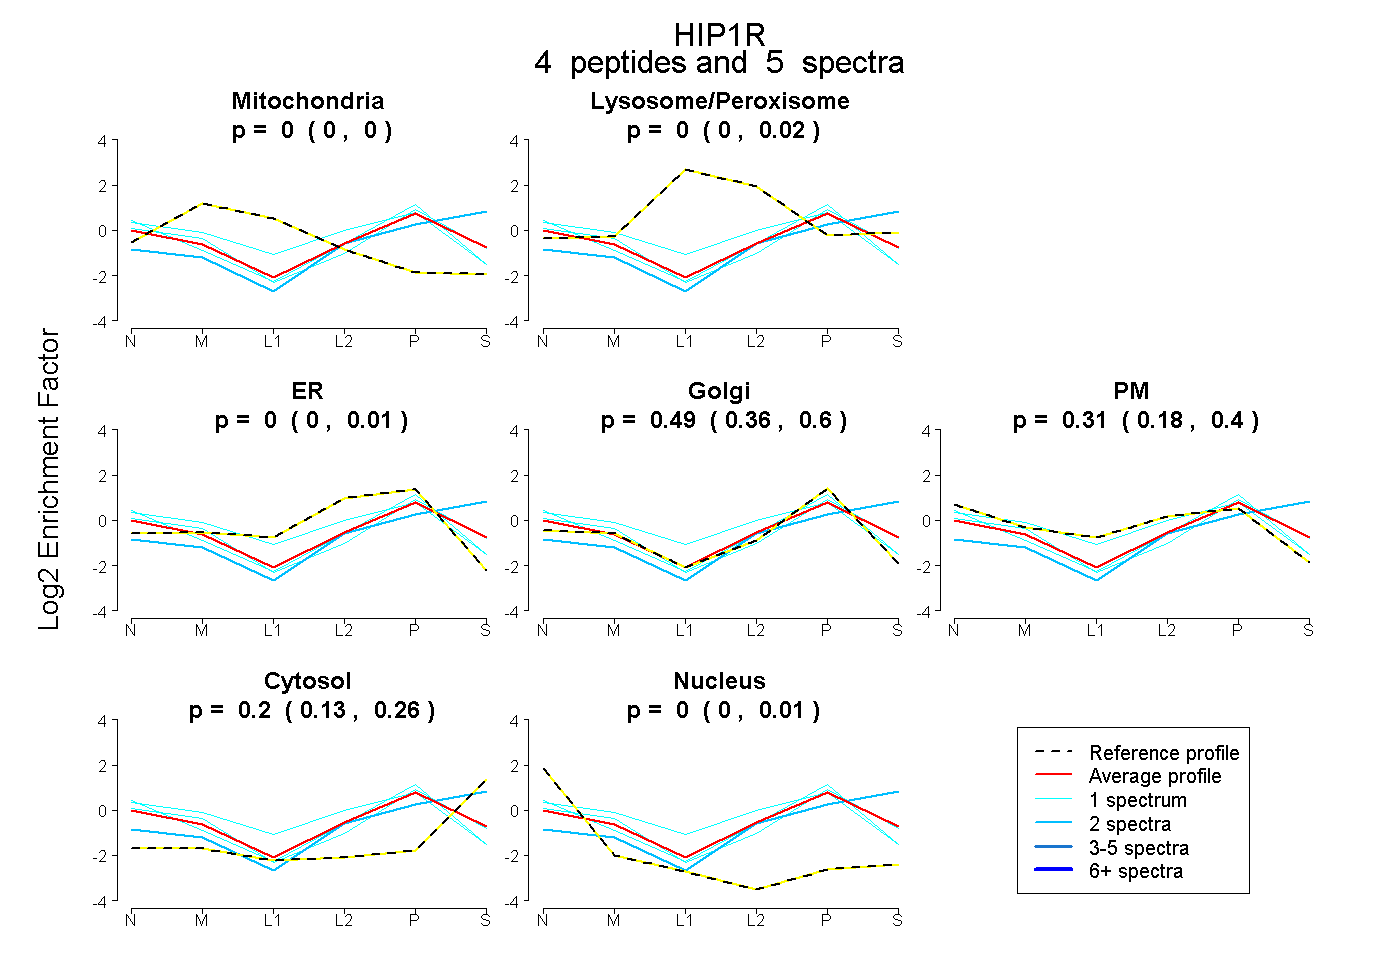 |
0.000
0.000 | 0.000 |
|
0.000
0.000 | 0.022 |
|
0.000
0.000 | 0.010 |
0.490
0.358 | 0.596 |
0.307
0.180 | 0.399 |
0.202
0.129 | 0.257 |
0.000
0.000 | 0.005 |
|
| 1 spectrum, EIVESGR |
0.000 |
|
0.000 |
|
0.000 |
0.663 |
0.148 |
0.182 |
0.007 |
|
| 1 spectrum, LPEGPPNFLR |
0.000 |
|
0.062 |
|
0.000 |
0.278 |
0.644 |
0.015 |
0.000 |
|
| 2 spectra, YISQLK |
0.000 |
|
0.000 |
|
0.146 |
0.289 |
0.000 |
0.565 |
0.000 |
|
| 1 spectrum, LDDPLHLR |
0.000 |
|
0.000 |
|
0.000 |
0.692 |
0.232 |
0.008 |
0.067 |
|
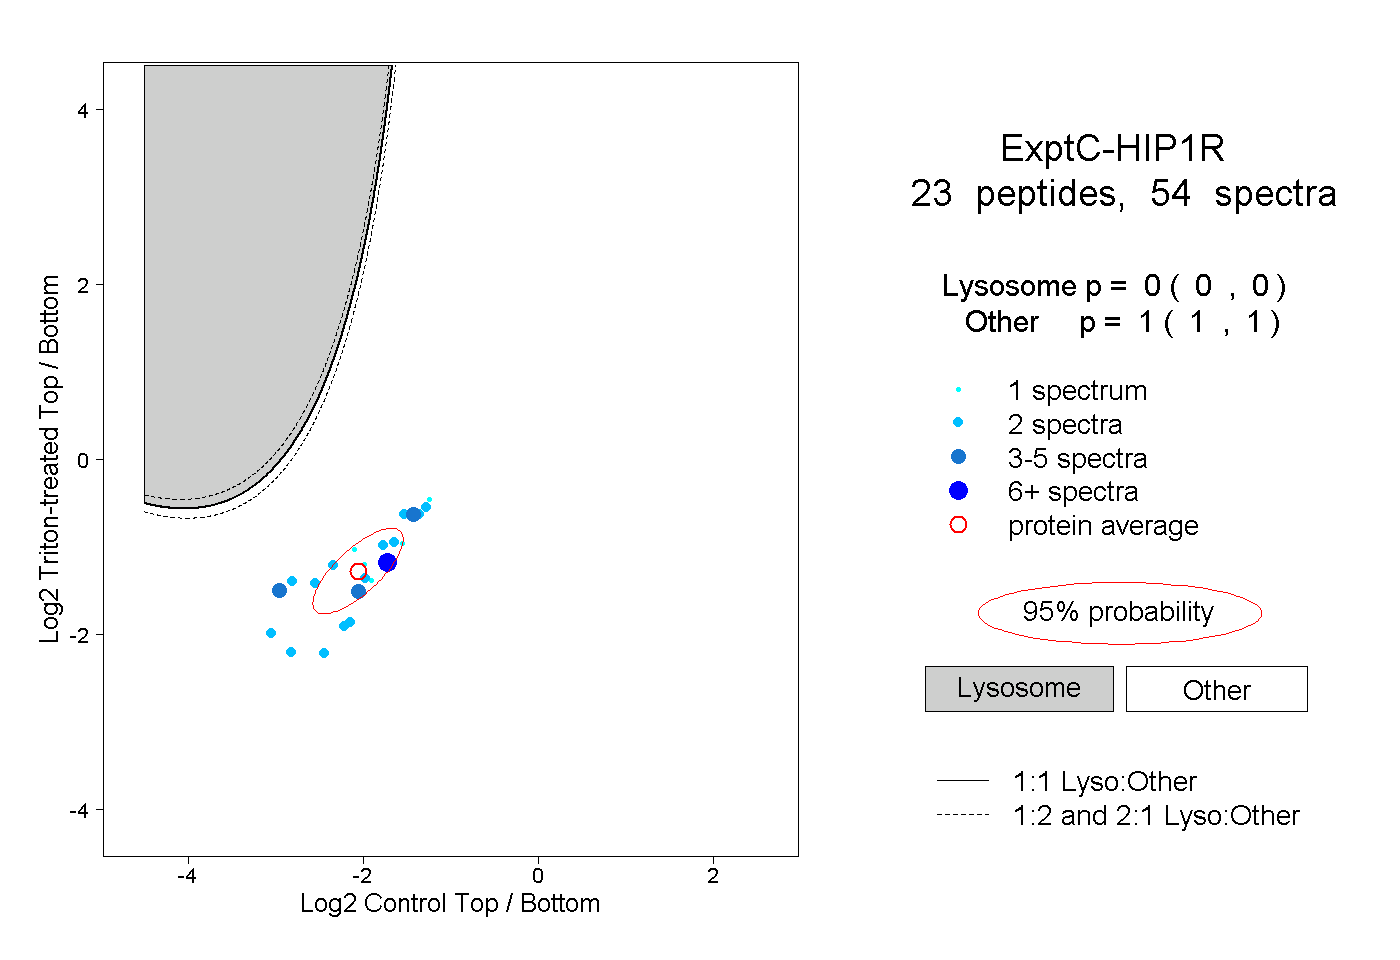
| | | Plot |
|
Lyso |
|
|
|
|
|
|
|
Other |
| Expt C |
23
peptides |
54
spectra |
 |
|
0.000
0.000 | 0.000 |
|
|
|
|
|
|
|
1.000
1.000 | 1.000 |
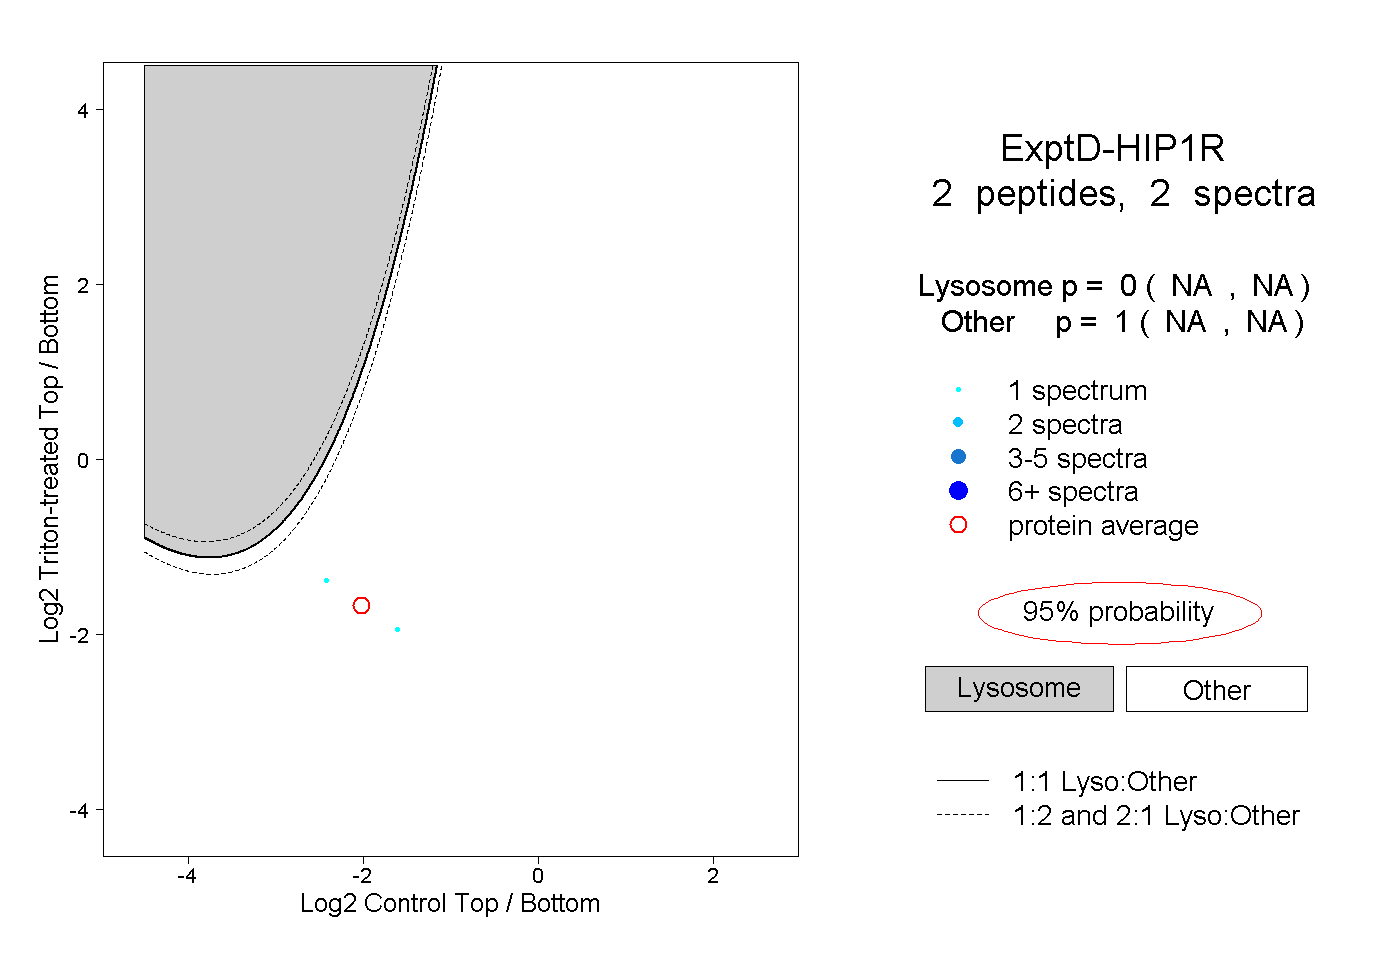
| | | Plot |
|
Lyso |
|
|
|
|
|
|
|
Other |
| Expt D |
2
peptides |
2
spectra |
 |
|
0.000
NA | NA |
|
|
|
|
|
|
|
1.000
NA | NA |