 25
25peptides
spectra
0.000 | 0.000
0.000 | 0.000
0.062 | 0.071
0.431 | 0.448
0.000 | 0.000
0.148 | 0.172
0.325 | 0.333
0.000 | 0.006
| Plot | Mito | Lyso | Perox | ER | Golgi | PM | Cytosol | Nucleus | |||||
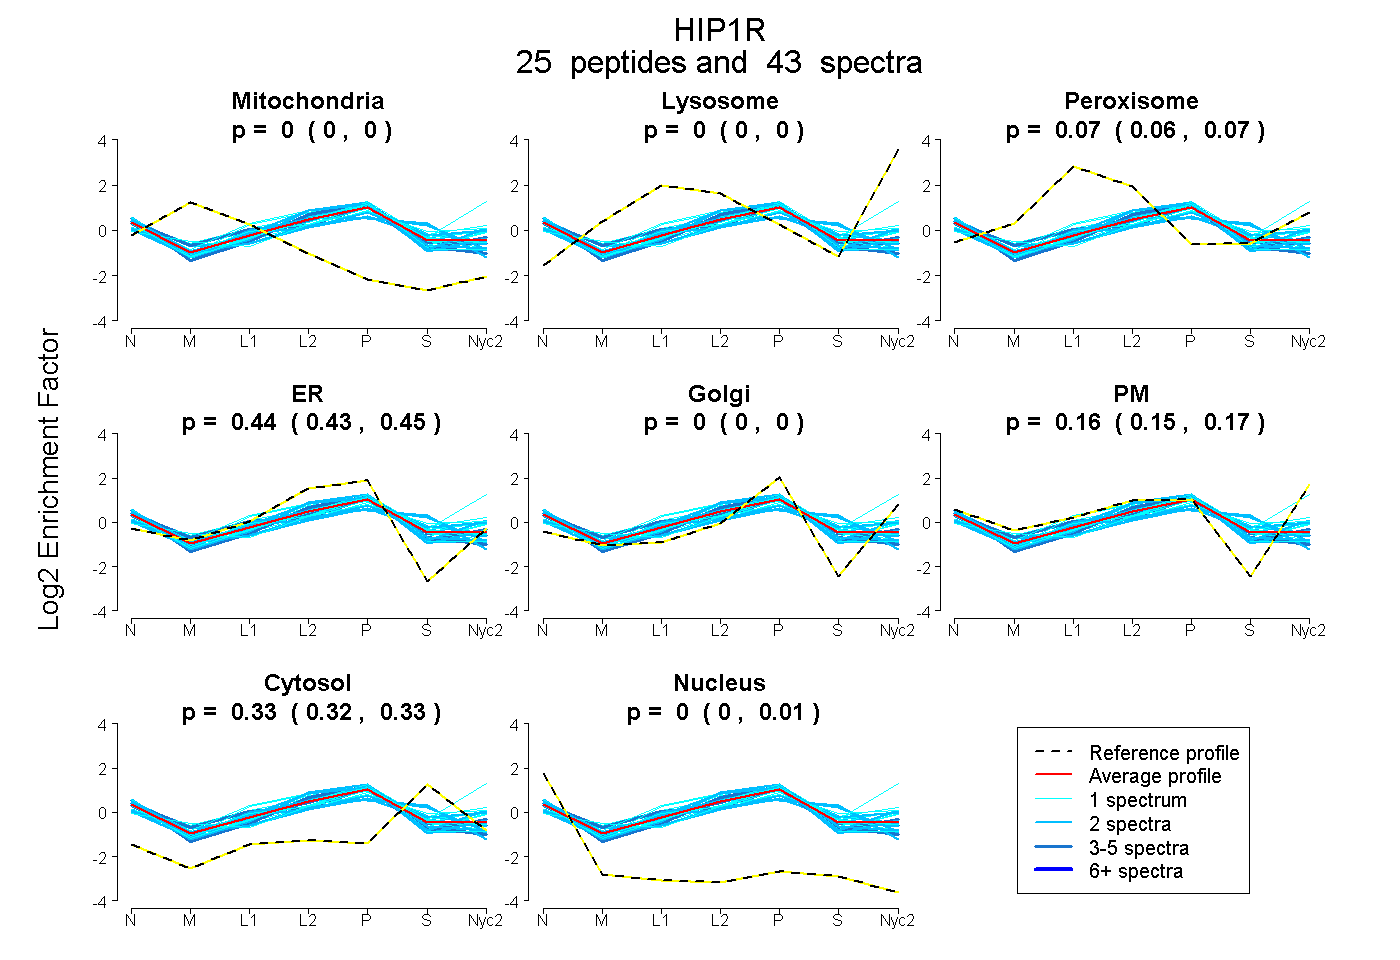
| Expt A |
25 peptides |
43 spectra |
|
0.000 0.000 | 0.000 |
0.000 0.000 | 0.000 |
0.067 0.062 | 0.071 |
0.440 0.431 | 0.448 |
0.000 0.000 | 0.000 |
0.161 0.148 | 0.172 |
0.329 0.325 | 0.333 |
0.003 0.000 | 0.006 |
| 1 spectrum, EIVESGR | 0.000 | 0.000 | 0.201 | 0.399 | 0.085 | 0.054 | 0.261 | 0.000 | ||
| 1 spectrum, ASDMLYFK | 0.000 | 0.000 | 0.137 | 0.324 | 0.000 | 0.284 | 0.253 | 0.002 | ||
| 2 spectra, DGHPNVLHDCQR | 0.009 | 0.000 | 0.072 | 0.319 | 0.000 | 0.192 | 0.343 | 0.064 | ||
| 2 spectra, EAELLAAQSLVR | 0.000 | 0.000 | 0.101 | 0.609 | 0.000 | 0.000 | 0.207 | 0.082 | ||
| 1 spectrum, LSESVFR | 0.000 | 0.000 | 0.000 | 0.410 | 0.000 | 0.294 | 0.296 | 0.000 | ||
| 4 spectra, LDDPLHLR | 0.000 | 0.000 | 0.009 | 0.651 | 0.000 | 0.000 | 0.287 | 0.052 | ||
| 1 spectrum, GAATQQEFYAK | 0.000 | 0.000 | 0.165 | 0.414 | 0.000 | 0.209 | 0.212 | 0.000 | ||
| 2 spectra, LPEGPPNFLR | 0.000 | 0.000 | 0.062 | 0.471 | 0.000 | 0.196 | 0.228 | 0.043 | ||
| 2 spectra, LLDEQFAVLR | 0.000 | 0.000 | 0.022 | 0.670 | 0.000 | 0.000 | 0.295 | 0.013 | ||
| 1 spectrum, HPQFPAGLEVTDEVLEK | 0.000 | 0.000 | 0.067 | 0.351 | 0.000 | 0.282 | 0.300 | 0.000 | ||
| 2 spectra, MEEQSDQLEK | 0.000 | 0.000 | 0.095 | 0.423 | 0.000 | 0.000 | 0.475 | 0.007 | ||
| 4 spectra, EIGDLWGHLR | 0.000 | 0.000 | 0.194 | 0.293 | 0.196 | 0.074 | 0.183 | 0.061 | ||
| 2 spectra, TEQSGSELSSR | 0.000 | 0.000 | 0.055 | 0.383 | 0.000 | 0.322 | 0.240 | 0.000 | ||
| 1 spectrum, AGELAHAQEALSR | 0.000 | 0.000 | 0.088 | 0.459 | 0.000 | 0.112 | 0.336 | 0.005 | ||
| 1 spectrum, DQYGHLVNIYTK | 0.000 | 0.000 | 0.222 | 0.005 | 0.322 | 0.165 | 0.286 | 0.000 | ||
| 4 spectra, ALVDNEQLR | 0.000 | 0.000 | 0.060 | 0.537 | 0.000 | 0.073 | 0.321 | 0.008 | ||
| 1 spectrum, WTEGLISASK | 0.000 | 0.000 | 0.099 | 0.147 | 0.158 | 0.228 | 0.368 | 0.000 | ||
| 2 spectra, AQPSLMR | 0.000 | 0.000 | 0.105 | 0.494 | 0.000 | 0.050 | 0.351 | 0.000 | ||
| 1 spectrum, HNELINTHAELLR | 0.000 | 0.000 | 0.026 | 0.541 | 0.000 | 0.068 | 0.338 | 0.027 | ||
| 1 spectrum, VVLHMGK | 0.000 | 0.000 | 0.034 | 0.521 | 0.000 | 0.086 | 0.359 | 0.000 | ||
| 2 spectra, LIDTCR | 0.000 | 0.000 | 0.164 | 0.384 | 0.000 | 0.000 | 0.440 | 0.012 | ||
| 1 spectrum, YISQLK | 0.000 | 0.077 | 0.000 | 0.000 | 0.000 | 0.619 | 0.304 | 0.000 | ||
| 1 spectrum, LIQIPR | 0.000 | 0.000 | 0.050 | 0.484 | 0.000 | 0.130 | 0.319 | 0.017 | ||
| 1 spectrum, QLTVTQQSQEEVAR | 0.000 | 0.000 | 0.072 | 0.568 | 0.000 | 0.043 | 0.233 | 0.084 | ||
| 2 spectra, RPGHSLEAER | 0.000 | 0.000 | 0.066 | 0.195 | 0.000 | 0.359 | 0.380 | 0.000 |
| Plot | Mito | Lyso or Perox | ER | Golgi | PM | Cytosol | Nucleus | ||||||
| Expt B |
4 peptides |
5 spectra |
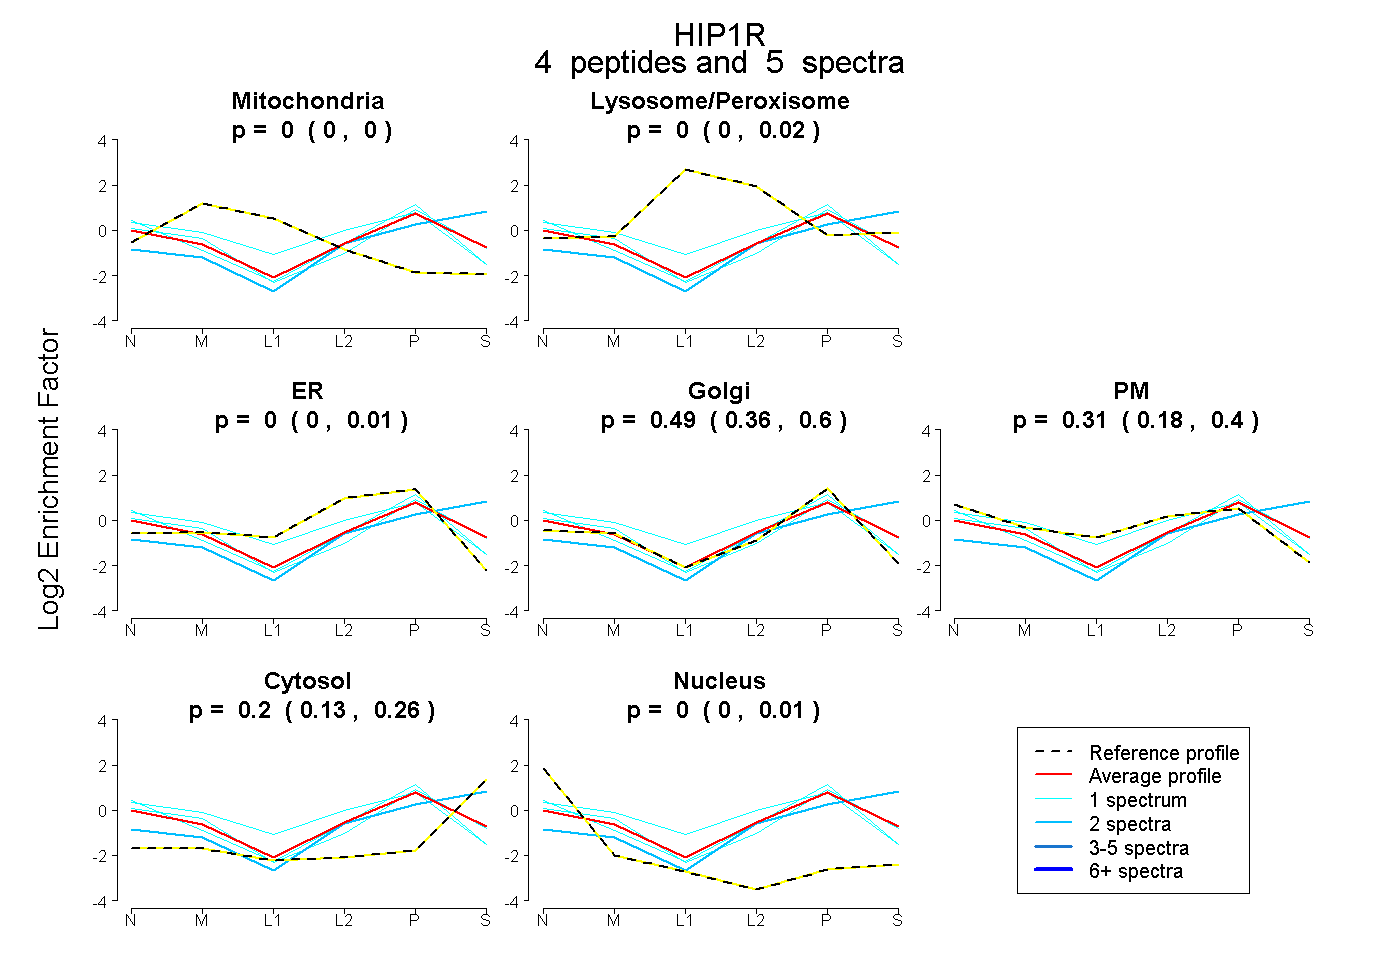 |
0.000 0.000 | 0.000 |
0.000 0.000 | 0.022 |
0.000 0.000 | 0.010 |
0.490 0.358 | 0.596 |
0.307 0.180 | 0.399 |
0.202 0.129 | 0.257 |
0.000 0.000 | 0.005 |
|||
| Plot | Lyso | Other | |||||||||||
| Expt C |
23 peptides |
54 spectra |
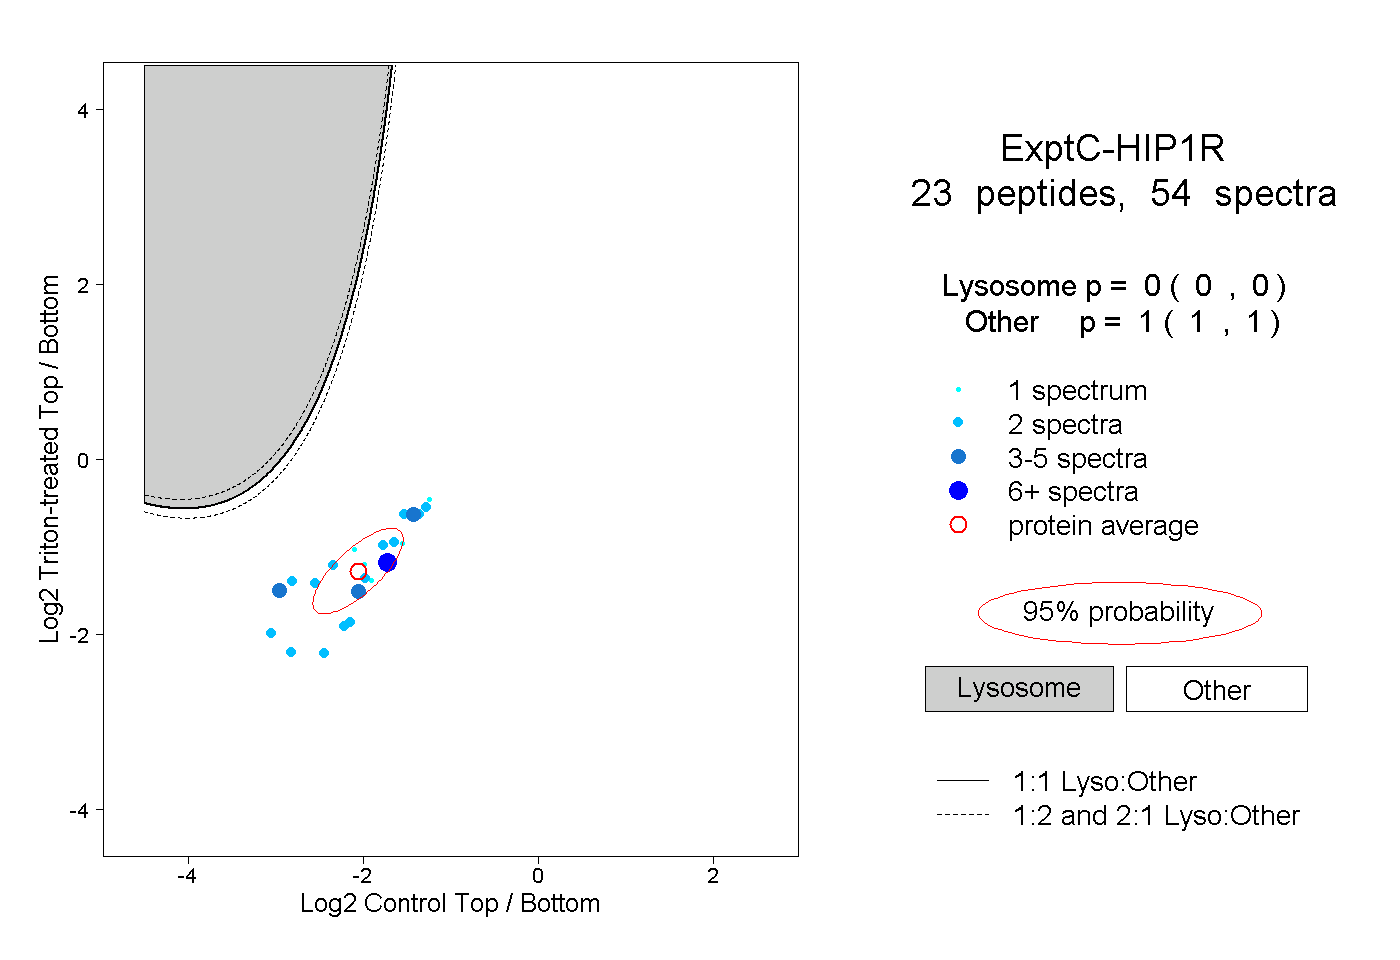 |
0.000 0.000 | 0.000 |
1.000 1.000 | 1.000 |
||||||||
| Plot | Lyso | Other | |||||||||||
| Expt D |
2 peptides |
2 spectra |
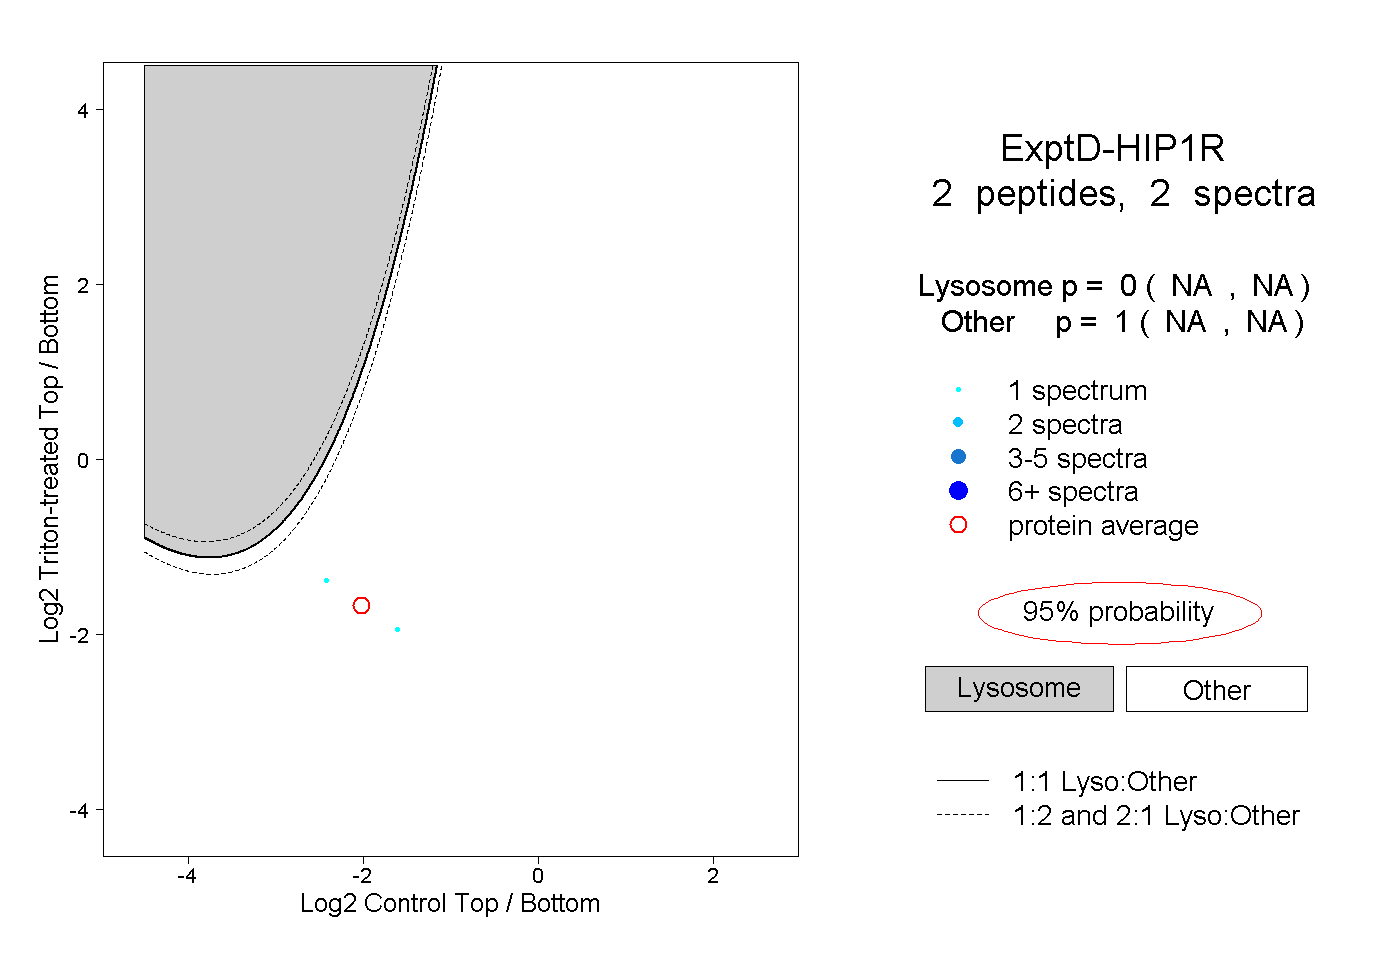 |
0.000 NA | NA |
1.000 NA | NA |