 22
22peptides
spectra
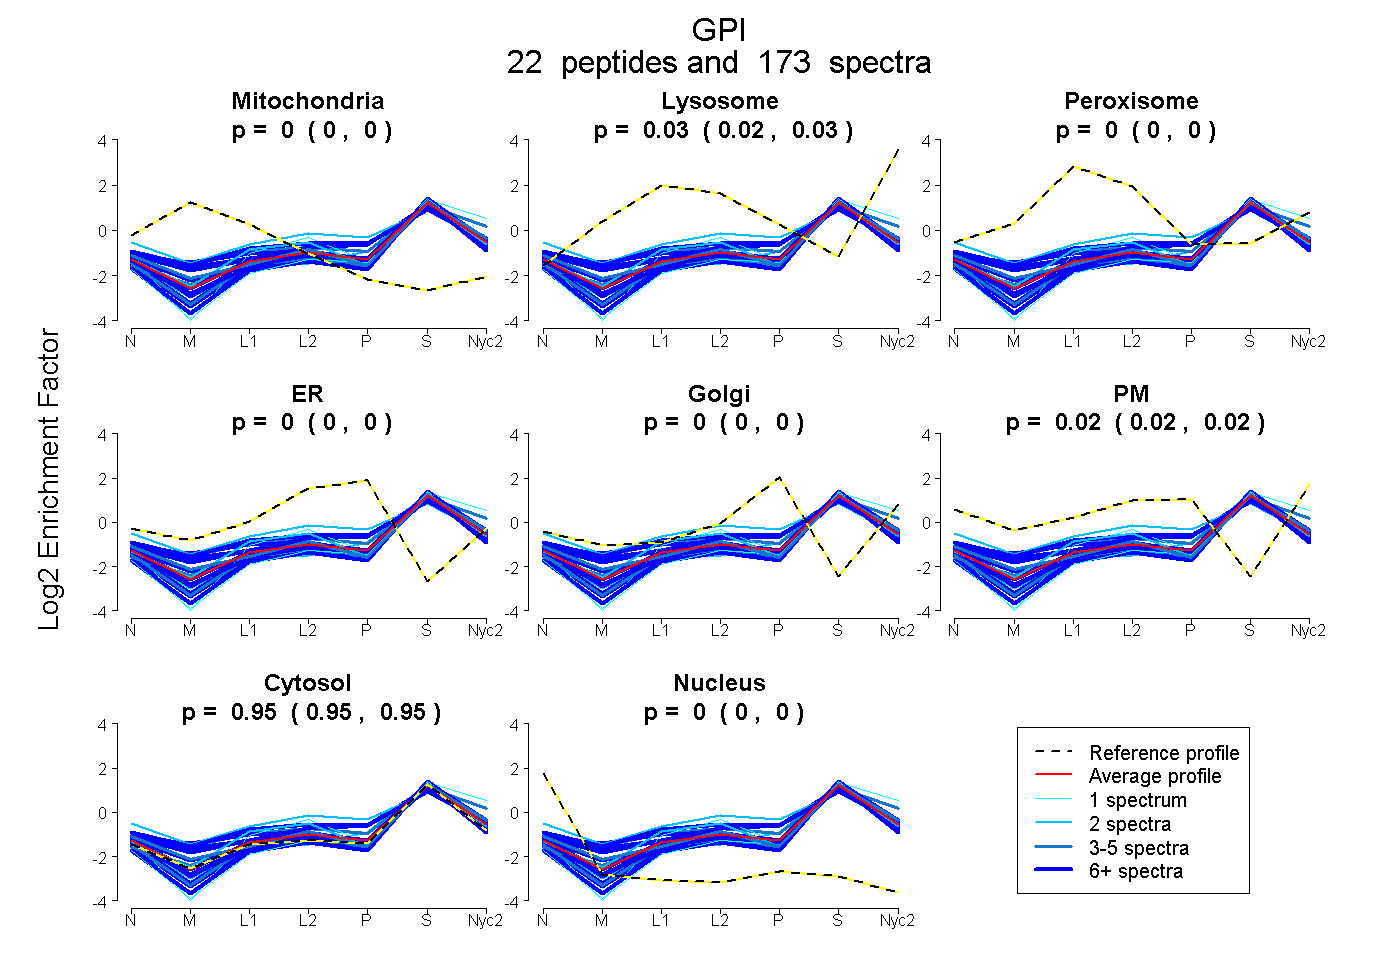
0.000 | 0.000
0.024 | 0.029
0.000 | 0.000
0.000 | 0.000
0.000 | 0.000
0.020 | 0.024
0.949 | 0.952
0.000 | 0.000
11peptides
spectra
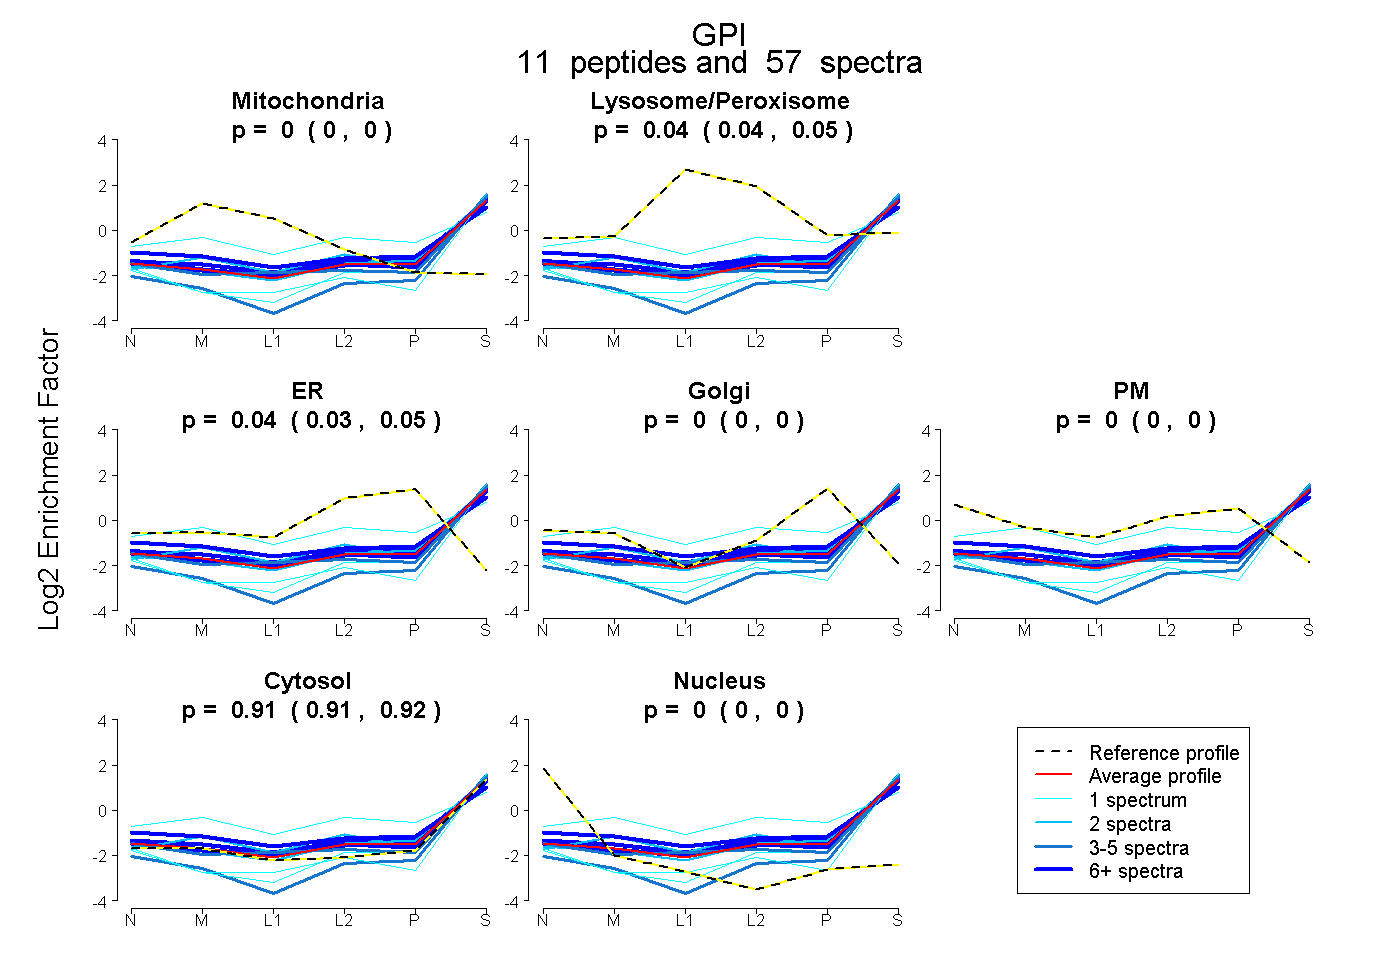
0.000 | 0.000
0.035 | 0.052
0.034 | 0.049
0.000 | 0.000
0.000 | 0.001
0.908 | 0.917
0.000 | 0.000
22peptides
spectra
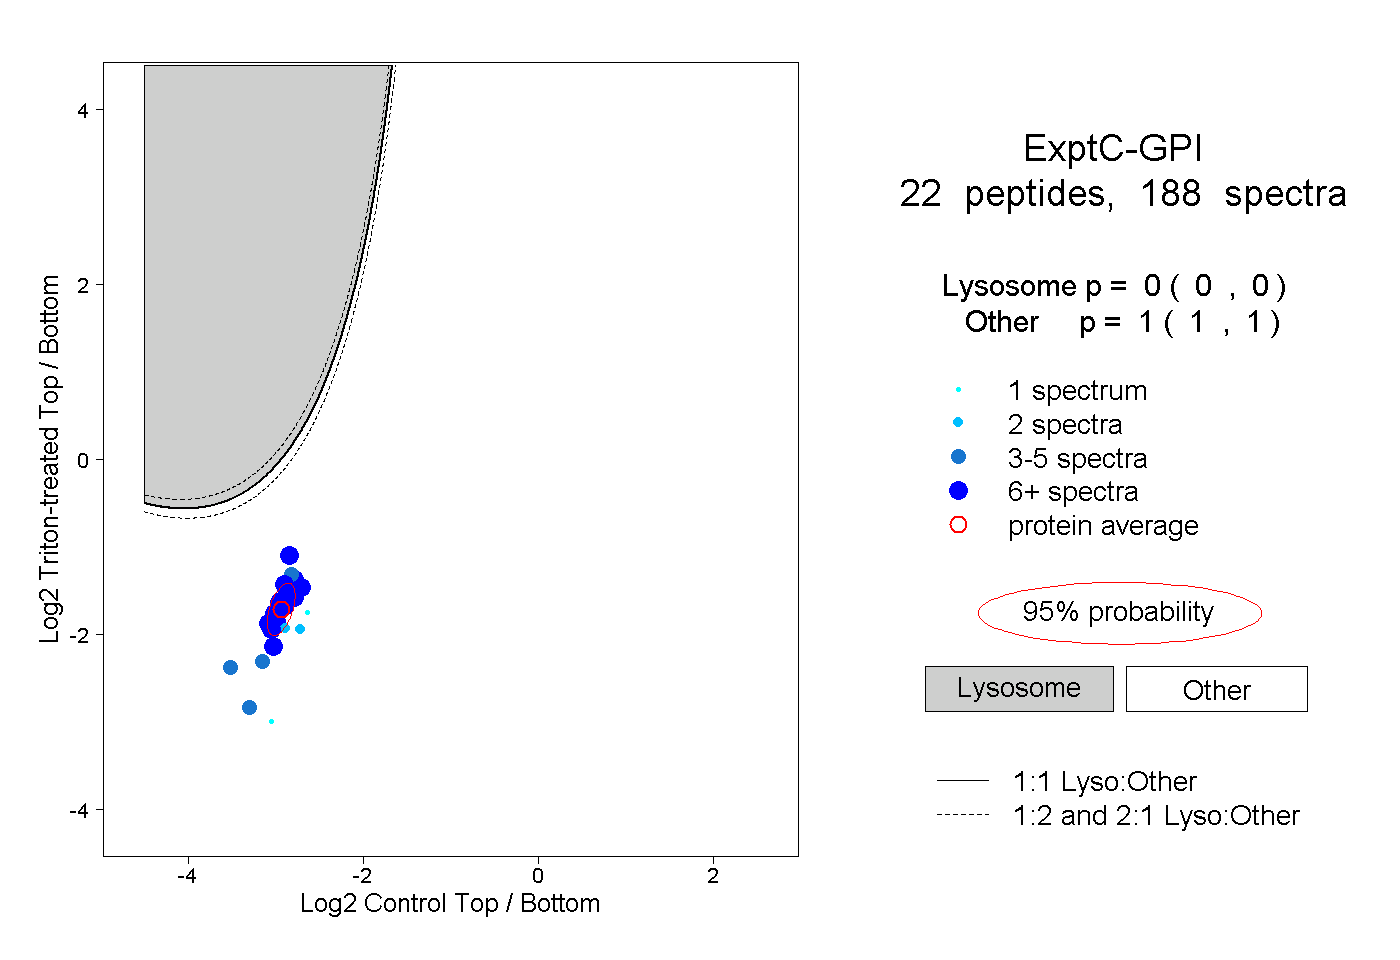
0.000 | 0.000
1.000 | 1.000
8peptides
spectra
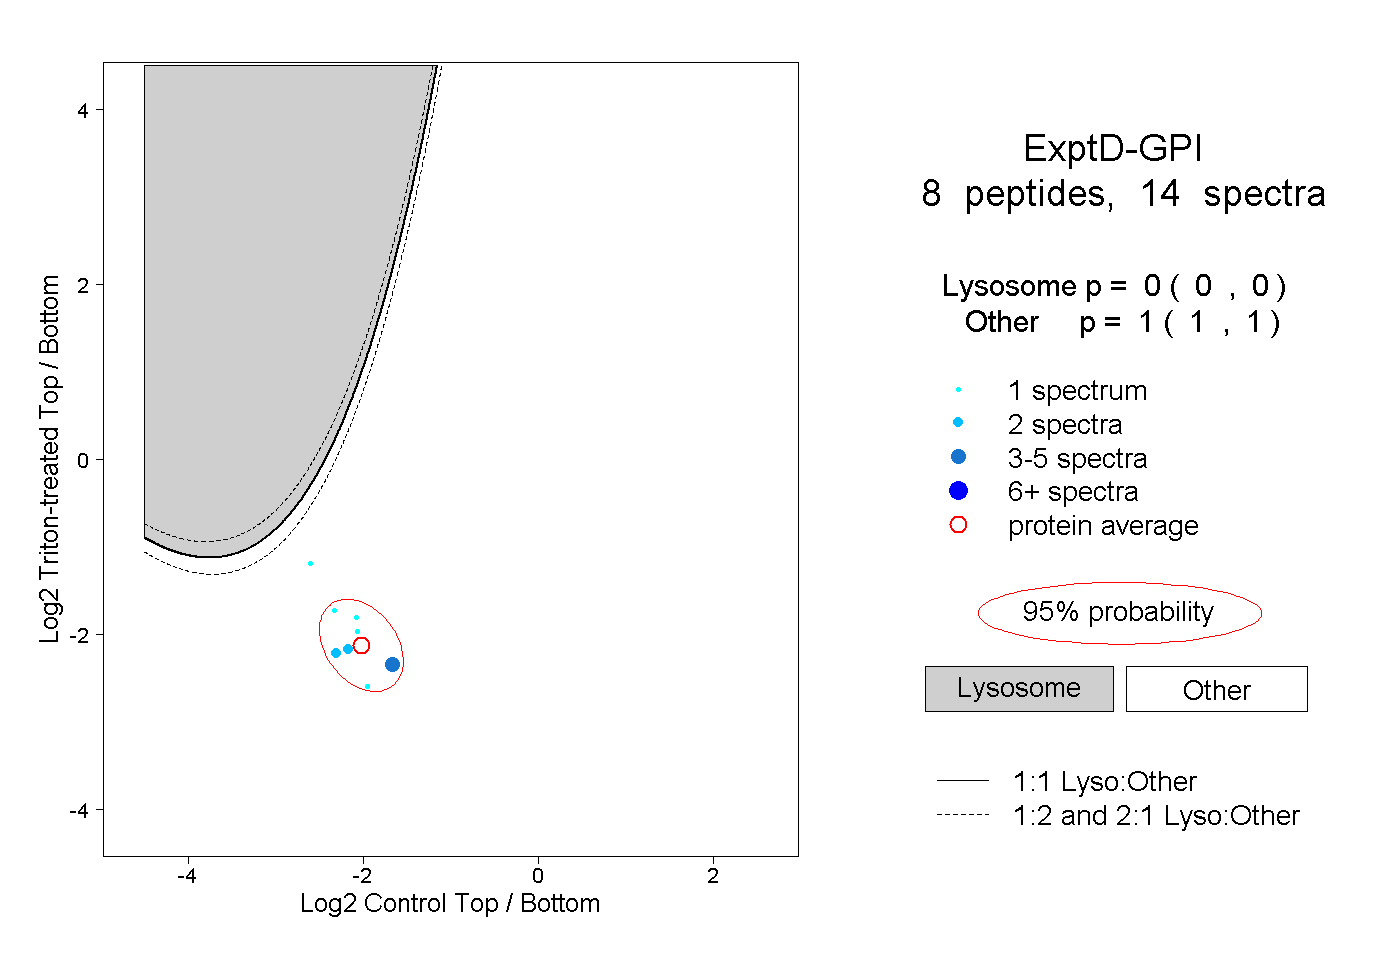
0.000 | 0.000
1.000 | 1.000