| 13 spectra, LLEWHR |
0.000 |
|
0.075 |
|
0.000 |
0.000 |
0.000 |
0.925 |
0.000 |
|
| 4 spectra, ELFEADPER |
0.000 |
|
0.000 |
|
0.000 |
0.000 |
0.000 |
1.000 |
0.000 |
|
| 12 spectra, AVLHVALR |
0.000 |
|
0.050 |
|
0.030 |
0.000 |
0.037 |
0.884 |
0.000 |
|
| 11 spectra, EVLHMLVDLAK |
0.000 |
|
0.086 |
|
0.039 |
0.000 |
0.015 |
0.860 |
0.000 |
|
| 3 spectra, VFEGNRPTNSIVFTK |
0.000 |
|
0.056 |
|
0.000 |
0.000 |
0.000 |
0.944 |
0.000 |
|
| 2 spectra, ILLANFLAQTEALMK |
0.000 |
|
0.138 |
|
0.000 |
0.000 |
0.000 |
0.862 |
0.000 |
|
| 7 spectra, MIPCDFLIPVQTQHPIR |
0.000 |
|
0.100 |
|
0.000 |
0.000 |
0.154 |
0.746 |
0.000 |
|
| 1 spectrum, INSTEDR |
0.000 |
|
0.250 |
|
0.000 |
0.067 |
0.179 |
0.503 |
0.000 |
|
| 1 spectrum, NMFEFWDWVGGR |
0.000 |
|
0.000 |
|
0.000 |
0.000 |
0.000 |
0.983 |
0.017 |
|
| 2 spectra, FAAYFQQGDMESNGK |
0.000 |
|
0.019 |
|
0.070 |
0.000 |
0.000 |
0.911 |
0.000 |
|
| 1 spectrum, EWFLQAAK |
0.000 |
|
0.000 |
|
0.000 |
0.000 |
0.000 |
1.000 |
0.000 |
|
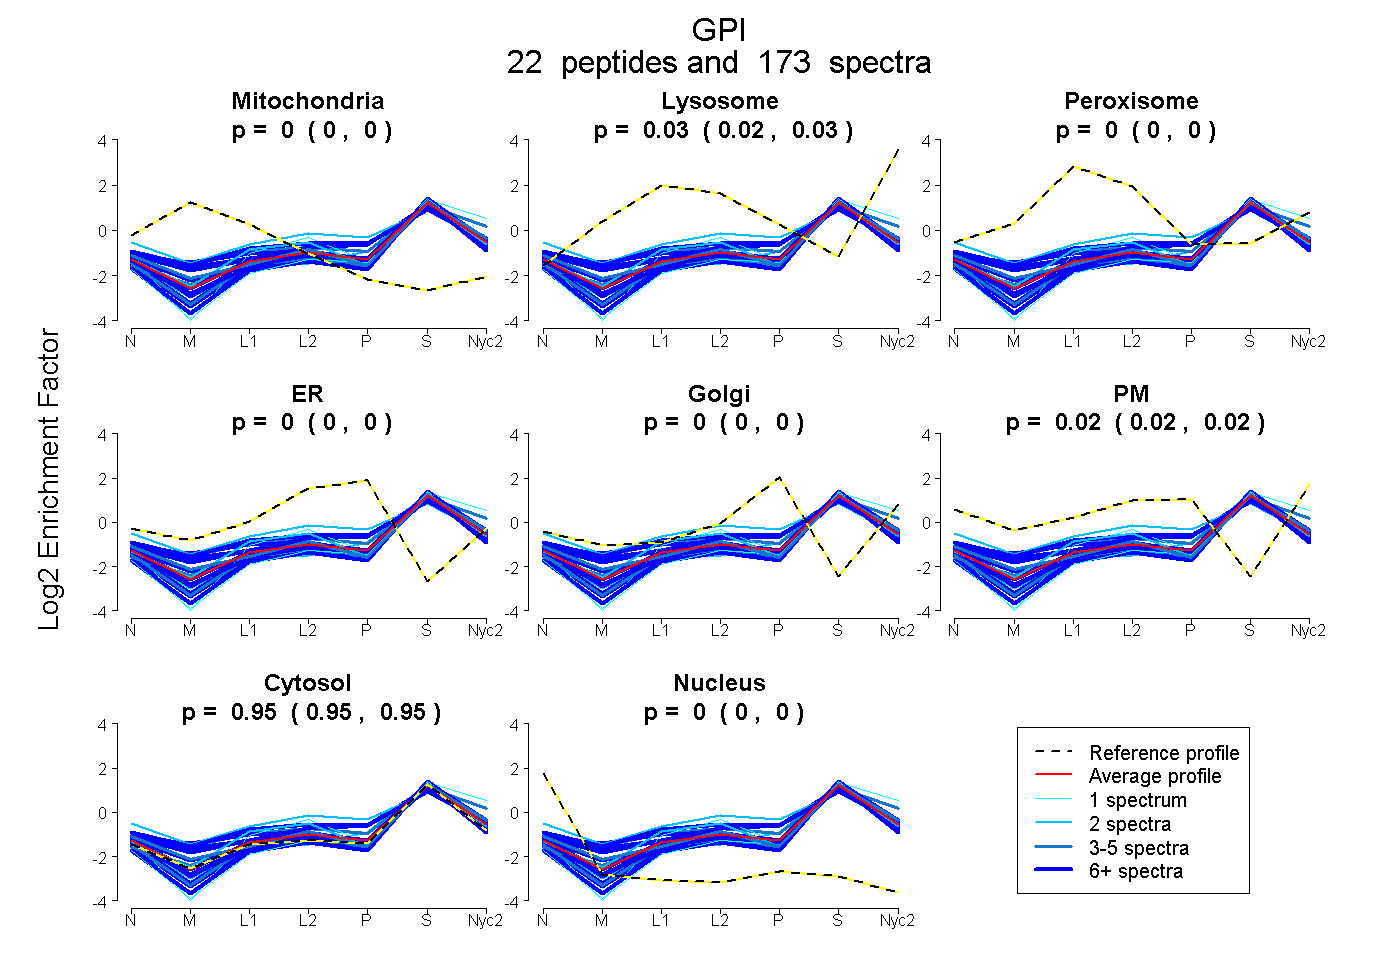
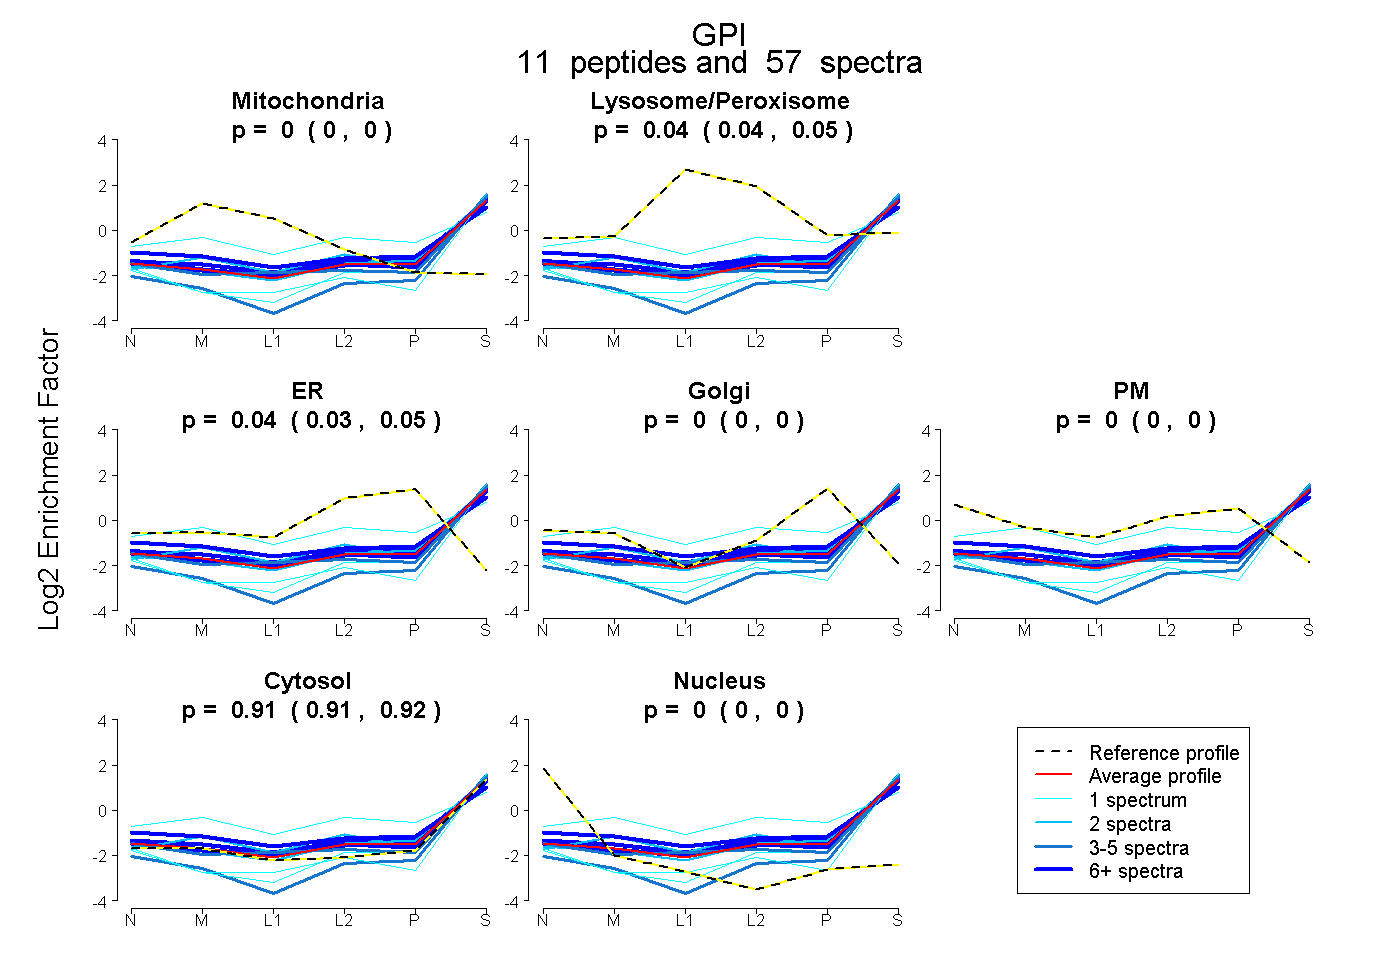
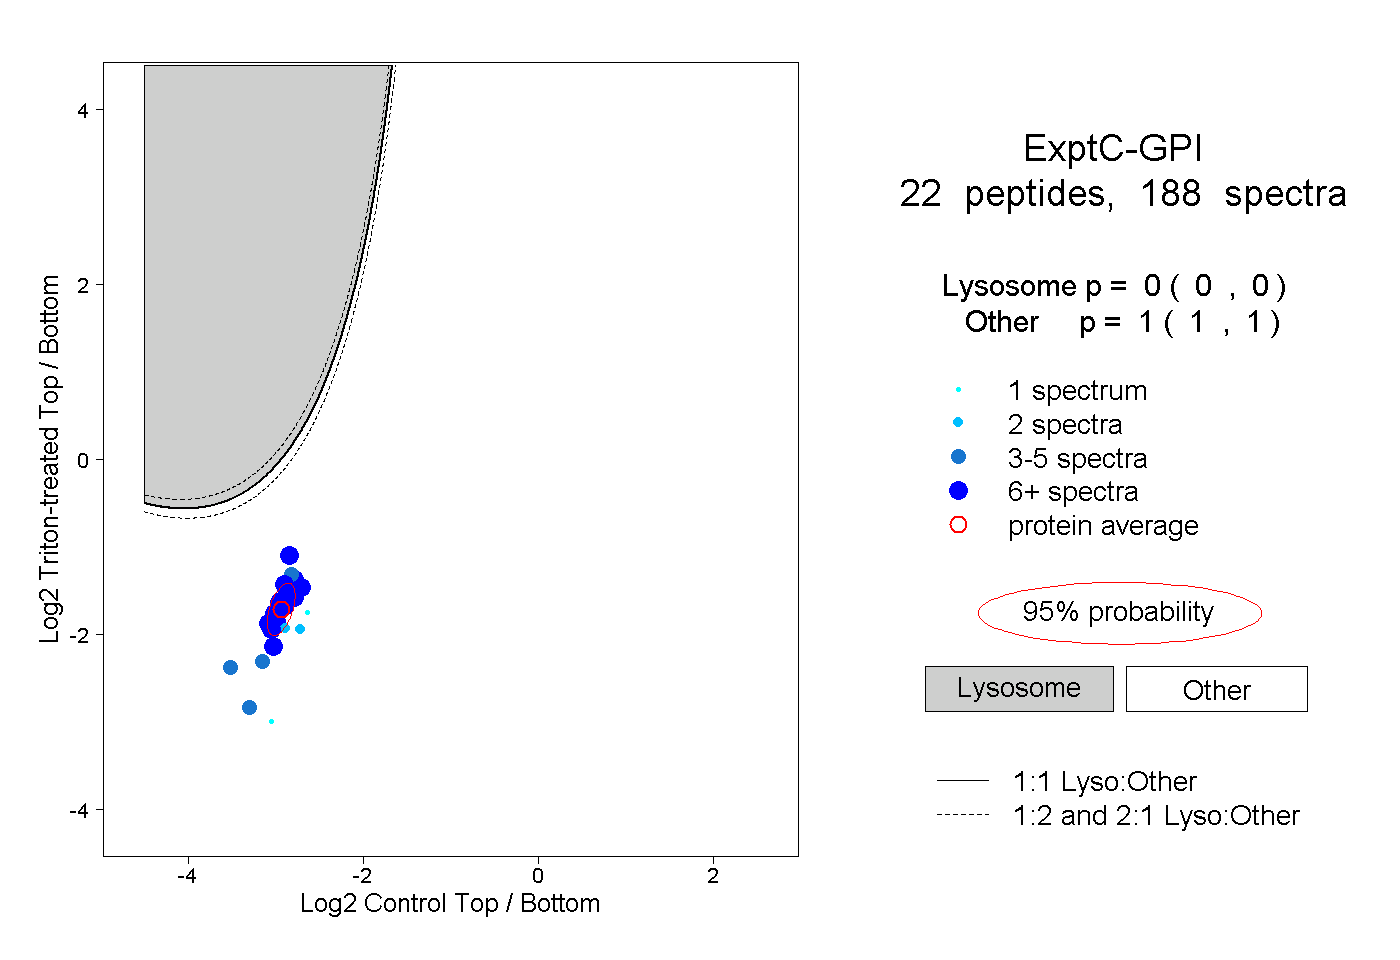
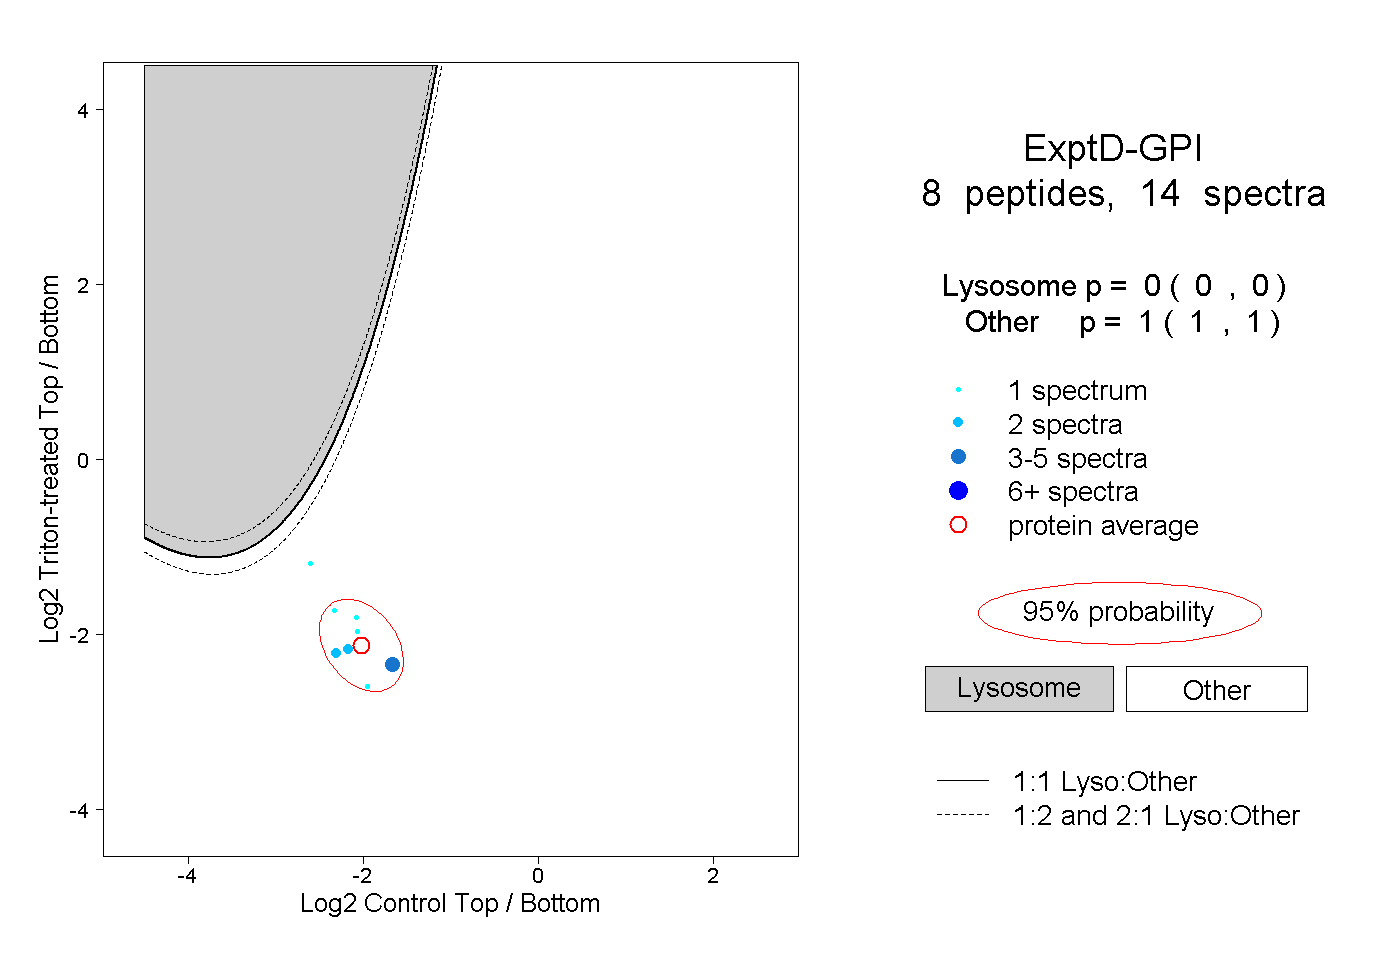
 22
22