 22
22peptides
spectra
0.000 | 0.000
0.024 | 0.029
0.000 | 0.000
0.000 | 0.000
0.000 | 0.000
0.020 | 0.024
0.949 | 0.952
0.000 | 0.000
| Plot | Mito | Lyso | Perox | ER | Golgi | PM | Cytosol | Nucleus | |||||
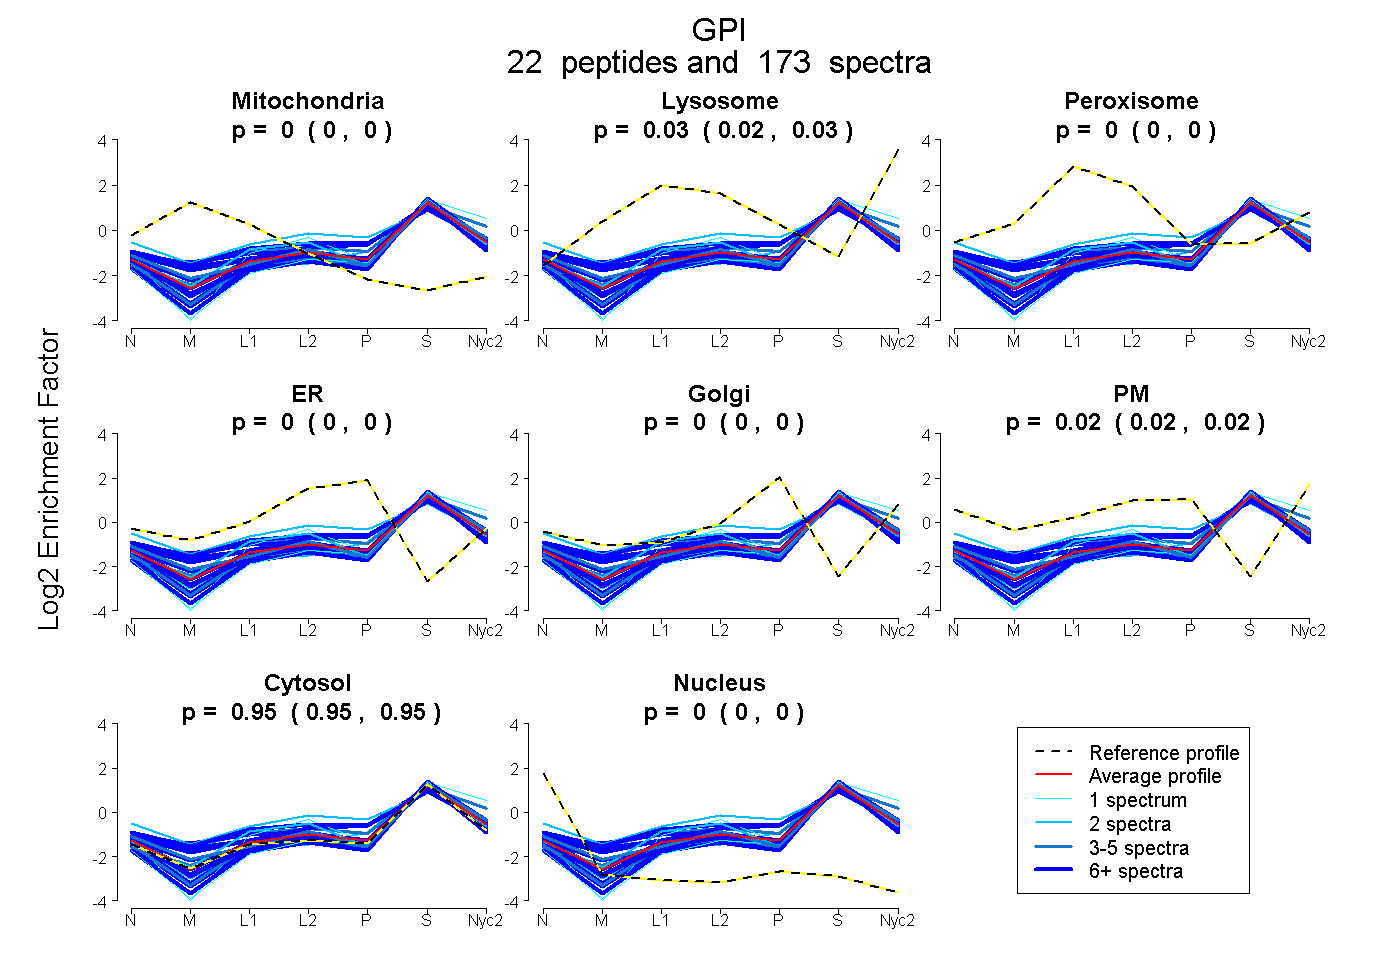
| Expt A |
22 peptides |
173 spectra |
|
0.000 0.000 | 0.000 |
0.027 0.024 | 0.029 |
0.000 0.000 | 0.000 |
0.000 0.000 | 0.000 |
0.000 0.000 | 0.000 |
0.022 0.020 | 0.024 |
0.951 0.949 | 0.952 |
0.000 0.000 | 0.000 |
| 20 spectra, LLEWHR | 0.000 | 0.000 | 0.000 | 0.007 | 0.000 | 0.004 | 0.988 | 0.000 | ||
| 6 spectra, DVMPEVNK | 0.053 | 0.090 | 0.000 | 0.000 | 0.000 | 0.014 | 0.842 | 0.000 | ||
| 7 spectra, DPSAVAK | 0.000 | 0.025 | 0.049 | 0.000 | 0.116 | 0.012 | 0.799 | 0.000 | ||
| 1 spectrum, SPEEAR | 0.000 | 0.000 | 0.000 | 0.000 | 0.000 | 0.000 | 1.000 | 0.000 | ||
| 9 spectra, NPEFQK | 0.035 | 0.000 | 0.000 | 0.001 | 0.000 | 0.011 | 0.953 | 0.000 | ||
| 4 spectra, GVEAAR | 0.000 | 0.000 | 0.000 | 0.000 | 0.000 | 0.000 | 1.000 | 0.000 | ||
| 5 spectra, DNMFSGLK | 0.000 | 0.194 | 0.000 | 0.000 | 0.000 | 0.017 | 0.790 | 0.000 | ||
| 9 spectra, ELQAAGK | 0.088 | 0.000 | 0.104 | 0.000 | 0.000 | 0.000 | 0.807 | 0.000 | ||
| 9 spectra, SPEELEK | 0.000 | 0.042 | 0.000 | 0.000 | 0.000 | 0.015 | 0.943 | 0.000 | ||
| 3 spectra, VFEGNRPTNSIVFTK | 0.000 | 0.058 | 0.000 | 0.000 | 0.000 | 0.015 | 0.922 | 0.005 | ||
| 2 spectra, TLANLNPESSLFIIASK | 0.000 | 0.000 | 0.123 | 0.000 | 0.000 | 0.000 | 0.877 | 0.000 | ||
| 1 spectrum, FAAYFQQGDMESNGK | 0.000 | 0.099 | 0.000 | 0.000 | 0.000 | 0.000 | 0.901 | 0.000 | ||
| 6 spectra, EFGIDPK | 0.000 | 0.000 | 0.000 | 0.000 | 0.000 | 0.000 | 1.000 | 0.000 | ||
| 8 spectra, EWFLQAAK | 0.000 | 0.000 | 0.000 | 0.000 | 0.000 | 0.000 | 1.000 | 0.000 | ||
| 18 spectra, ELFEADPER | 0.000 | 0.000 | 0.000 | 0.000 | 0.000 | 0.000 | 0.993 | 0.007 | ||
| 24 spectra, AVLHVALR | 0.000 | 0.000 | 0.000 | 0.019 | 0.000 | 0.000 | 0.972 | 0.009 | ||
| 16 spectra, EVLHMLVDLAK | 0.000 | 0.000 | 0.000 | 0.000 | 0.000 | 0.000 | 1.000 | 0.000 | ||
| 10 spectra, MIPCDFLIPVQTQHPIR | 0.000 | 0.000 | 0.170 | 0.000 | 0.115 | 0.000 | 0.716 | 0.000 | ||
| 2 spectra, INSTEDR | 0.000 | 0.000 | 0.159 | 0.147 | 0.000 | 0.035 | 0.658 | 0.000 | ||
| 6 spectra, NMFEFWDWVGGR | 0.000 | 0.000 | 0.000 | 0.000 | 0.000 | 0.000 | 1.000 | 0.000 | ||
| 5 spectra, HFVALSTNTDK | 0.000 | 0.054 | 0.000 | 0.000 | 0.000 | 0.000 | 0.946 | 0.000 | ||
| 2 spectra, ANSANLK | 0.000 | 0.000 | 0.000 | 0.000 | 0.016 | 0.000 | 0.984 | 0.000 |
| Plot | Mito | Lyso or Perox | ER | Golgi | PM | Cytosol | Nucleus | ||||||
| Expt B |
11 peptides |
57 spectra |
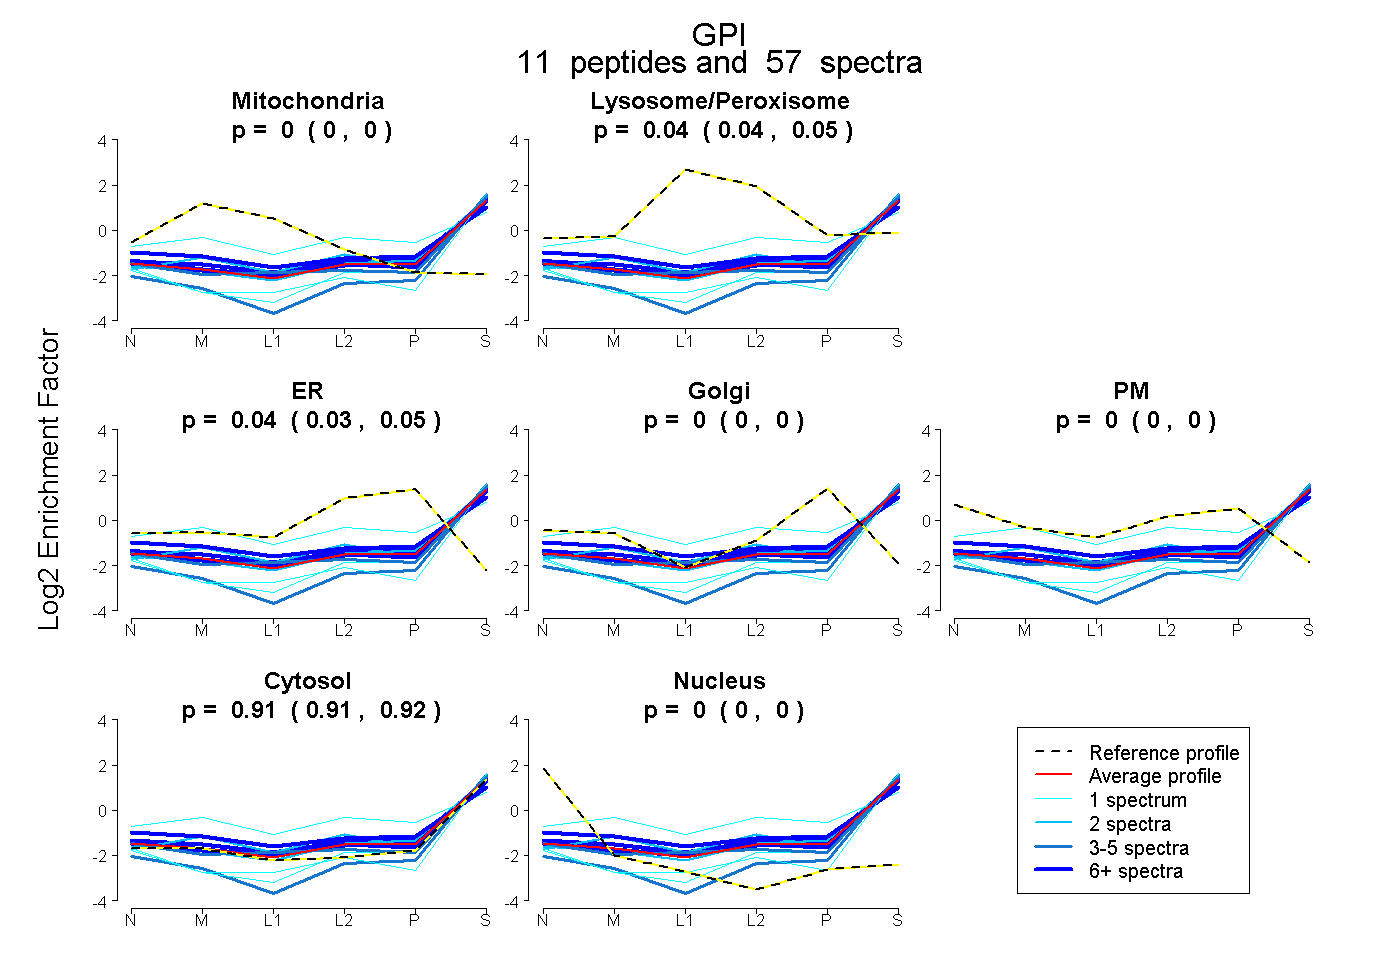 |
0.000 0.000 | 0.000 |
0.045 0.035 | 0.052 |
0.042 0.034 | 0.049 |
0.000 0.000 | 0.000 |
0.000 0.000 | 0.001 |
0.913 0.908 | 0.917 |
0.000 0.000 | 0.000 |
|||
| Plot | Lyso | Other | |||||||||||
| Expt C |
22 peptides |
188 spectra |
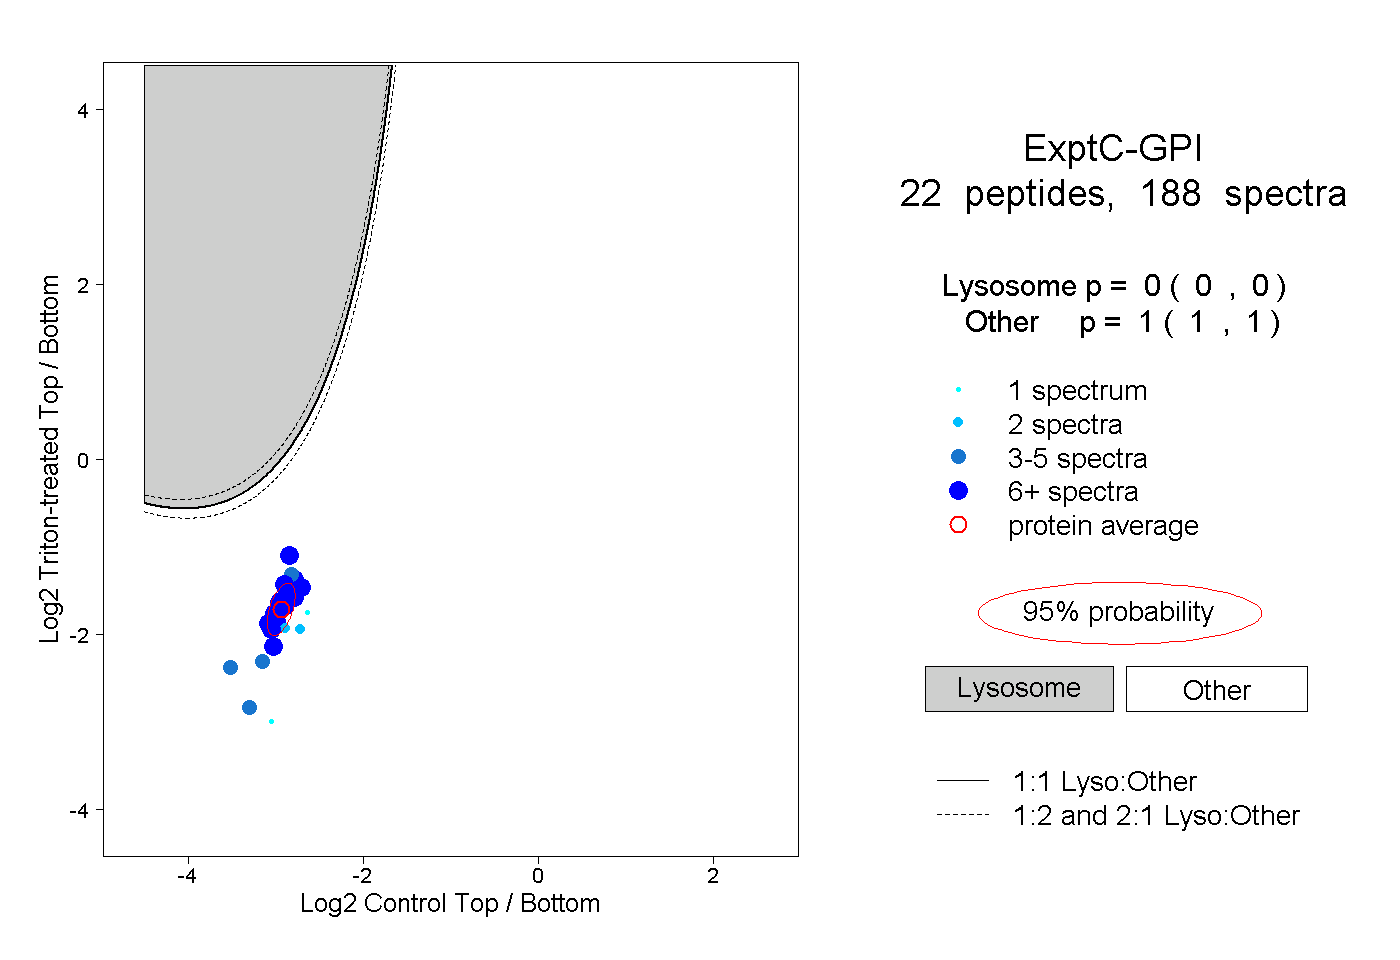 |
0.000 0.000 | 0.000 |
1.000 1.000 | 1.000 |
||||||||
| Plot | Lyso | Other | |||||||||||
| Expt D |
8 peptides |
14 spectra |
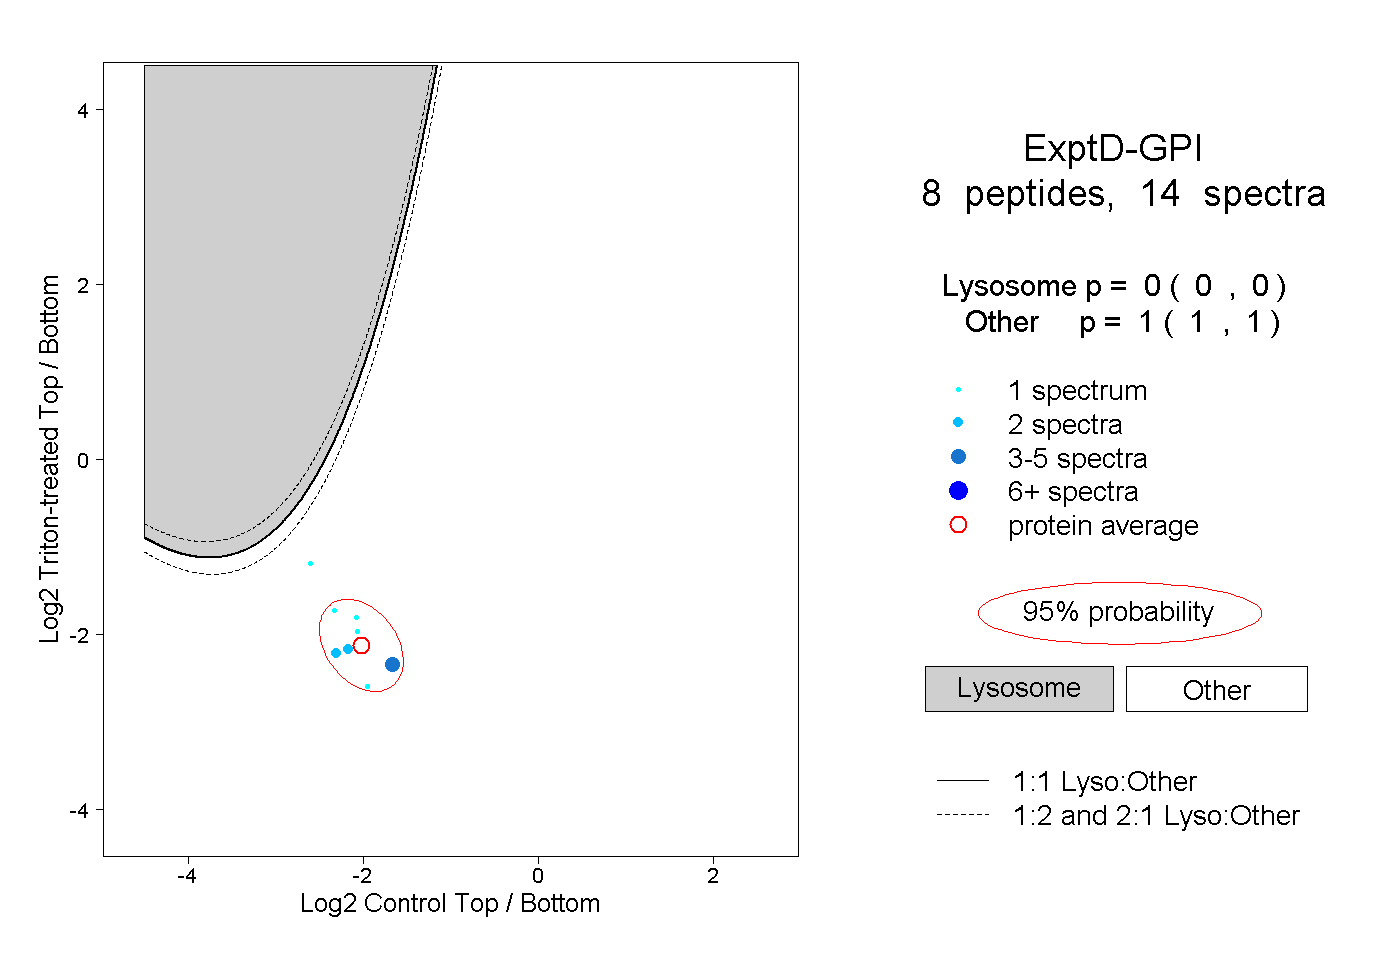 |
0.000 0.000 | 0.000 |
1.000 1.000 | 1.000 |