 8
8peptides
spectra
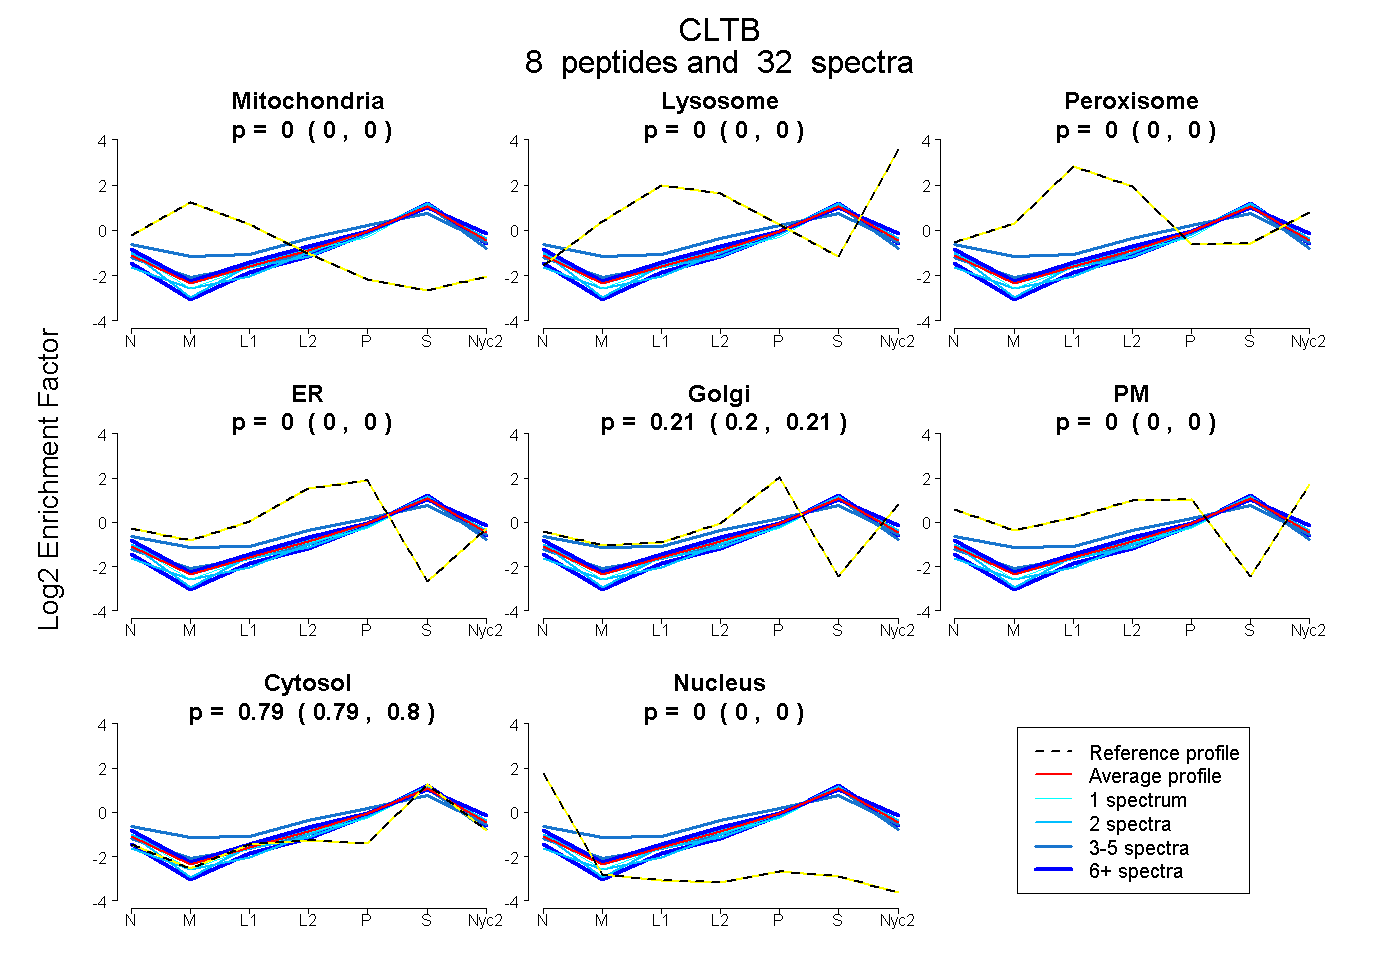
0.000 | 0.000
0.000 | 0.000
0.000 | 0.000
0.000 | 0.000
0.201 | 0.210
0.000 | 0.000
0.789 | 0.798
0.000 | 0.000
6peptides
spectra
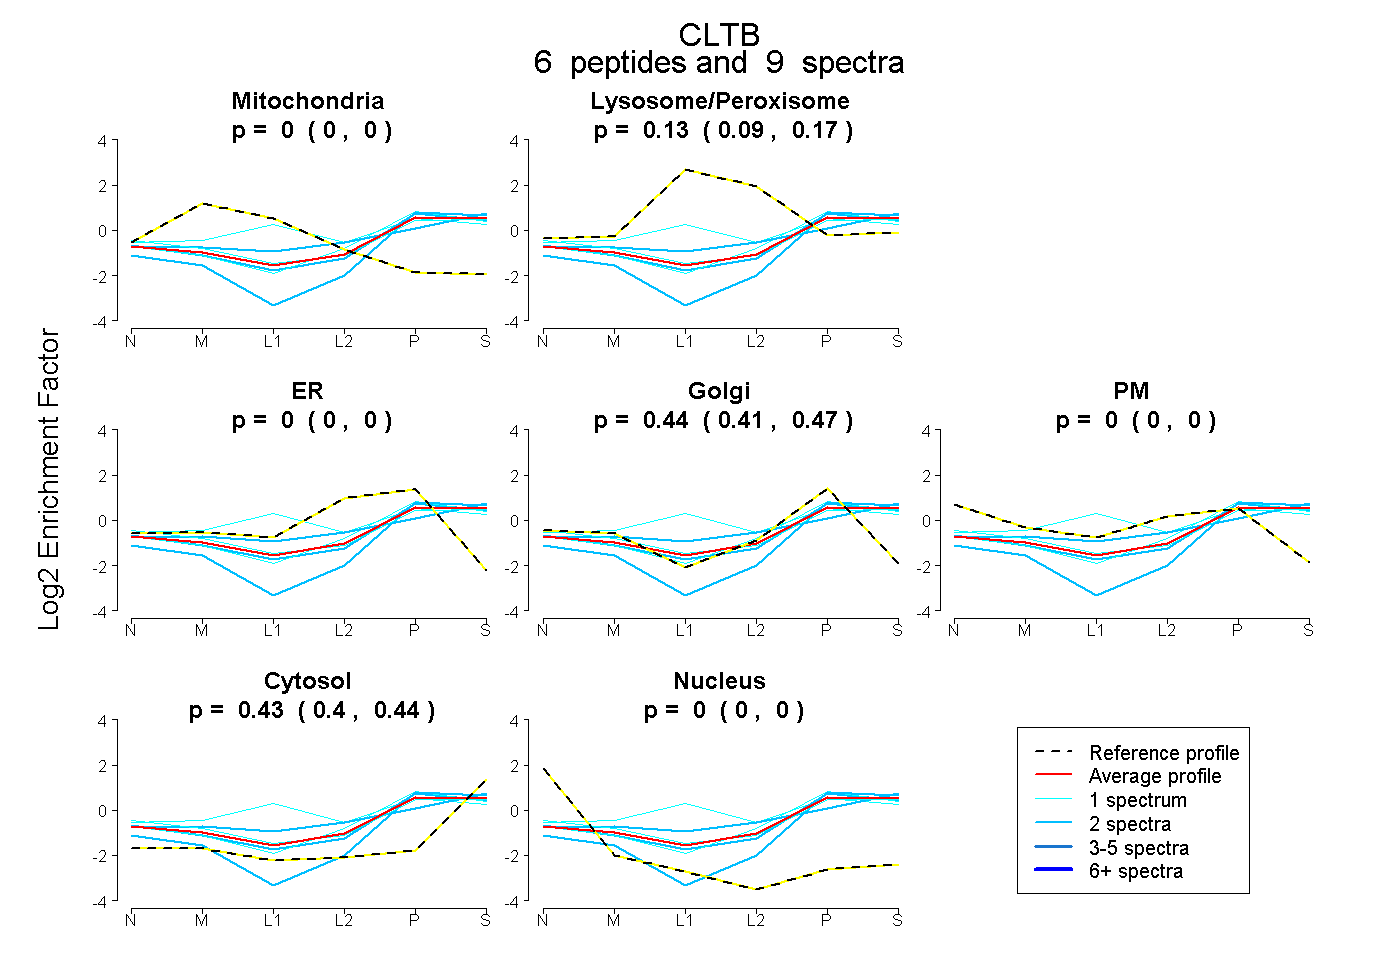
0.000 | 0.000
0.086 | 0.172
0.000 | 0.000
0.408 | 0.471
0.000 | 0.000
0.403 | 0.443
0.000 | 0.000
9peptides
spectra
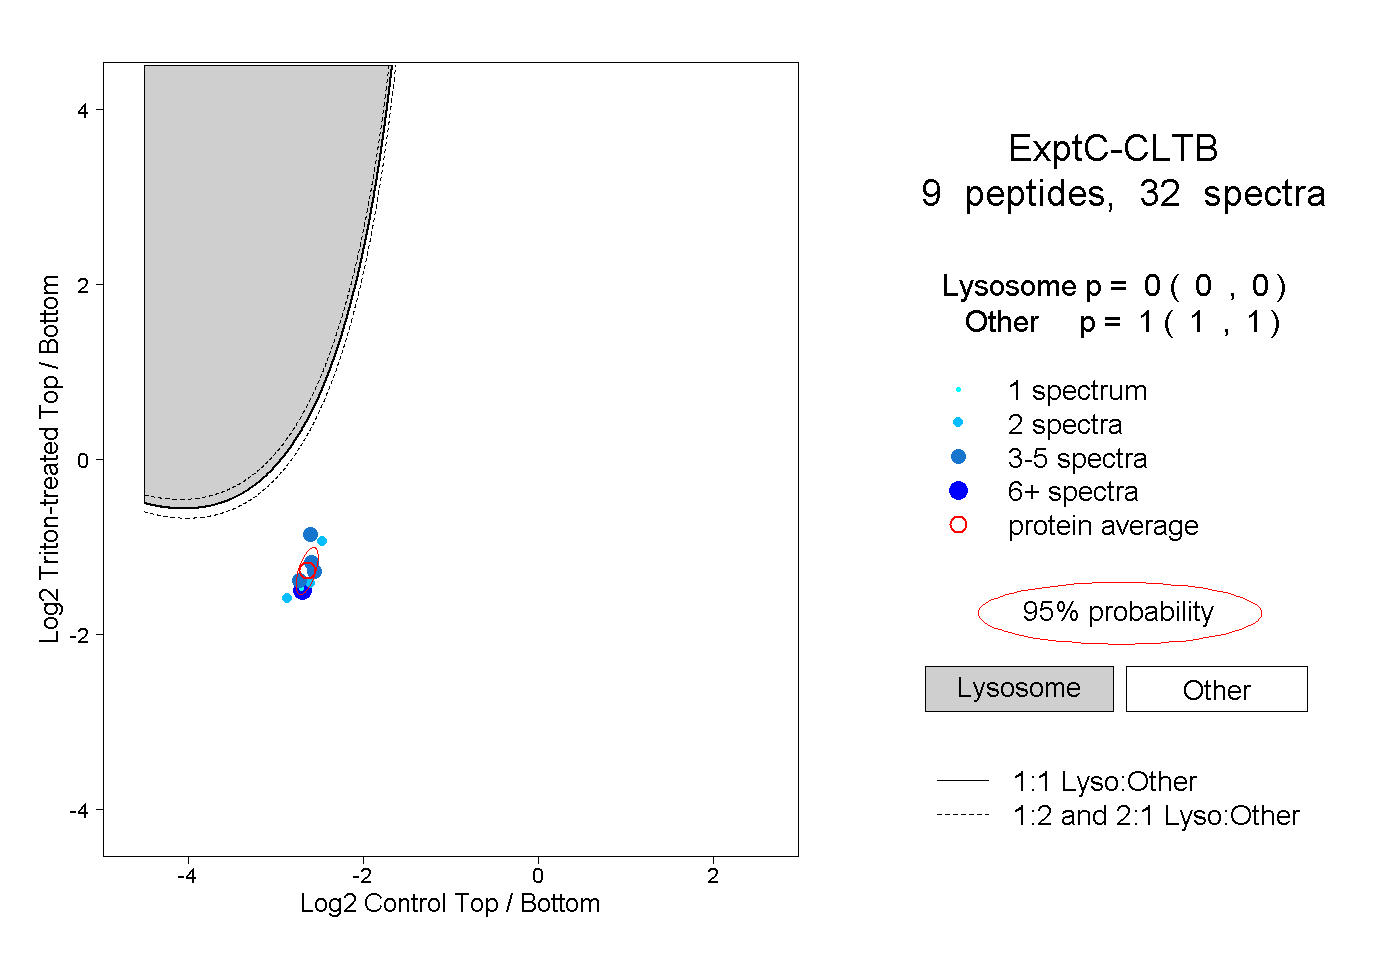
0.000 | 0.000
1.000 | 1.000
4peptides
spectra
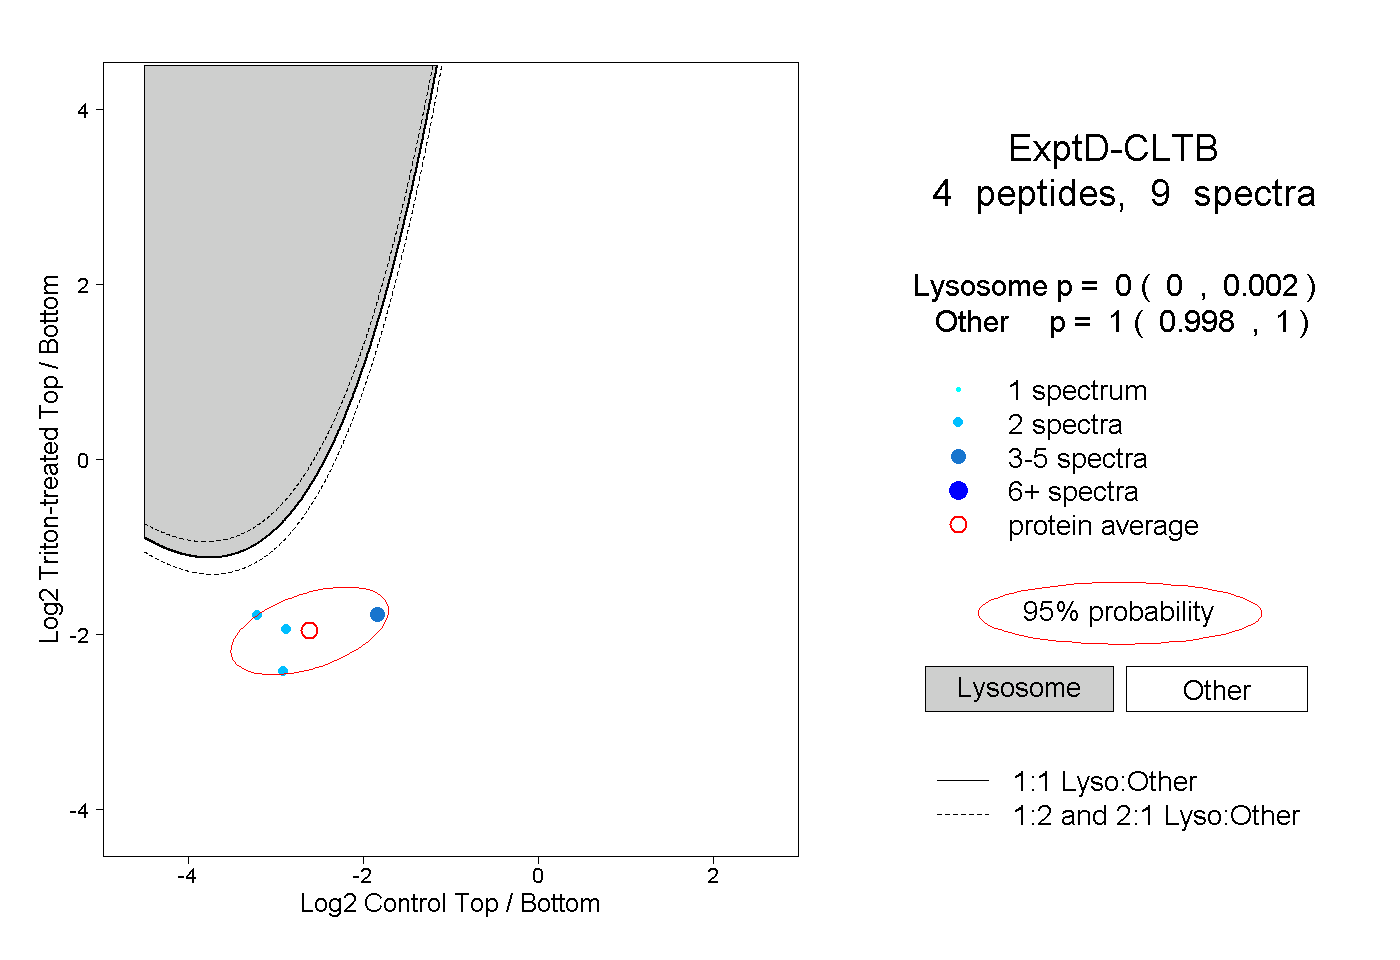
0.000 | 0.002
0.998 | 1.000