 8
8peptides
spectra
0.000 | 0.000
0.000 | 0.000
0.000 | 0.000
0.000 | 0.000
0.201 | 0.210
0.000 | 0.000
0.789 | 0.798
0.000 | 0.000
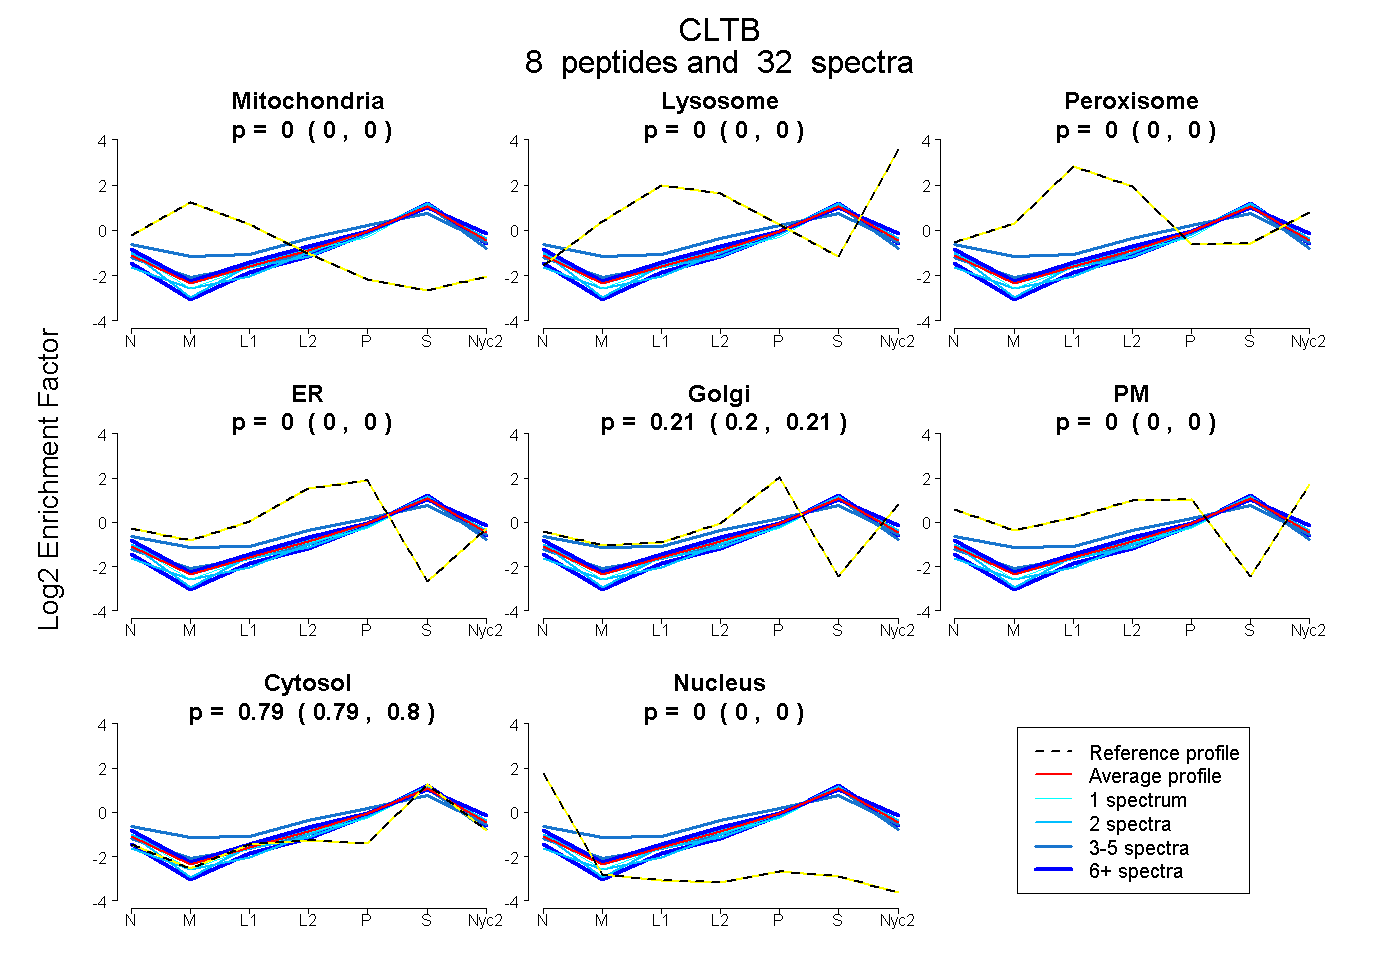
| Plot | Mito | Lyso | Perox | ER | Golgi | PM | Cytosol | Nucleus | |||||
| Expt A |
8 peptides |
32 spectra |
|
0.000 0.000 | 0.000 |
0.000 0.000 | 0.000 |
0.000 0.000 | 0.000 |
0.000 0.000 | 0.000 |
0.206 0.201 | 0.210 |
0.000 0.000 | 0.000 |
0.794 0.789 | 0.798 |
0.000 0.000 | 0.000 |
| 2 spectra, EETPGTEWEK | 0.000 | 0.000 | 0.000 | 0.000 | 0.156 | 0.000 | 0.844 | 0.000 | ||
| 2 spectra, QSEQVEK | 0.000 | 0.000 | 0.000 | 0.000 | 0.193 | 0.000 | 0.807 | 0.000 | ||
| 11 spectra, VTEQEWR | 0.000 | 0.006 | 0.000 | 0.000 | 0.218 | 0.024 | 0.752 | 0.000 | ||
| 5 spectra, ASEEAFVK | 0.000 | 0.000 | 0.000 | 0.000 | 0.192 | 0.000 | 0.808 | 0.000 | ||
| 6 spectra, DLEEWNQR | 0.000 | 0.000 | 0.000 | 0.000 | 0.122 | 0.000 | 0.878 | 0.000 | ||
| 3 spectra, SVLMSLK | 0.000 | 0.000 | 0.084 | 0.131 | 0.166 | 0.000 | 0.620 | 0.000 | ||
| 2 spectra, LQELDAASK | 0.000 | 0.000 | 0.000 | 0.000 | 0.189 | 0.000 | 0.811 | 0.000 | ||
| 1 spectrum, LTQEPESIR | 0.000 | 0.000 | 0.000 | 0.000 | 0.162 | 0.000 | 0.838 | 0.000 |
| Plot | Mito | Lyso or Perox | ER | Golgi | PM | Cytosol | Nucleus | ||||||
| Expt B |
6 peptides |
9 spectra |
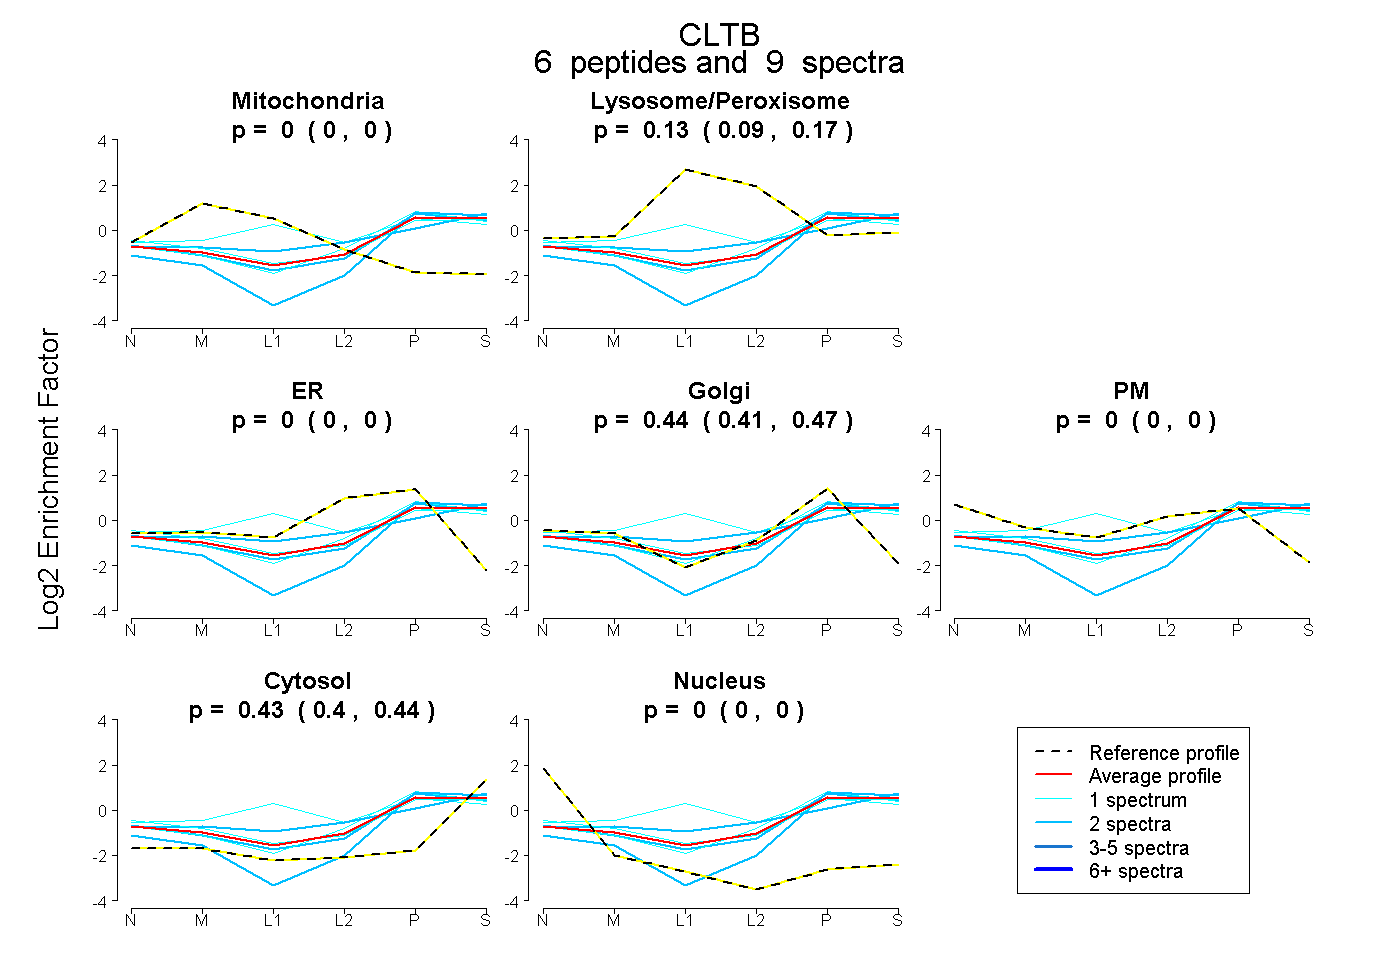 |
0.000 0.000 | 0.000 |
0.131 0.086 | 0.172 |
0.000 0.000 | 0.000 |
0.443 0.408 | 0.471 |
0.000 0.000 | 0.000 |
0.426 0.403 | 0.443 |
0.000 0.000 | 0.000 |
|||
| Plot | Lyso | Other | |||||||||||
| Expt C |
9 peptides |
32 spectra |
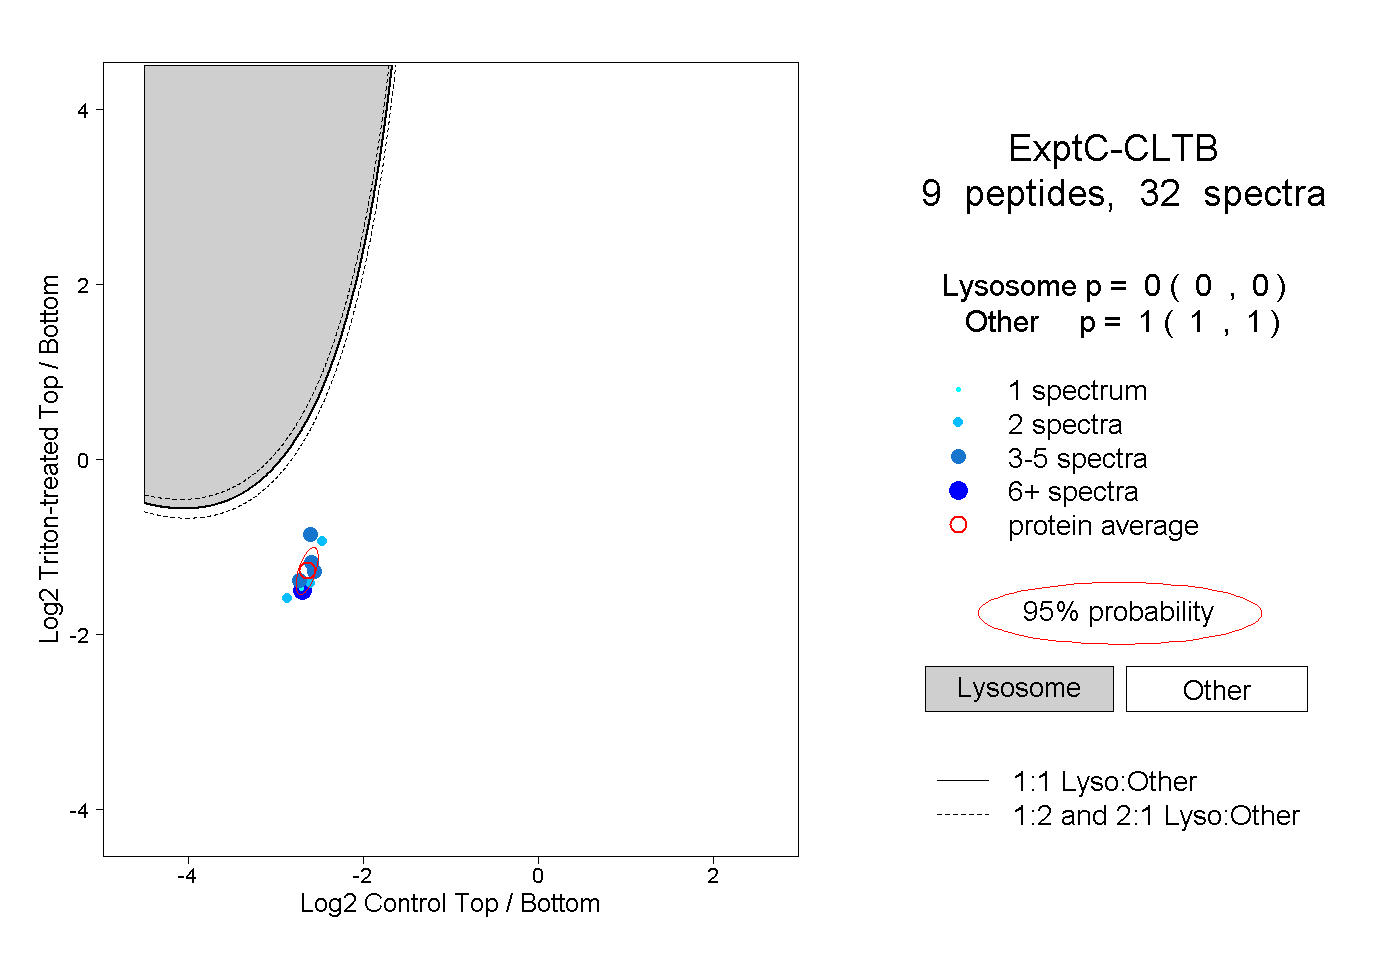 |
0.000 0.000 | 0.000 |
1.000 1.000 | 1.000 |
||||||||
| Plot | Lyso | Other | |||||||||||
| Expt D |
4 peptides |
9 spectra |
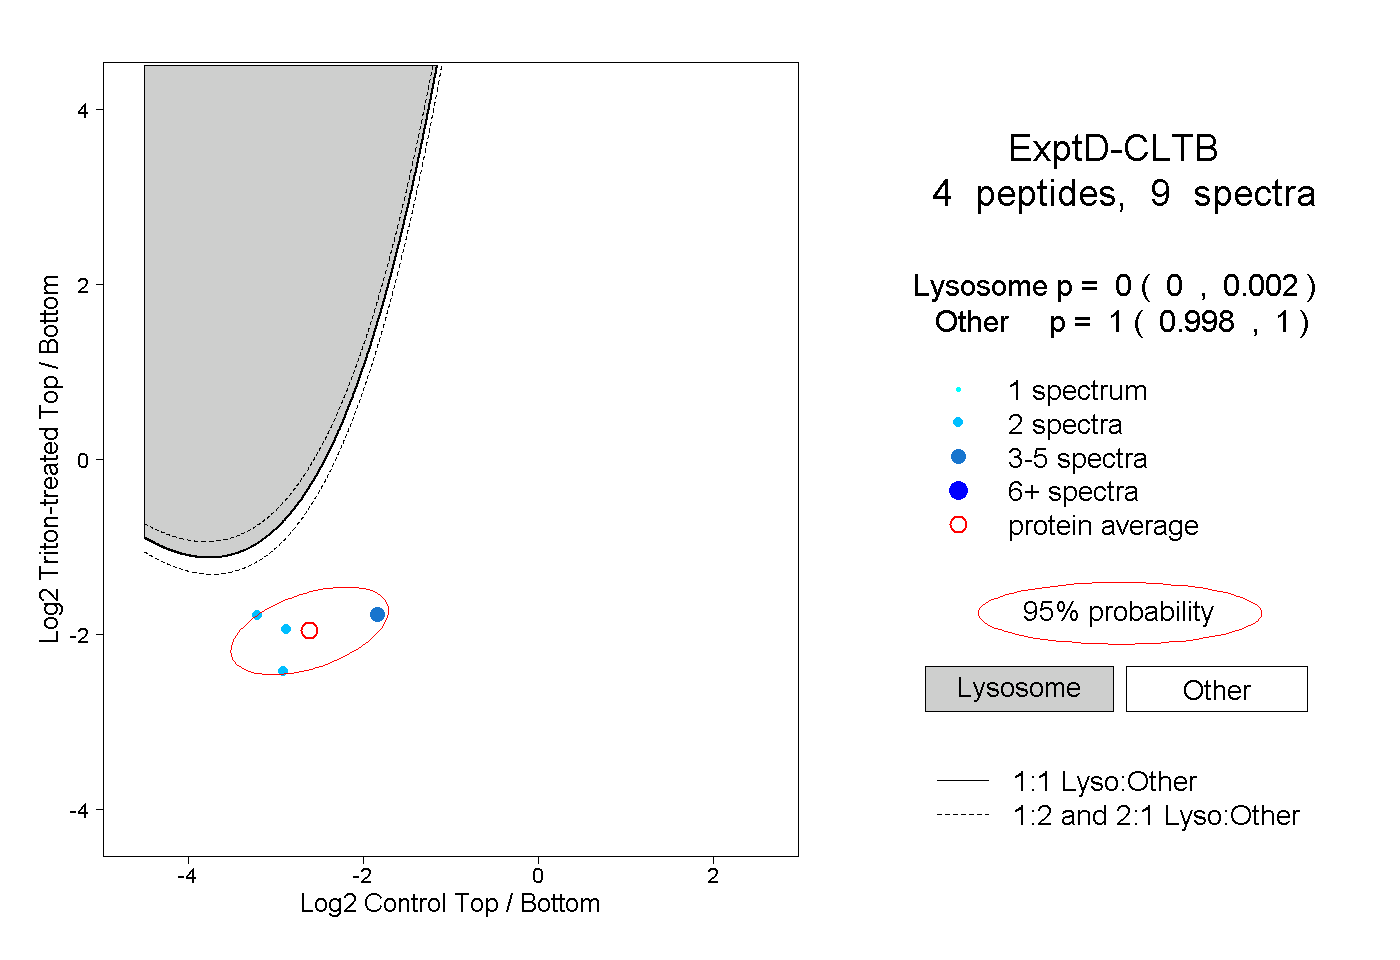 |
0.000 0.000 | 0.002 |
1.000 0.998 | 1.000 |