CLTB
[ENSRNOP00000028993]
Main page
| | | Plot |
Mito |
Lyso |
|
Perox |
ER |
Golgi |
PM |
Cytosol |
Nucleus |
|
| Expt A |
 8
8
peptides |
32
spectra |
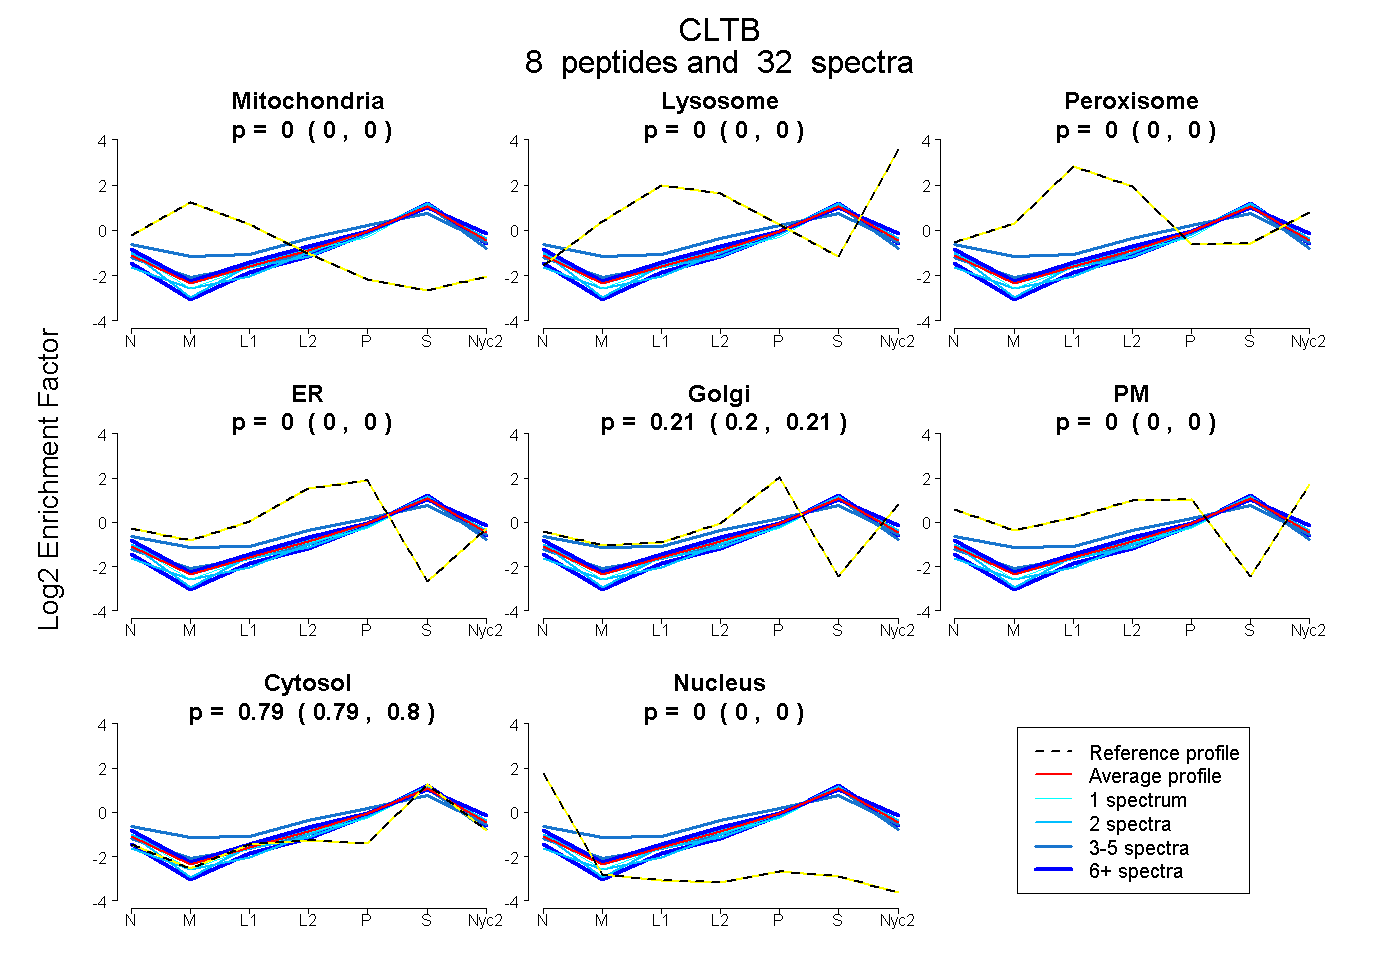 |
0.000
0.000 | 0.000 |
0.000
0.000 | 0.000 |
|
0.000
0.000 | 0.000 |
0.000
0.000 | 0.000 |
0.206
0.201 | 0.210 |
0.000
0.000 | 0.000 |
0.794
0.789 | 0.798 |
0.000
0.000 | 0.000 |
|
| | | Plot |
Mito |
|
Lyso or Perox |
|
ER |
Golgi |
PM |
Cytosol |
Nucleus |
|
| Expt B |
6
peptides |
9
spectra |
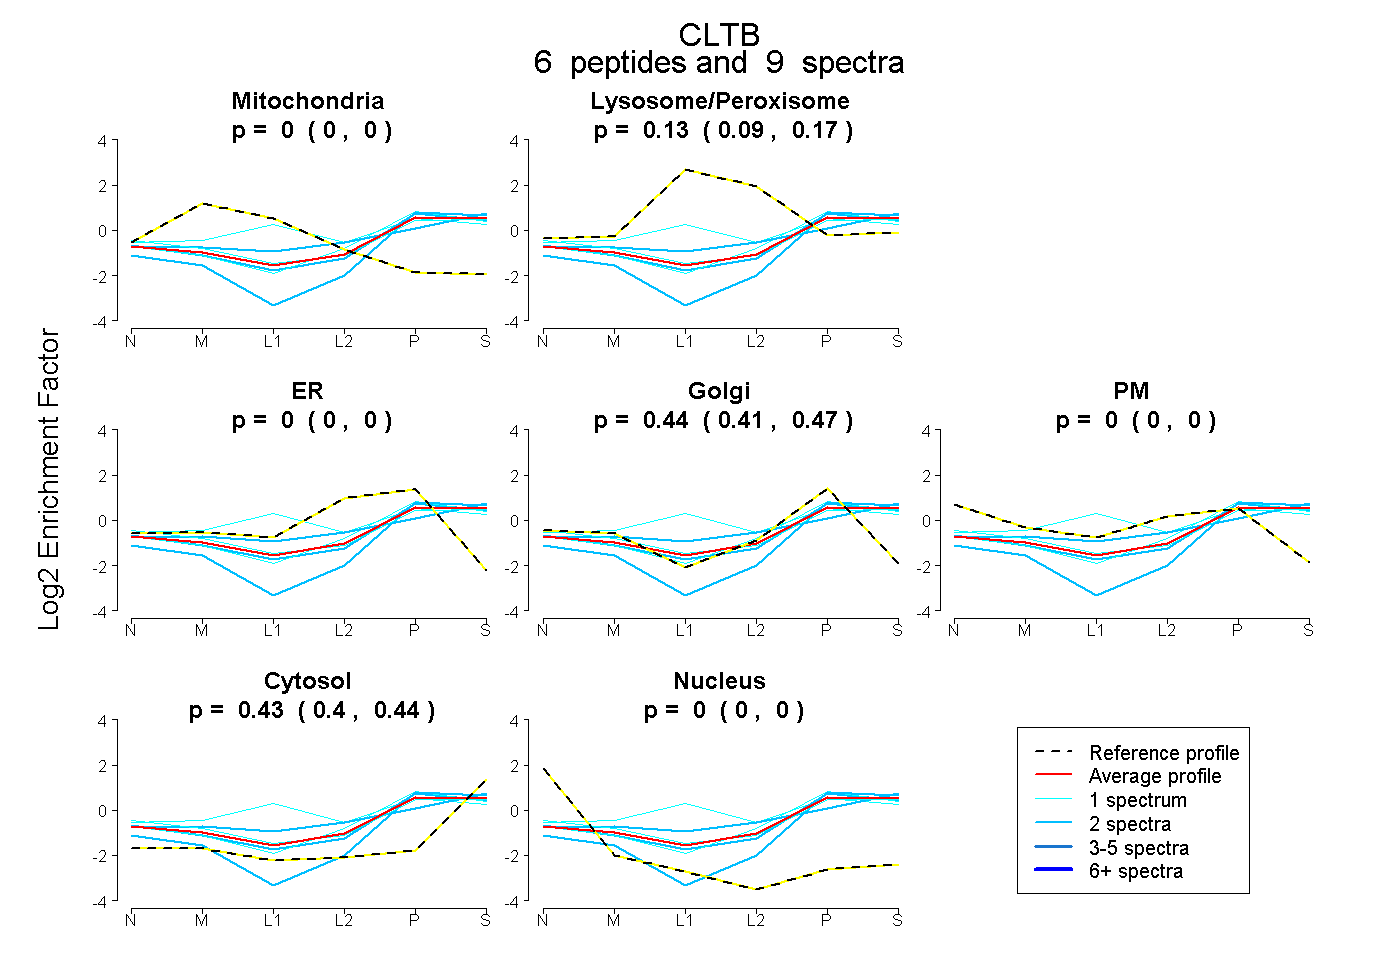 |
0.000
0.000 | 0.000 |
|
0.131
0.086 | 0.172 |
|
0.000
0.000 | 0.000 |
0.443
0.408 | 0.471 |
0.000
0.000 | 0.000 |
0.426
0.403 | 0.443 |
0.000
0.000 | 0.000 |
|
| 2 spectra, LTQEPESIR |
0.000 |
|
0.000 |
|
0.000 |
0.448 |
0.000 |
0.552 |
0.000 |
|
| 1 spectrum, VTEQEWR |
0.000 |
|
0.148 |
|
0.000 |
0.439 |
0.000 |
0.413 |
0.000 |
|
| 1 spectrum, ASEEAFVK |
0.000 |
|
0.434 |
|
0.000 |
0.310 |
0.000 |
0.256 |
0.000 |
|
| 2 spectra, DLEEWNQR |
0.000 |
|
0.082 |
|
0.000 |
0.502 |
0.000 |
0.417 |
0.000 |
|
| 2 spectra, VAQLCDFNPK |
0.000 |
|
0.282 |
|
0.000 |
0.276 |
0.000 |
0.442 |
0.000 |
|
| 1 spectrum, LQELDAASK |
0.000 |
|
0.094 |
|
0.000 |
0.528 |
0.000 |
0.378 |
0.000 |
|
| | | Plot |
|
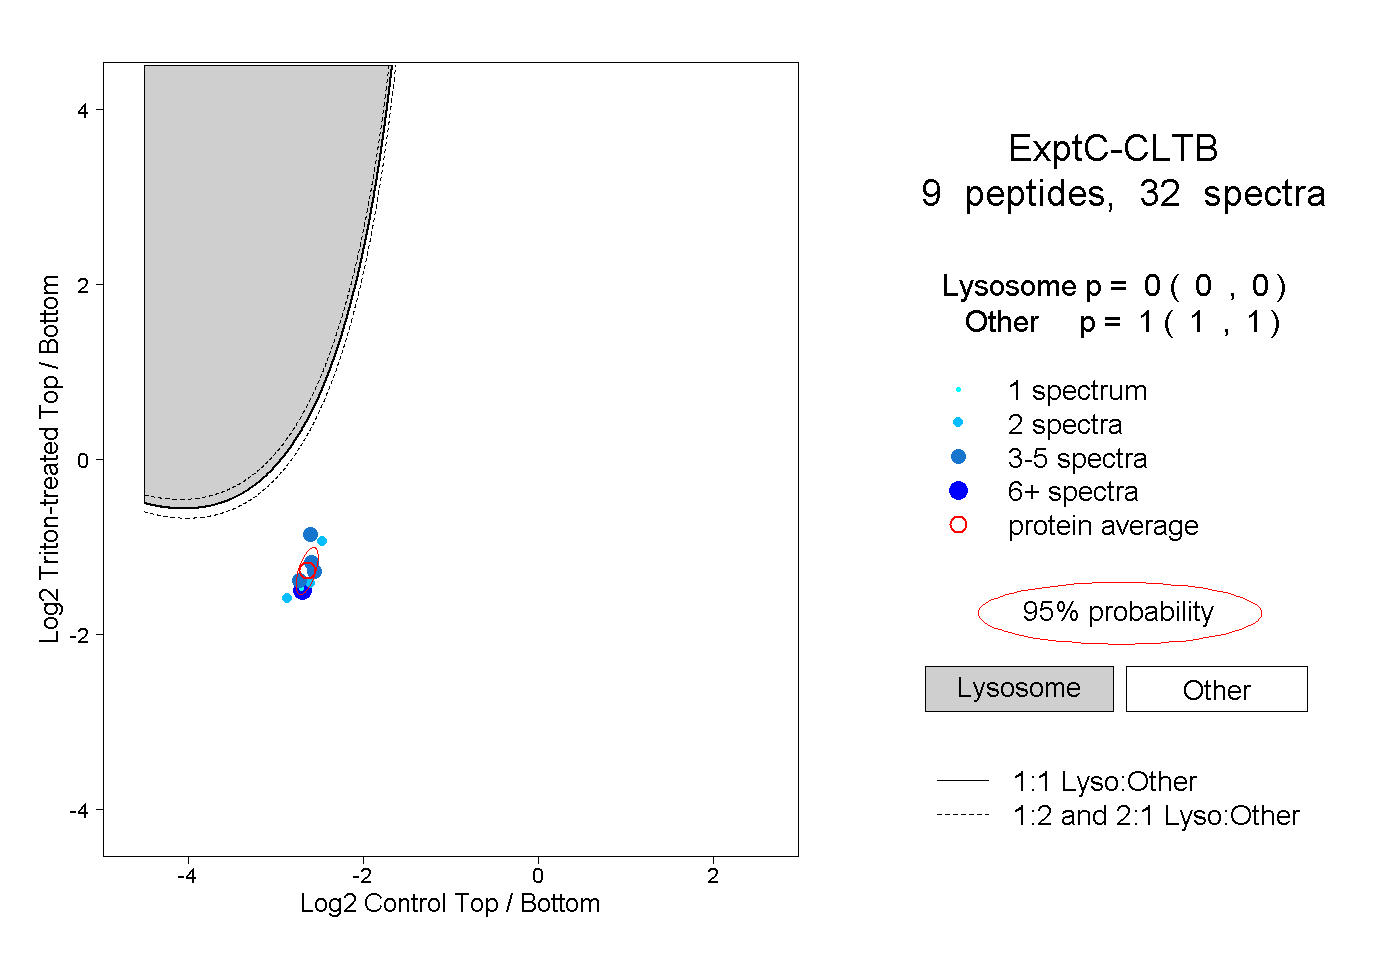
Lyso |
|
|
|
|
|
|
|
Other |
| Expt C |
9
peptides |
32
spectra |
 |
|
0.000
0.000 | 0.000 |
|
|
|
|
|
|
|
1.000
1.000 | 1.000 |
| | | Plot |
|
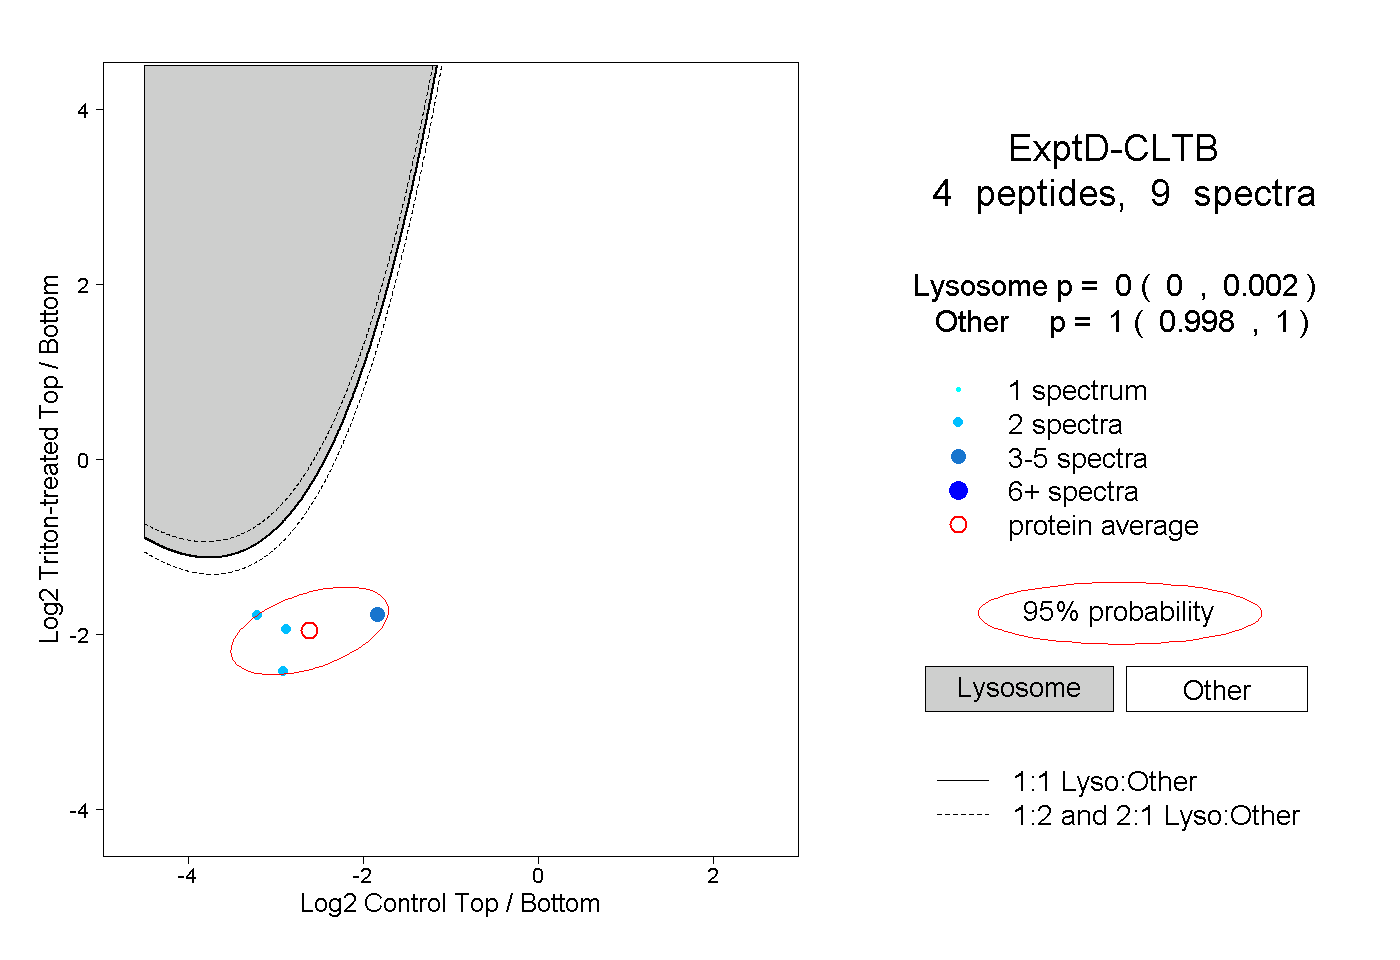
Lyso |
|
|
|
|
|
|
|
Other |
| Expt D |
4
peptides |
9
spectra |
 |
|
0.000
0.000 | 0.002 |
|
|
|
|
|
|
|
1.000
0.998 | 1.000 |