 7
7peptides
spectra
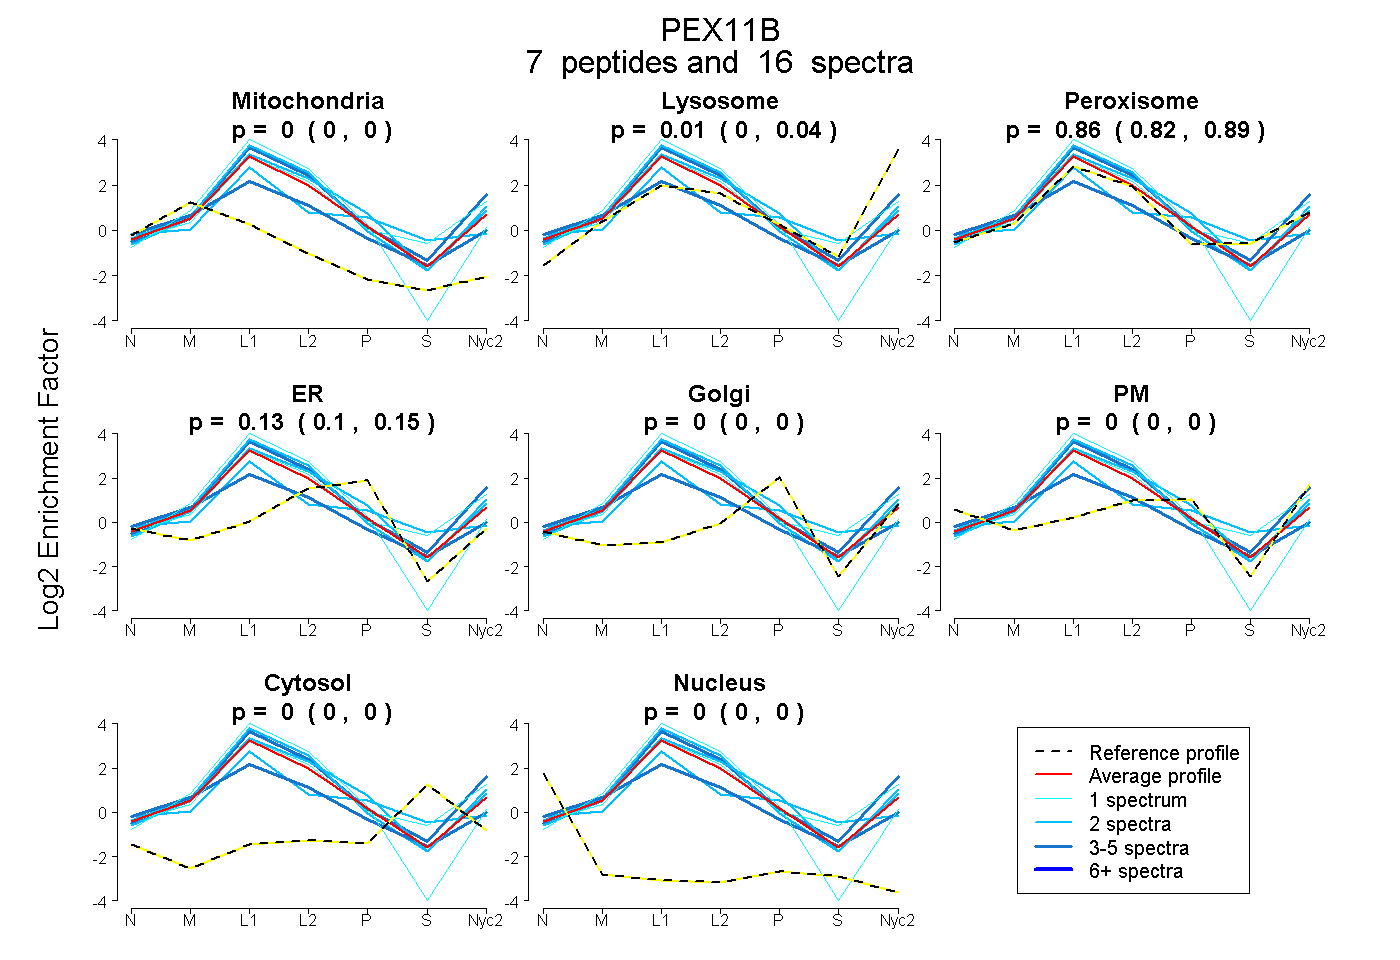
0.000 | 0.000
0.000 | 0.043
0.815 | 0.888
0.100 | 0.152
0.000 | 0.000
0.000 | 0.000
0.000 | 0.000
0.000 | 0.000
5peptides
spectra
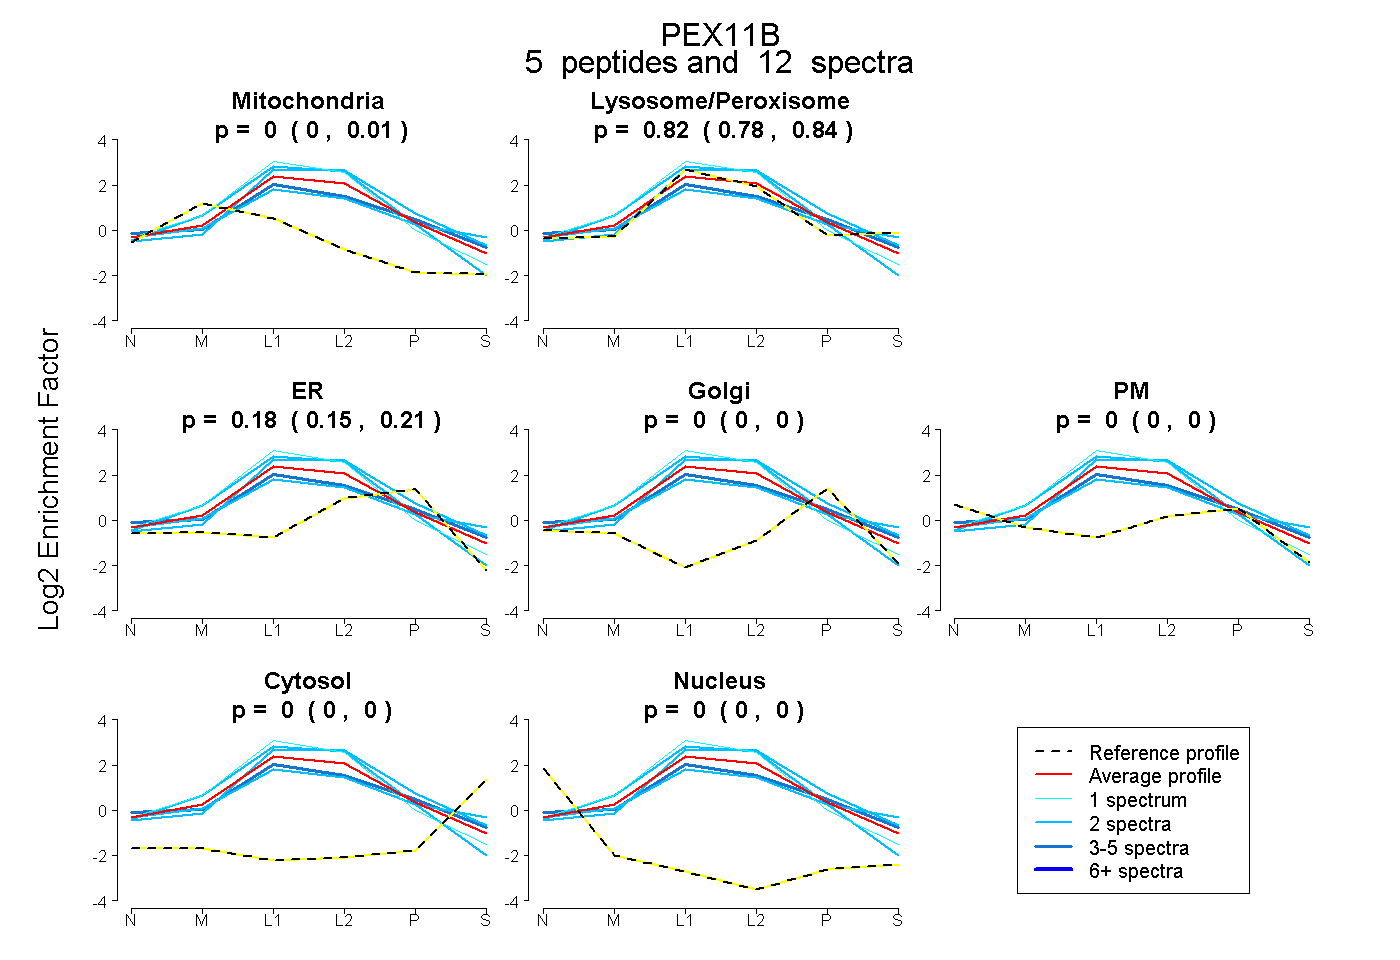
0.000 | 0.014
0.783 | 0.842
0.152 | 0.207
0.000 | 0.000
0.000 | 0.000
0.000 | 0.000
0.000 | 0.000
11peptides
spectra
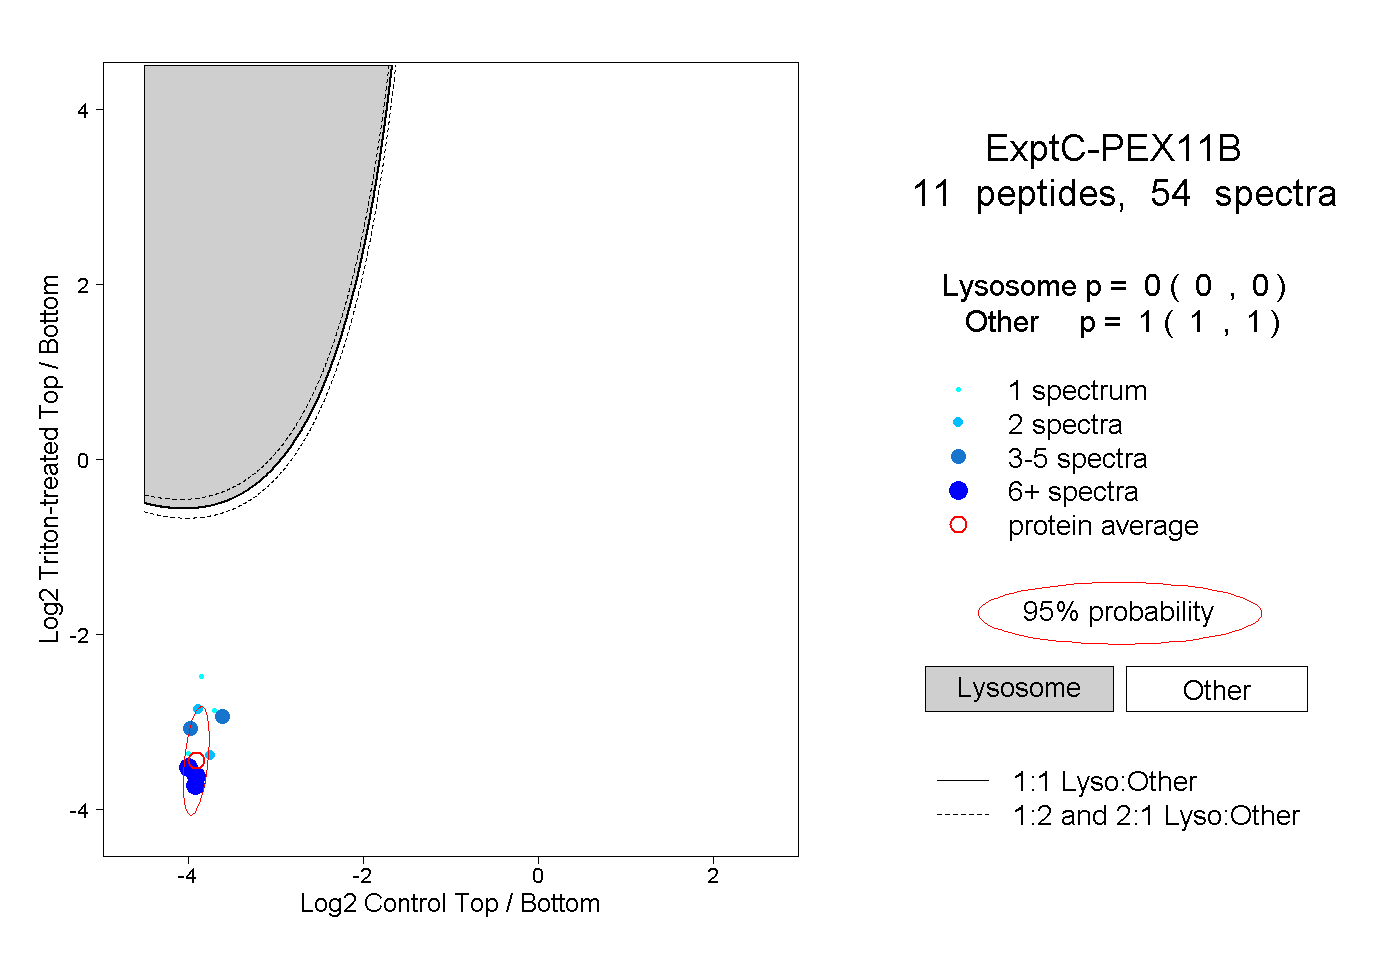
0.000 | 0.000
1.000 | 1.000
3peptides
spectra
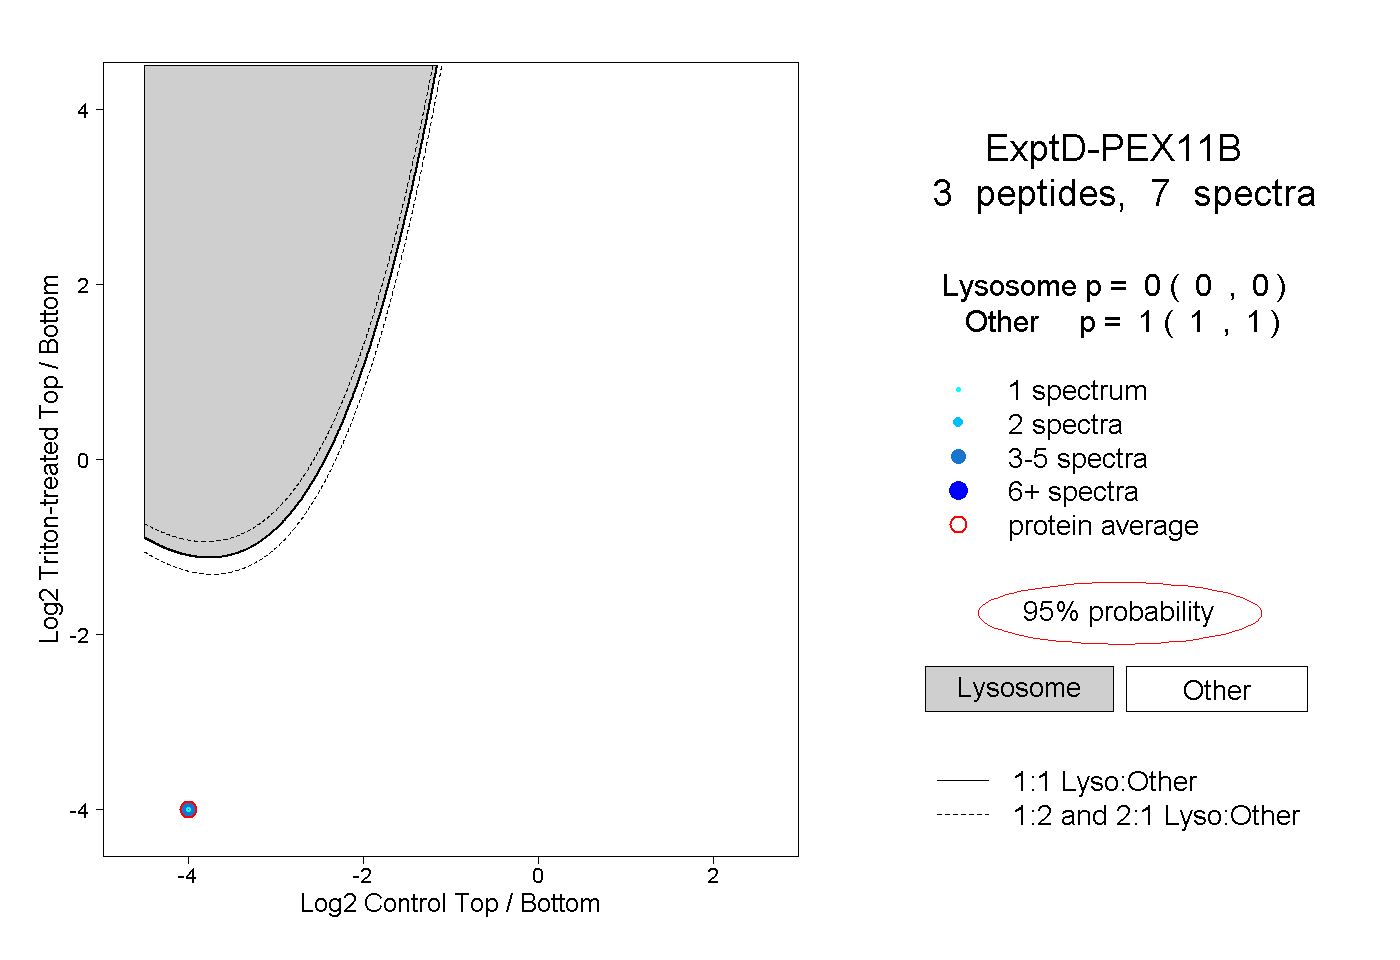
0.000 | 0.000
1.000 | 1.000