 7
7peptides
spectra
0.000 | 0.000
0.000 | 0.043
0.815 | 0.888
0.100 | 0.152
0.000 | 0.000
0.000 | 0.000
0.000 | 0.000
0.000 | 0.000
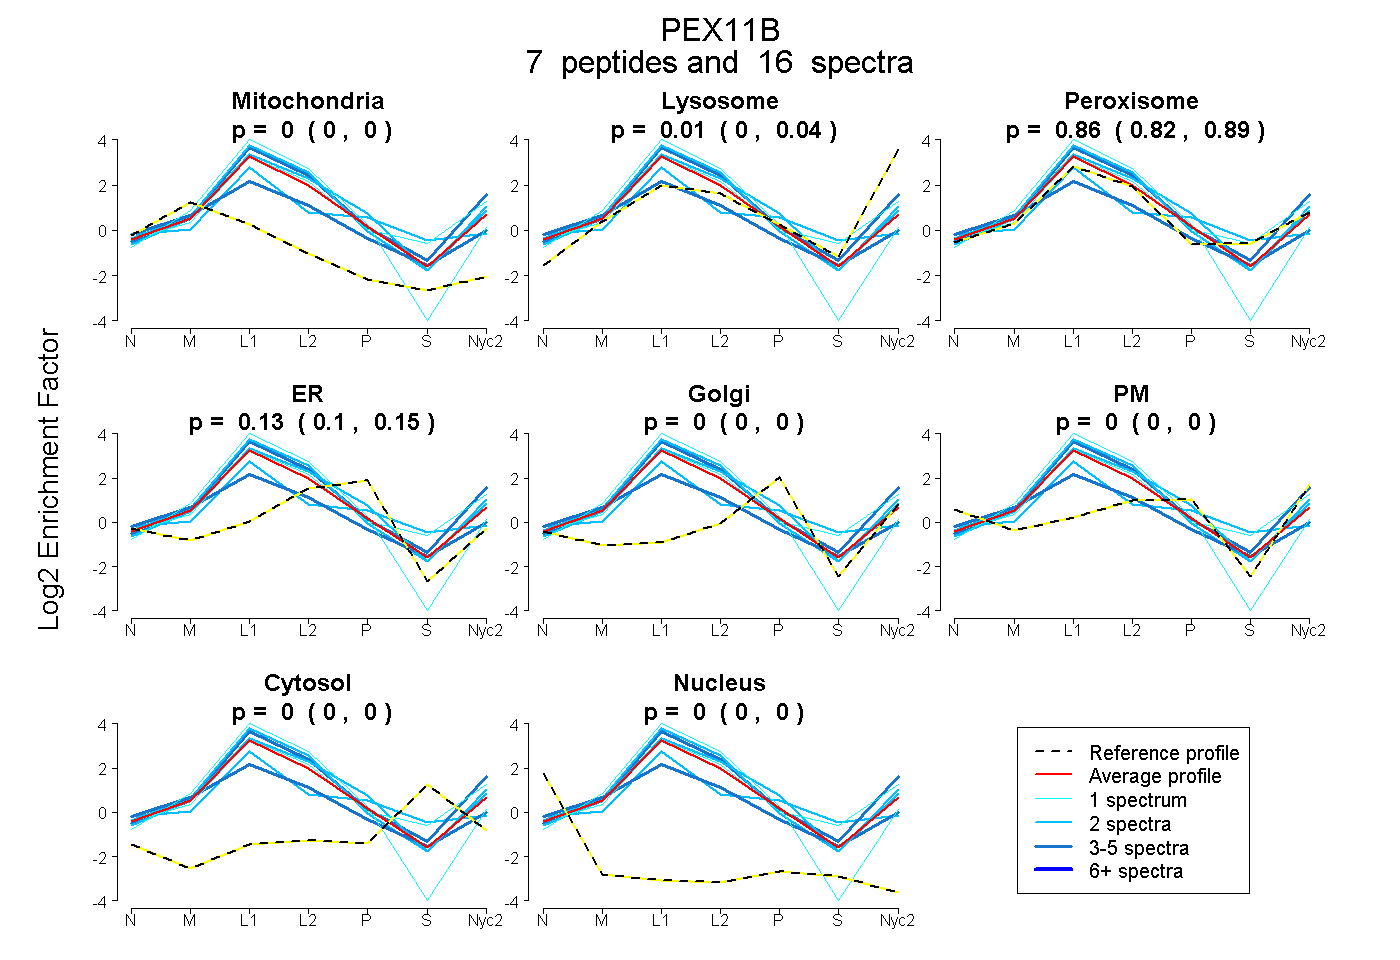
| Plot | Mito | Lyso | Perox | ER | Golgi | PM | Cytosol | Nucleus | |||||
| Expt A |
7 peptides |
16 spectra |
|
0.000 0.000 | 0.000 |
0.011 0.000 | 0.043 |
0.862 0.815 | 0.888 |
0.127 0.100 | 0.152 |
0.000 0.000 | 0.000 |
0.000 0.000 | 0.000 |
0.000 0.000 | 0.000 |
0.000 0.000 | 0.000 |
| 2 spectra, AAQYACSLLGHALQR | 0.025 | 0.000 | 0.751 | 0.146 | 0.025 | 0.000 | 0.045 | 0.008 | ||
| 4 spectra, FCITVSHLNR | 0.221 | 0.000 | 0.627 | 0.114 | 0.000 | 0.038 | 0.000 | 0.000 | ||
| 2 spectra, FSAQSQAR | 0.000 | 0.162 | 0.681 | 0.158 | 0.000 | 0.000 | 0.000 | 0.000 | ||
| 1 spectrum, LGNSADALESAK | 0.000 | 0.122 | 0.878 | 0.000 | 0.000 | 0.000 | 0.000 | 0.000 | ||
| 4 spectra, DAYEIR | 0.000 | 0.229 | 0.771 | 0.000 | 0.000 | 0.000 | 0.000 | 0.000 | ||
| 1 spectrum, NACDLFIPLDK | 0.000 | 0.000 | 0.728 | 0.272 | 0.000 | 0.000 | 0.000 | 0.000 | ||
| 2 spectra, DHPPLLLDVLR | 0.000 | 0.017 | 0.954 | 0.029 | 0.000 | 0.000 | 0.000 | 0.000 |
| Plot | Mito | Lyso or Perox | ER | Golgi | PM | Cytosol | Nucleus | ||||||
| Expt B |
5 peptides |
12 spectra |
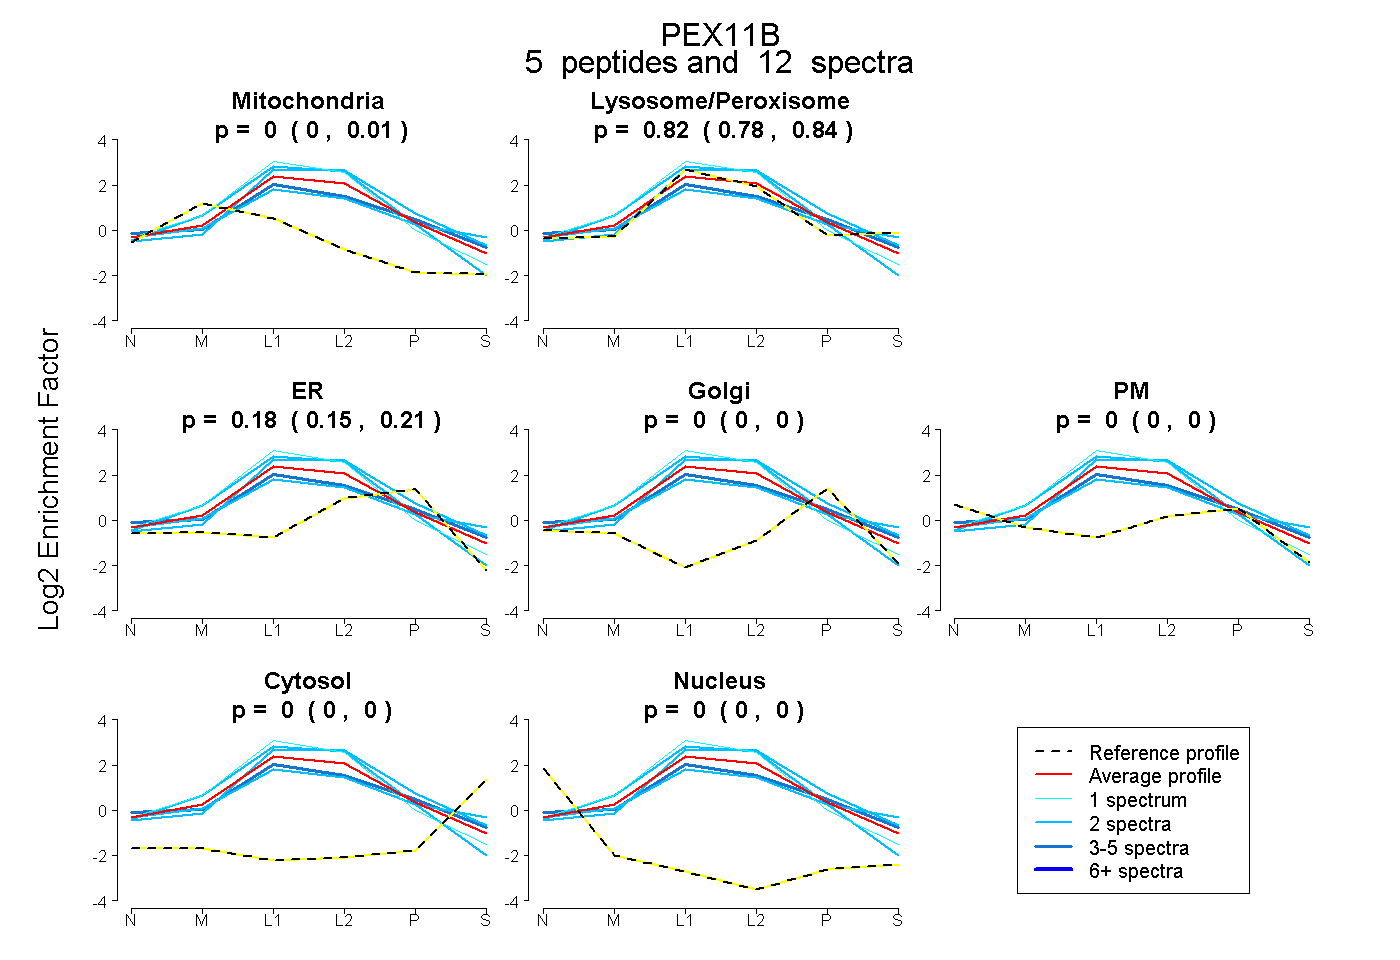 |
0.000 0.000 | 0.014 |
0.817 0.783 | 0.842 |
0.183 0.152 | 0.207 |
0.000 0.000 | 0.000 |
0.000 0.000 | 0.000 |
0.000 0.000 | 0.000 |
0.000 0.000 | 0.000 |
|||
| Plot | Lyso | Other | |||||||||||
| Expt C |
11 peptides |
54 spectra |
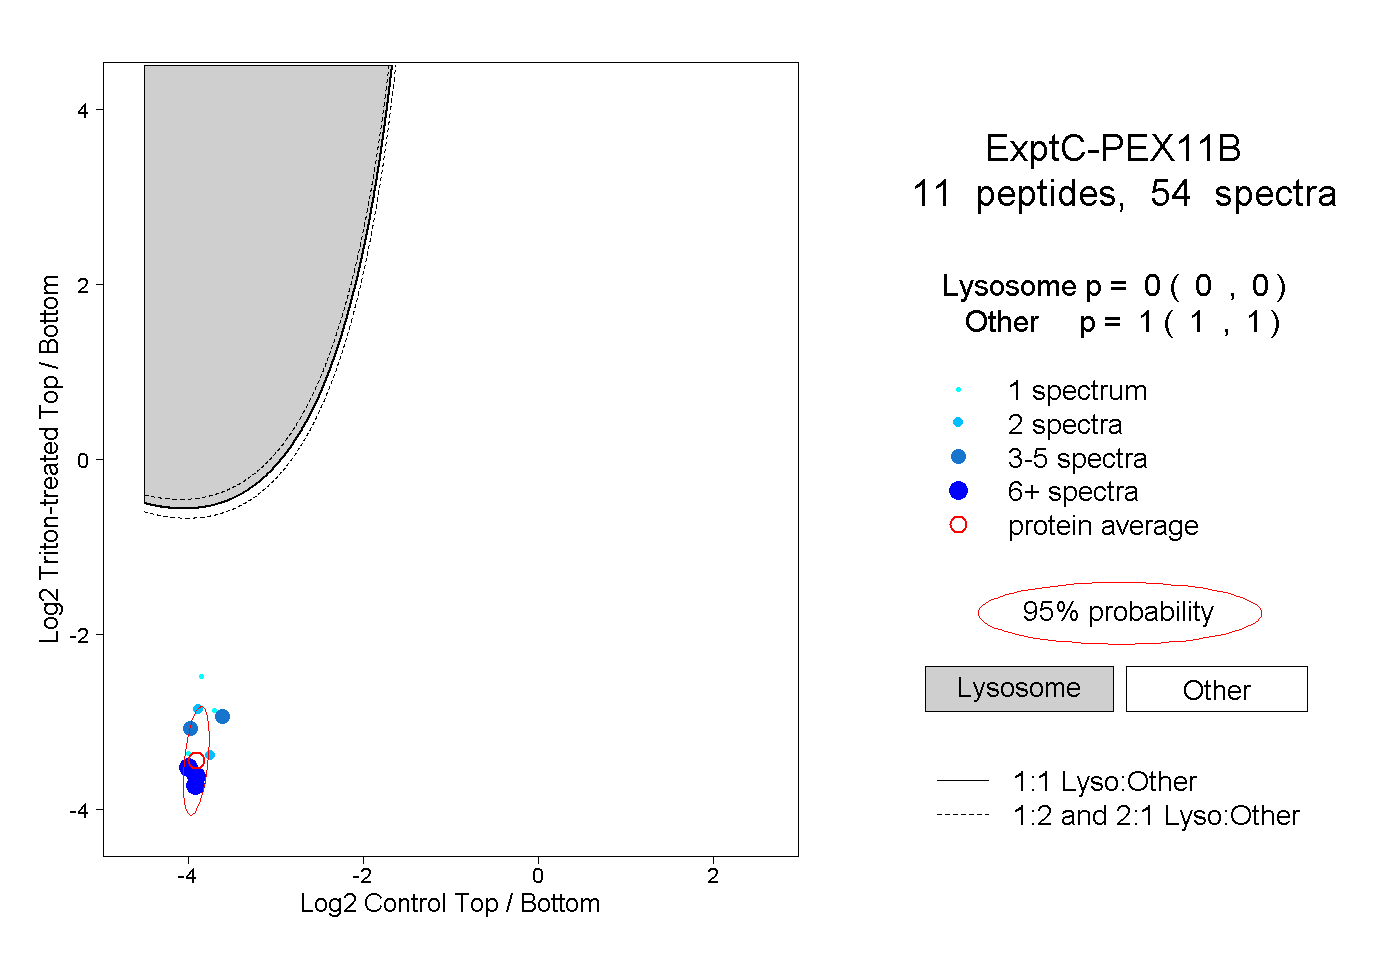 |
0.000 0.000 | 0.000 |
1.000 1.000 | 1.000 |
||||||||
| Plot | Lyso | Other | |||||||||||
| Expt D |
3 peptides |
7 spectra |
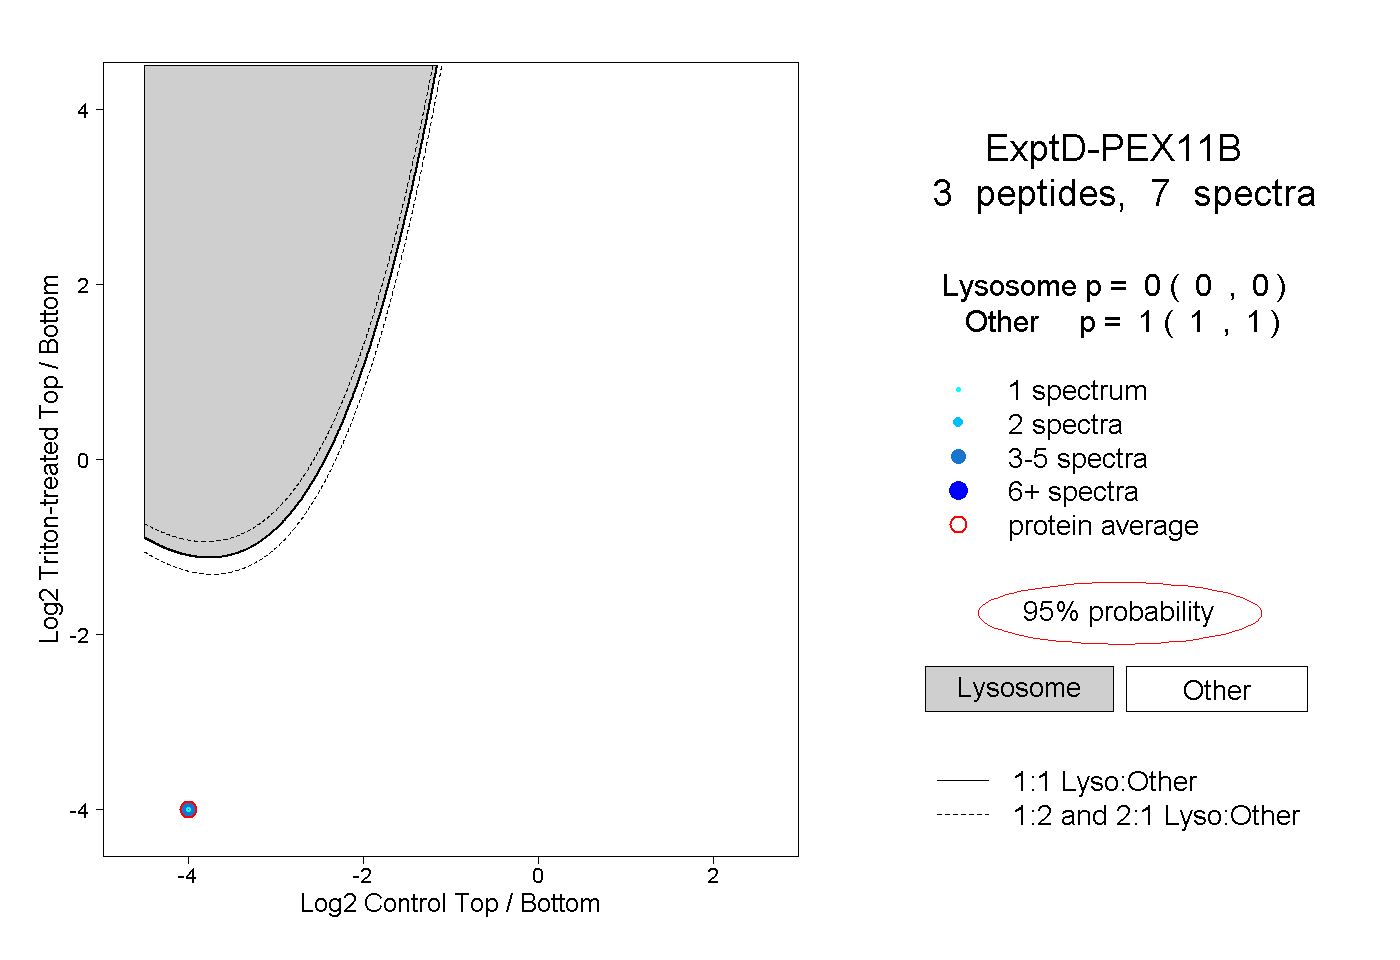 |
0.000 0.000 | 0.000 |
1.000 1.000 | 1.000 |