PEX11B
[ENSRNOP00000028811]
Main page
| | | Plot |
Mito |
Lyso |
|
Perox |
ER |
Golgi |
PM |
Cytosol |
Nucleus |
|
| Expt A |
 7
7
peptides |
16
spectra |
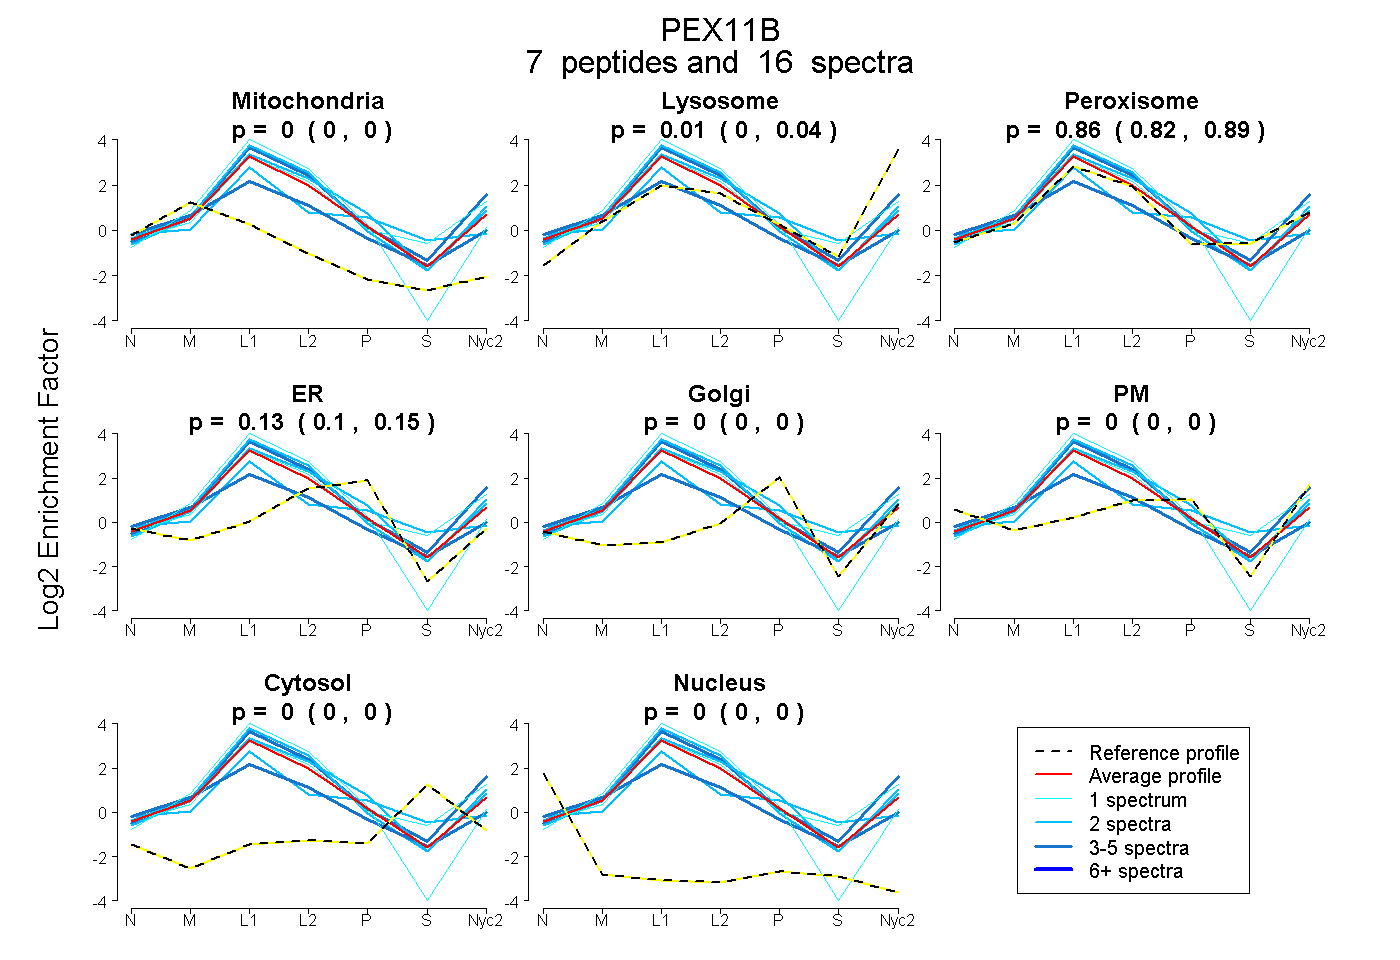 |
0.000
0.000 | 0.000 |
0.011
0.000 | 0.043 |
|
0.862
0.815 | 0.888 |
0.127
0.100 | 0.152 |
0.000
0.000 | 0.000 |
0.000
0.000 | 0.000 |
0.000
0.000 | 0.000 |
0.000
0.000 | 0.000 |
|
| | | Plot |
Mito |
|
Lyso or Perox |
|
ER |
Golgi |
PM |
Cytosol |
Nucleus |
|
| Expt B |
5
peptides |
12
spectra |
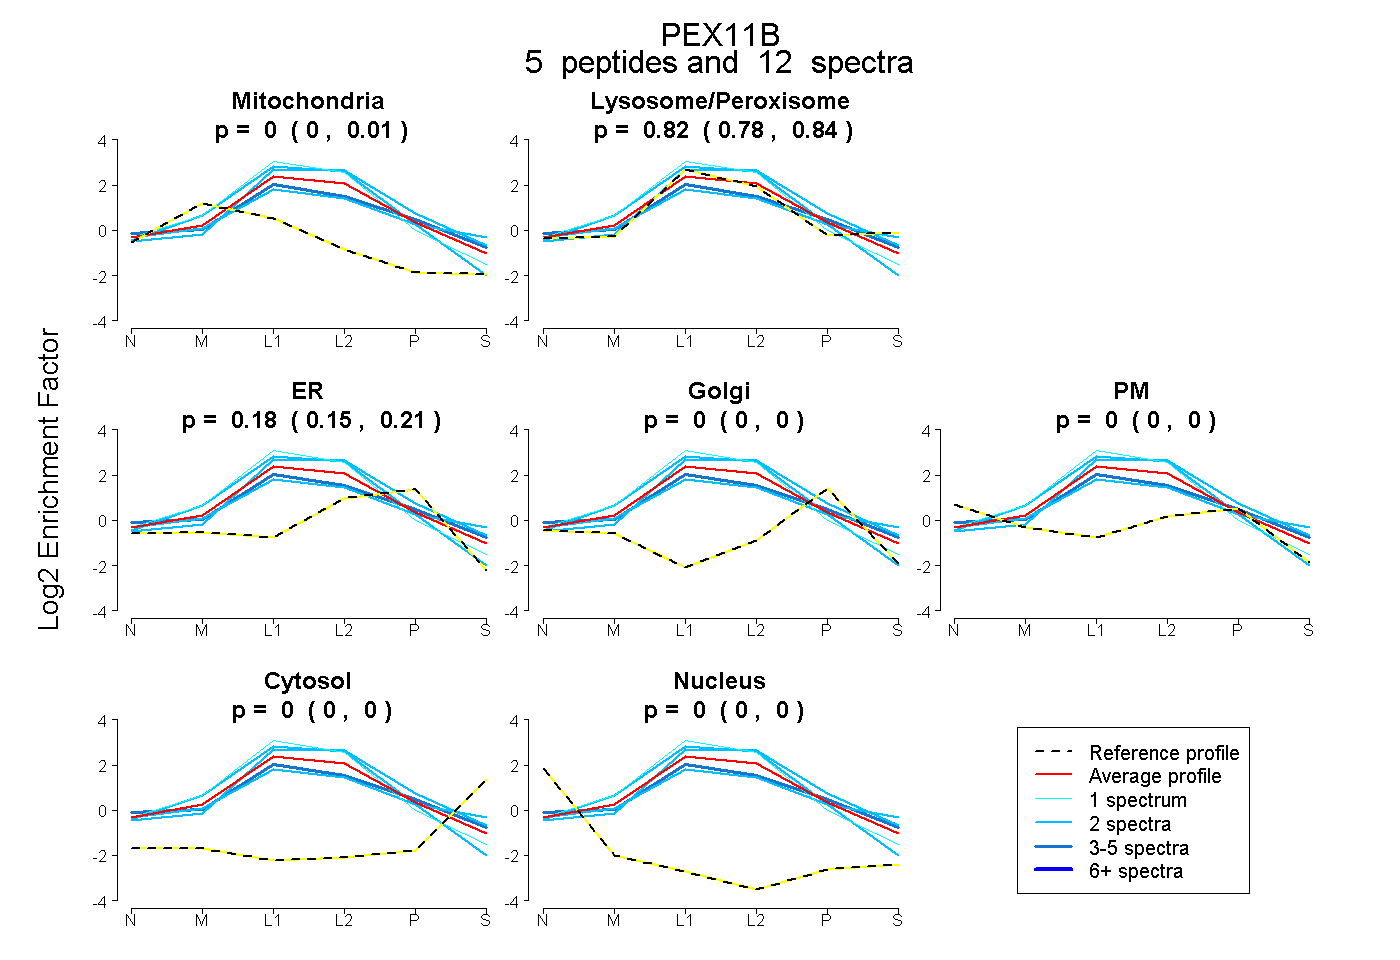 |
0.000
0.000 | 0.014 |
|
0.817
0.783 | 0.842 |
|
0.183
0.152 | 0.207 |
0.000
0.000 | 0.000 |
0.000
0.000 | 0.000 |
0.000
0.000 | 0.000 |
0.000
0.000 | 0.000 |
|
| 2 spectra, FSAQSQAR |
0.000 |
|
0.896 |
|
0.104 |
0.000 |
0.000 |
0.000 |
0.000 |
|
| 5 spectra, DAYEIR |
0.000 |
|
0.736 |
|
0.162 |
0.000 |
0.102 |
0.000 |
0.000 |
|
| 1 spectrum, NACDLFIPLDK |
0.037 |
|
0.924 |
|
0.039 |
0.000 |
0.000 |
0.000 |
0.000 |
|
| 2 spectra, FCITVSHLNR |
0.013 |
|
0.807 |
|
0.000 |
0.180 |
0.000 |
0.000 |
0.000 |
|
| 2 spectra, DHPPLLLDVLR |
0.008 |
|
0.825 |
|
0.167 |
0.000 |
0.000 |
0.000 |
0.000 |
|
| | | Plot |
|
Lyso |
|
|
|
|
|
|
|
Other |
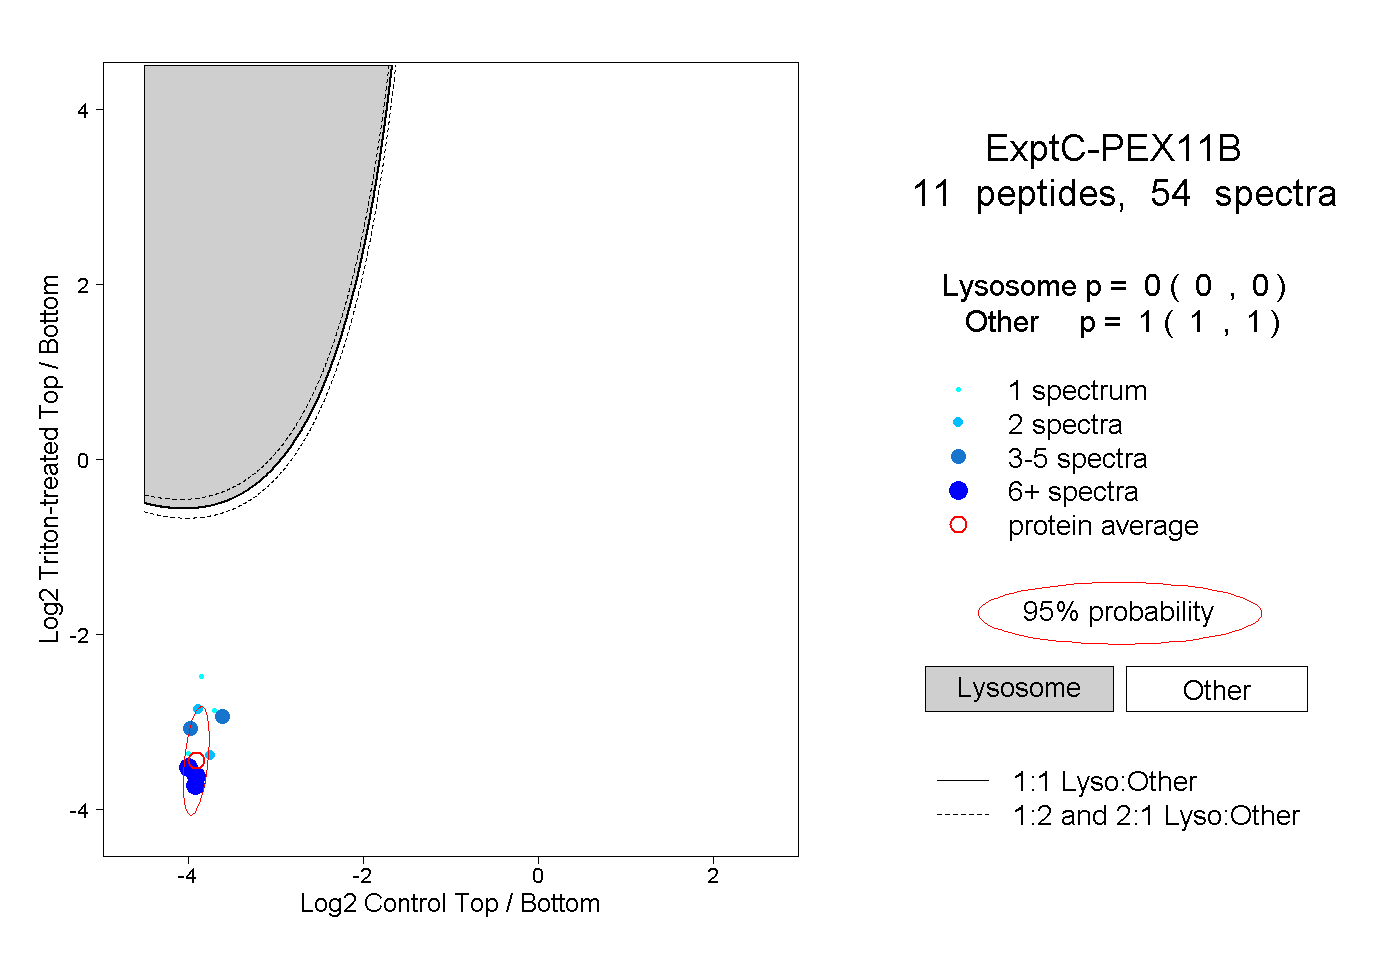
| Expt C |
11
peptides |
54
spectra |
 |
|
0.000
0.000 | 0.000 |
|
|
|
|
|
|
|
1.000
1.000 | 1.000 |
| | | Plot |
|
Lyso |
|
|
|
|
|
|
|
Other |
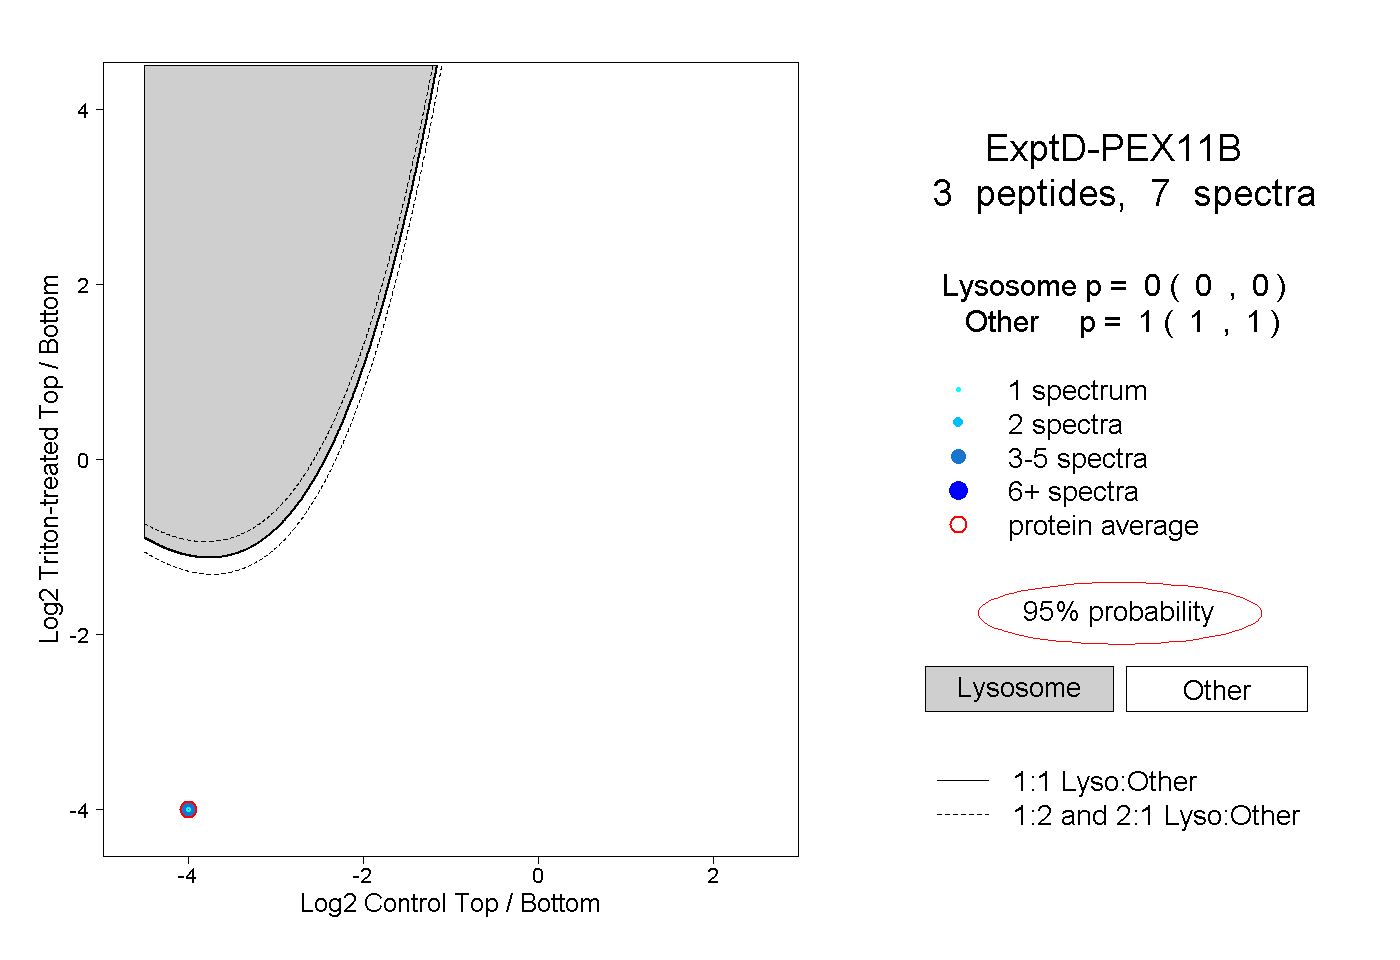
| Expt D |
3
peptides |
7
spectra |
 |
|
0.000
0.000 | 0.000 |
|
|
|
|
|
|
|
1.000
1.000 | 1.000 |