 10
10peptides
spectra
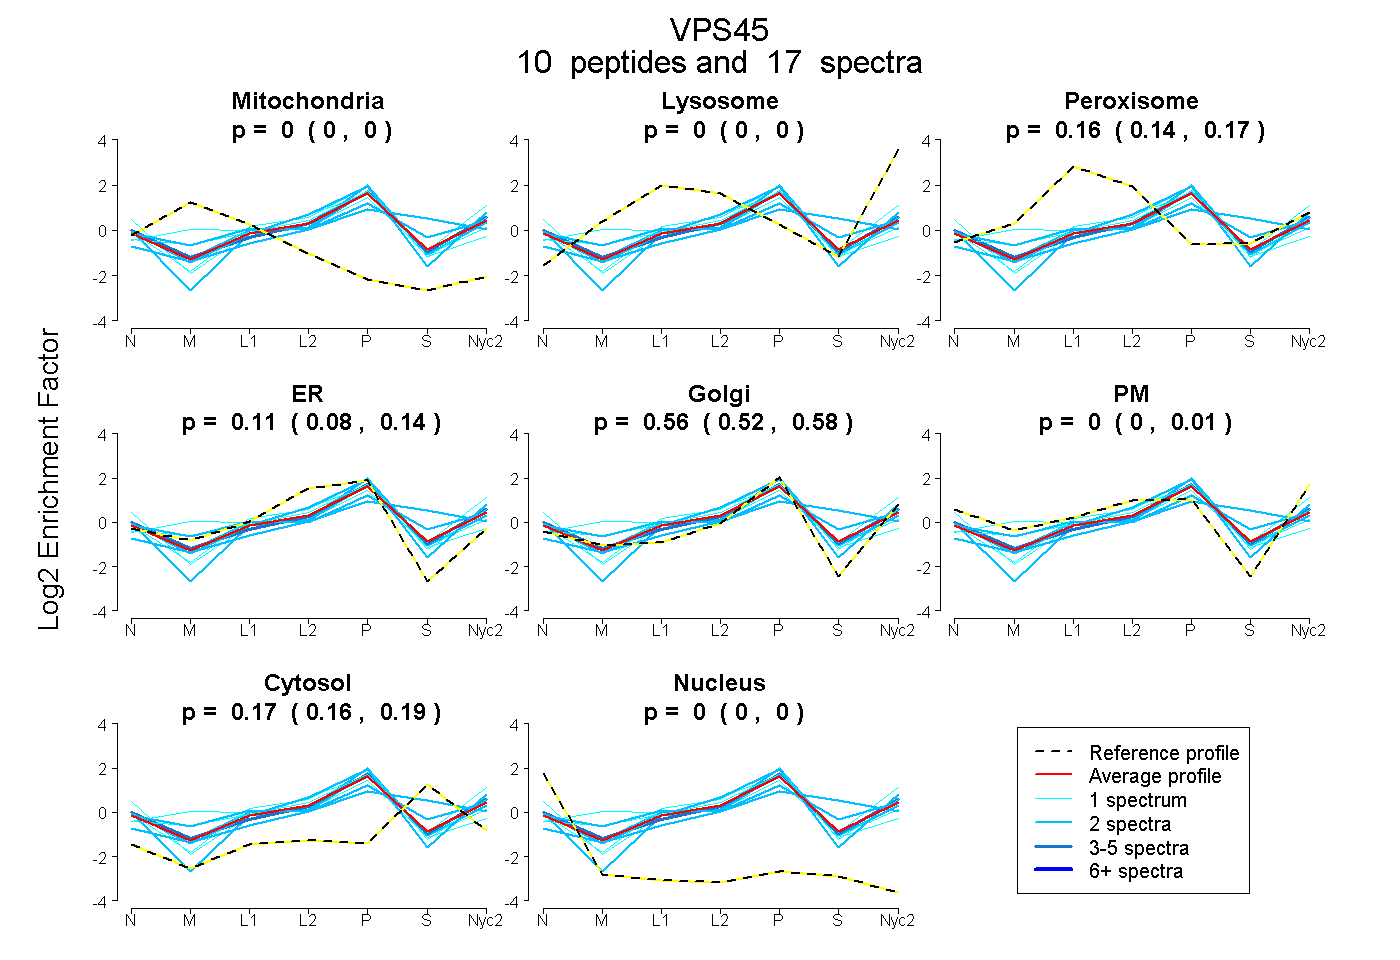
0.000 | 0.000
0.000 | 0.000
0.140 | 0.171
0.078 | 0.140
0.522 | 0.584
0.000 | 0.014
0.158 | 0.185
0.000 | 0.000
3peptides
spectra
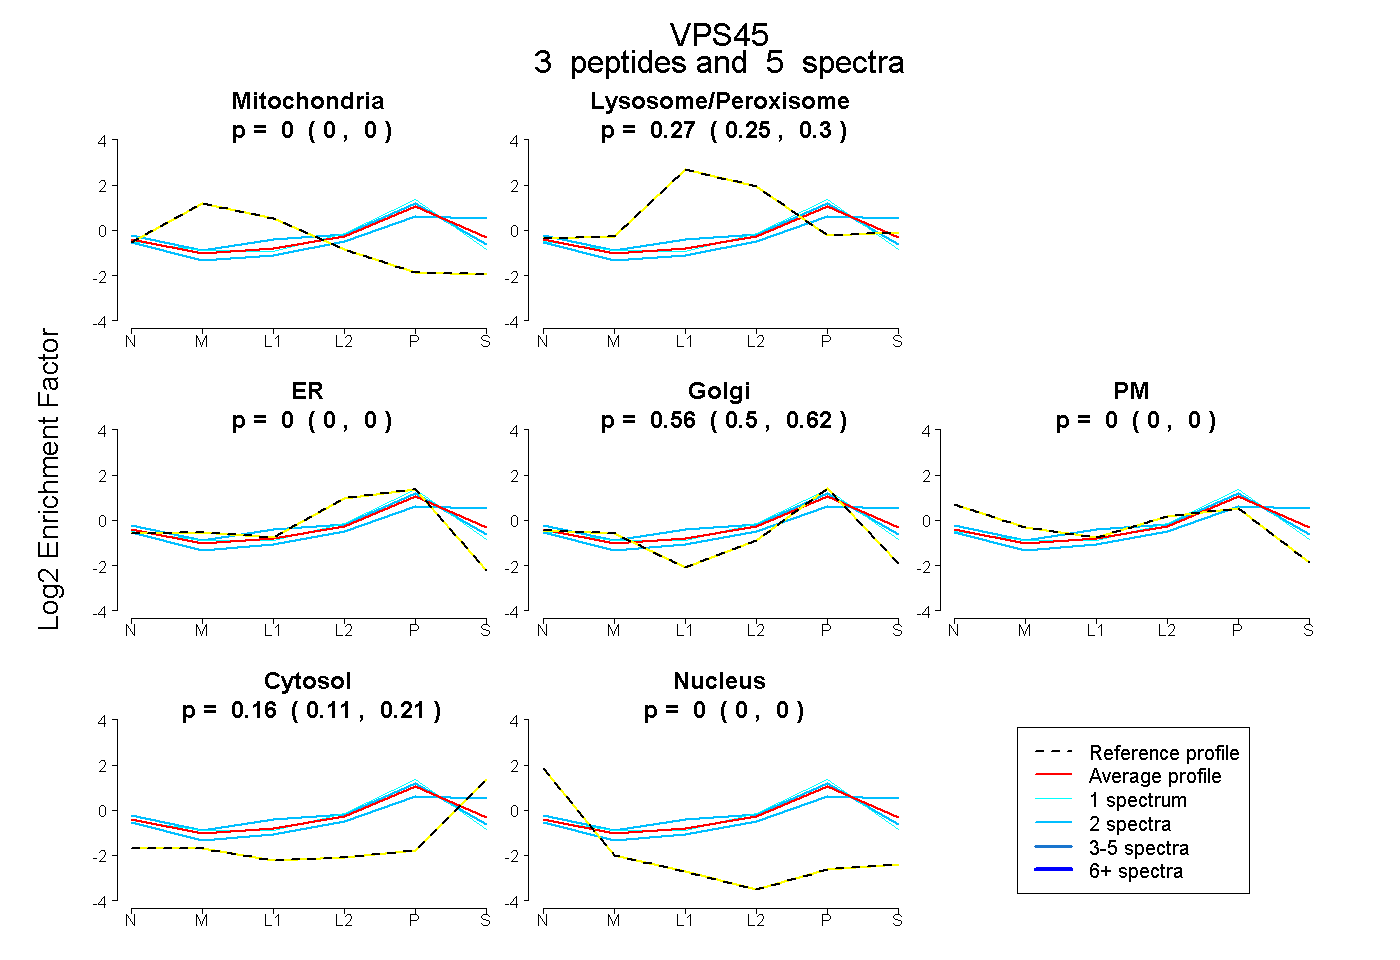
0.000 | 0.000
0.246 | 0.301
0.000 | 0.000
0.496 | 0.616
0.000 | 0.000
0.111 | 0.209
0.000 | 0.000
10peptides
spectra
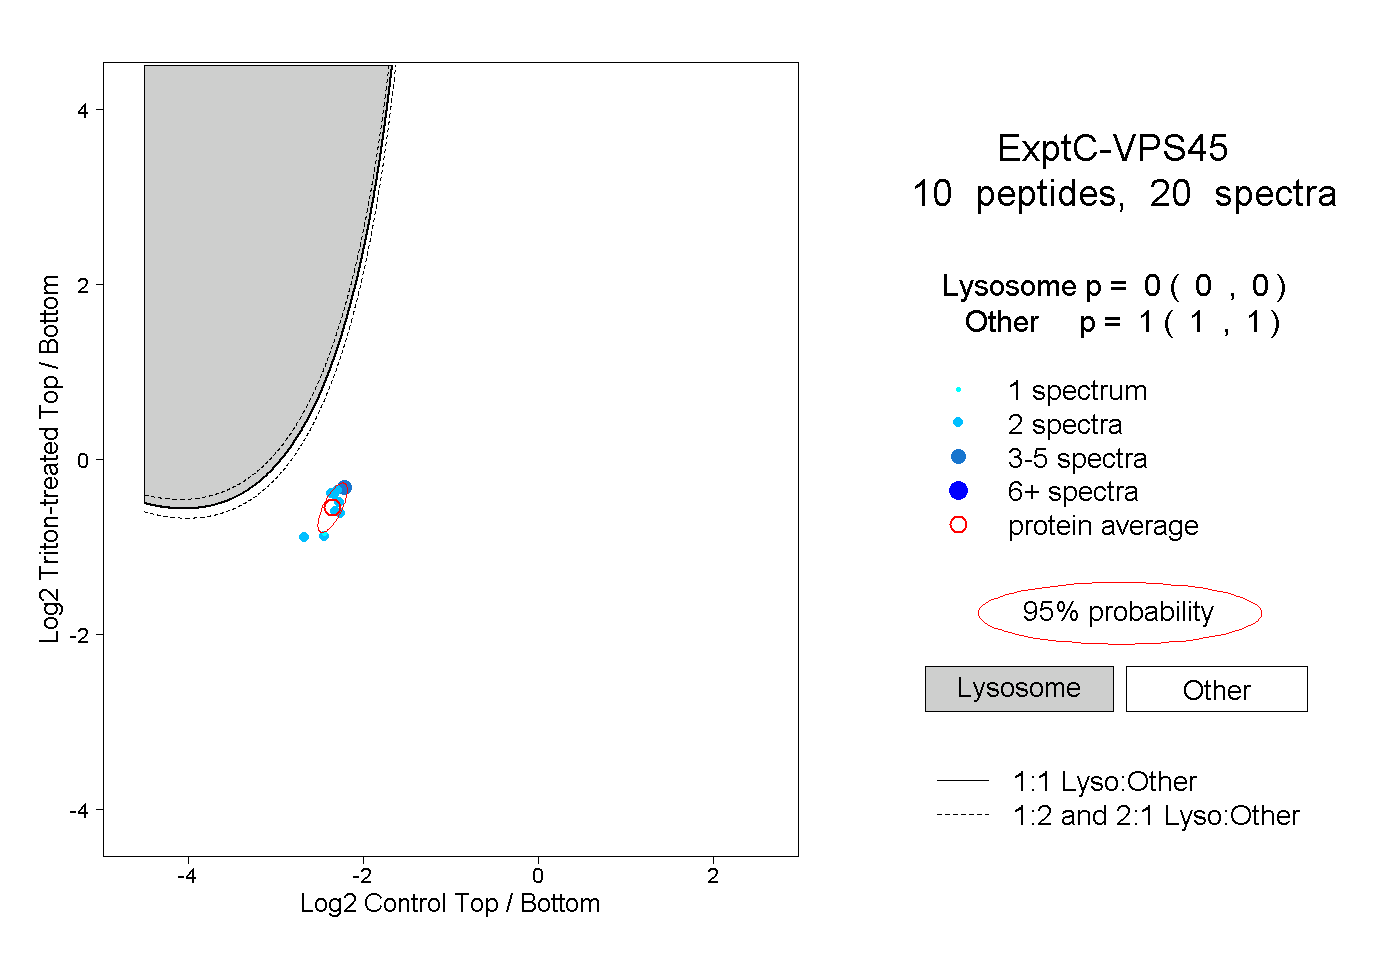
0.000 | 0.000
1.000 | 1.000
1peptide
spectra
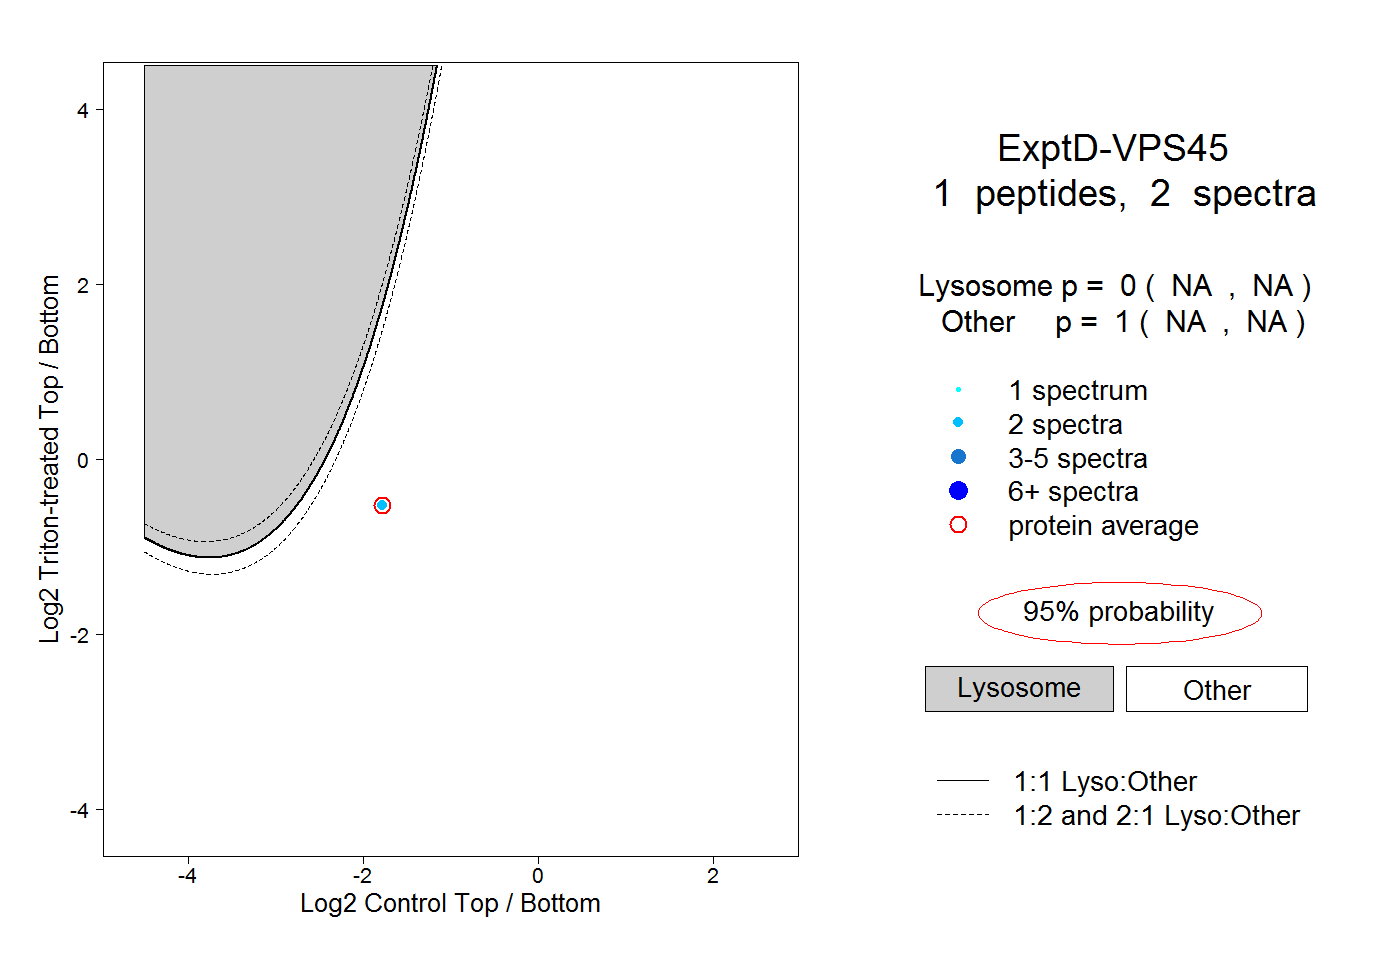
NA | NA
NA | NA