VPS45
[ENSRNOP00000028751]
Main page
| | | Plot |
Mito |
Lyso |
|
Perox |
ER |
Golgi |
PM |
Cytosol |
Nucleus |
|
| Expt A |
 10
10
peptides |
17
spectra |
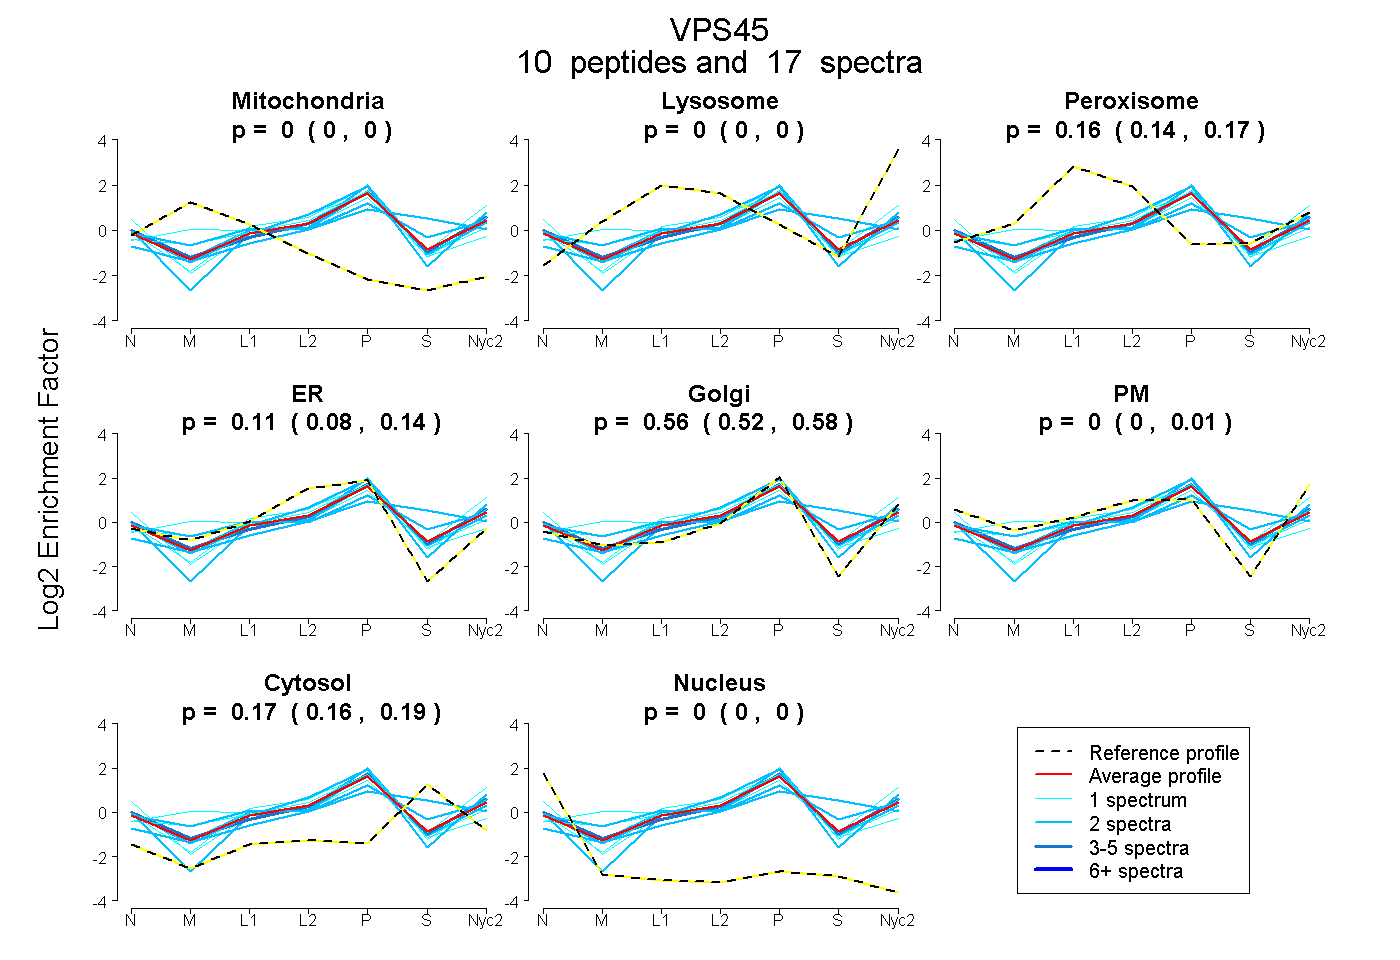 |
0.000
0.000 | 0.000 |
0.000
0.000 | 0.000 |
|
0.158
0.140 | 0.171 |
0.110
0.078 | 0.140 |
0.559
0.522 | 0.584 |
0.000
0.000 | 0.014 |
0.172
0.158 | 0.185 |
0.000
0.000 | 0.000 |
|
| | | Plot |
Mito |
|
Lyso or Perox |
|
ER |
Golgi |
PM |
Cytosol |
Nucleus |
|
| Expt B |
3
peptides |
5
spectra |
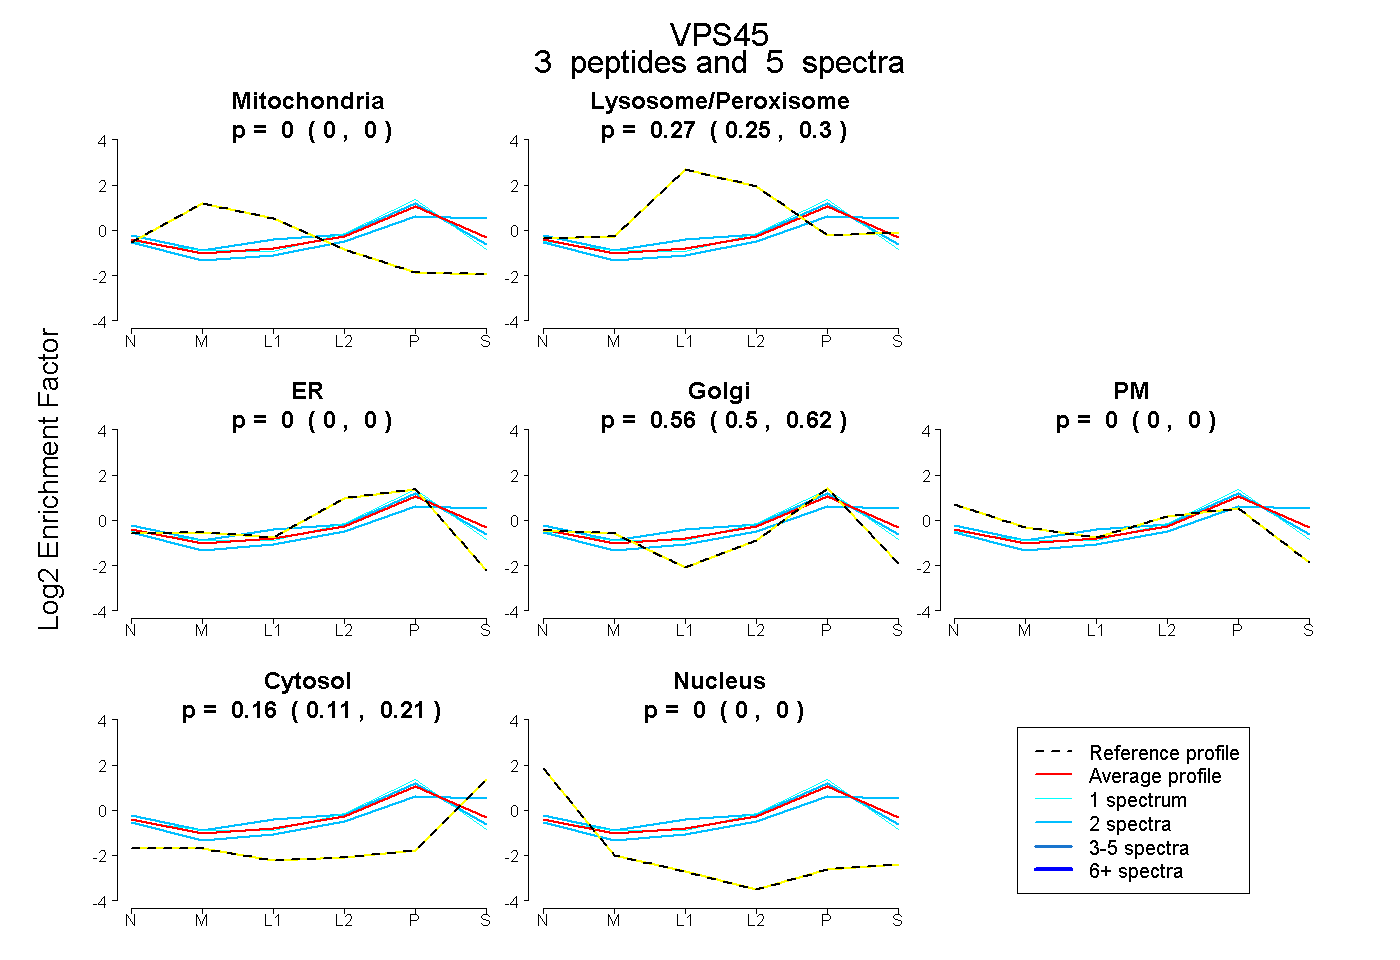 |
0.000
0.000 | 0.000 |
|
0.275
0.246 | 0.301 |
|
0.000
0.000 | 0.000 |
0.561
0.496 | 0.616 |
0.000
0.000 | 0.000 |
0.164
0.111 | 0.209 |
0.000
0.000 | 0.000 |
|
| 2 spectra, VTEFDAVR |
0.000 |
|
0.241 |
|
0.000 |
0.390 |
0.000 |
0.369 |
0.000 |
|
| 1 spectrum, EYELFEFR |
0.000 |
|
0.251 |
|
0.000 |
0.698 |
0.000 |
0.051 |
0.000 |
|
| 2 spectra, AICFLRPTK |
0.000 |
|
0.331 |
|
0.000 |
0.602 |
0.000 |
0.067 |
0.000 |
|
| | | Plot |
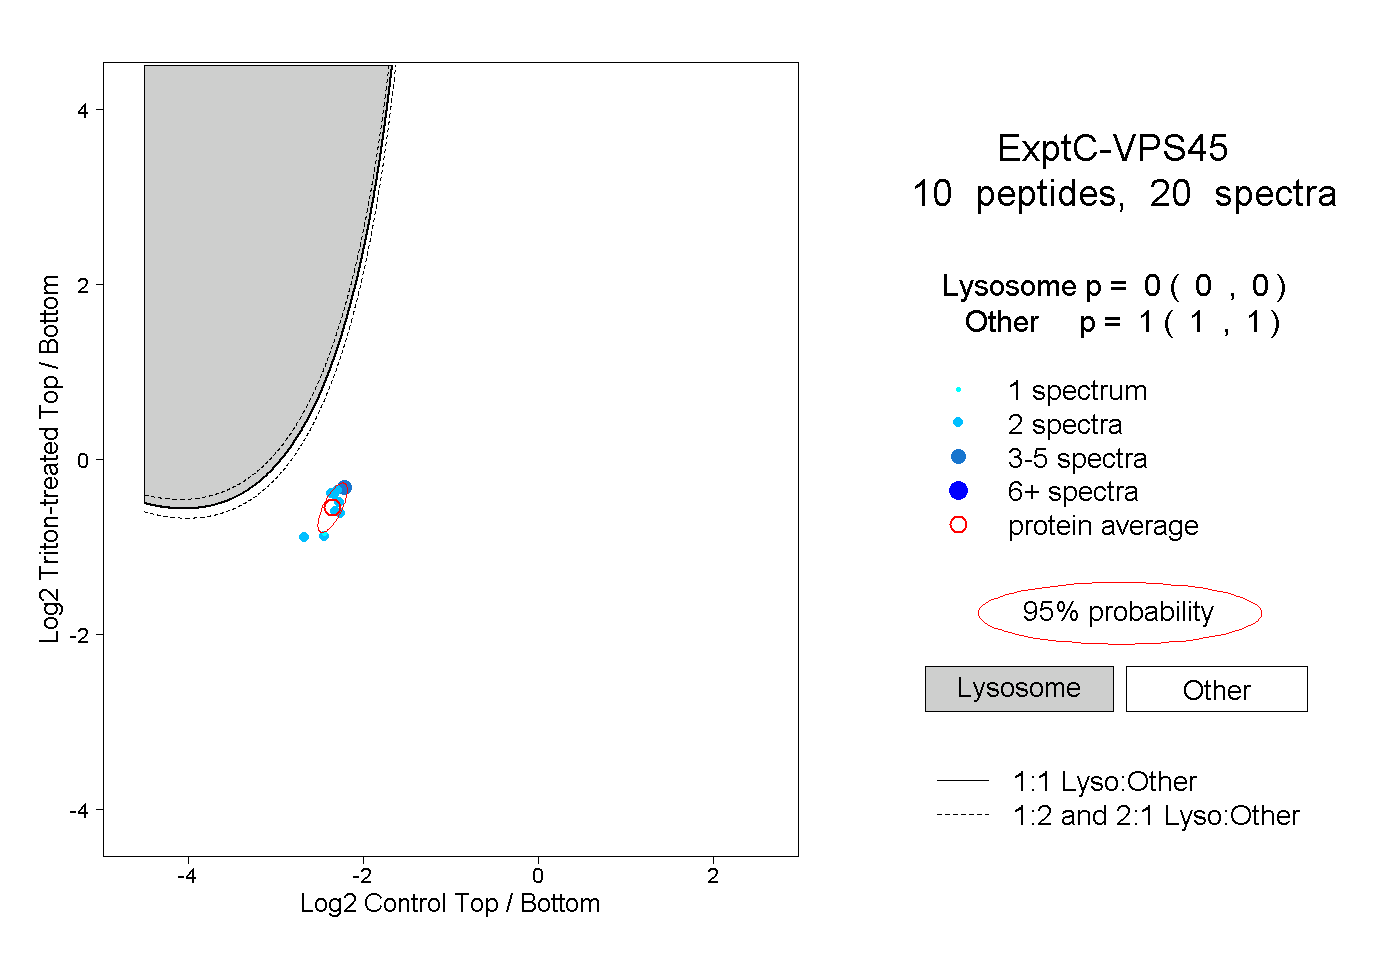
|
Lyso |
|
|
|
|
|
|
|
Other |
| Expt C |
10
peptides |
20
spectra |
 |
|
0.000
0.000 | 0.000 |
|
|
|
|
|
|
|
1.000
1.000 | 1.000 |
| | | Plot |
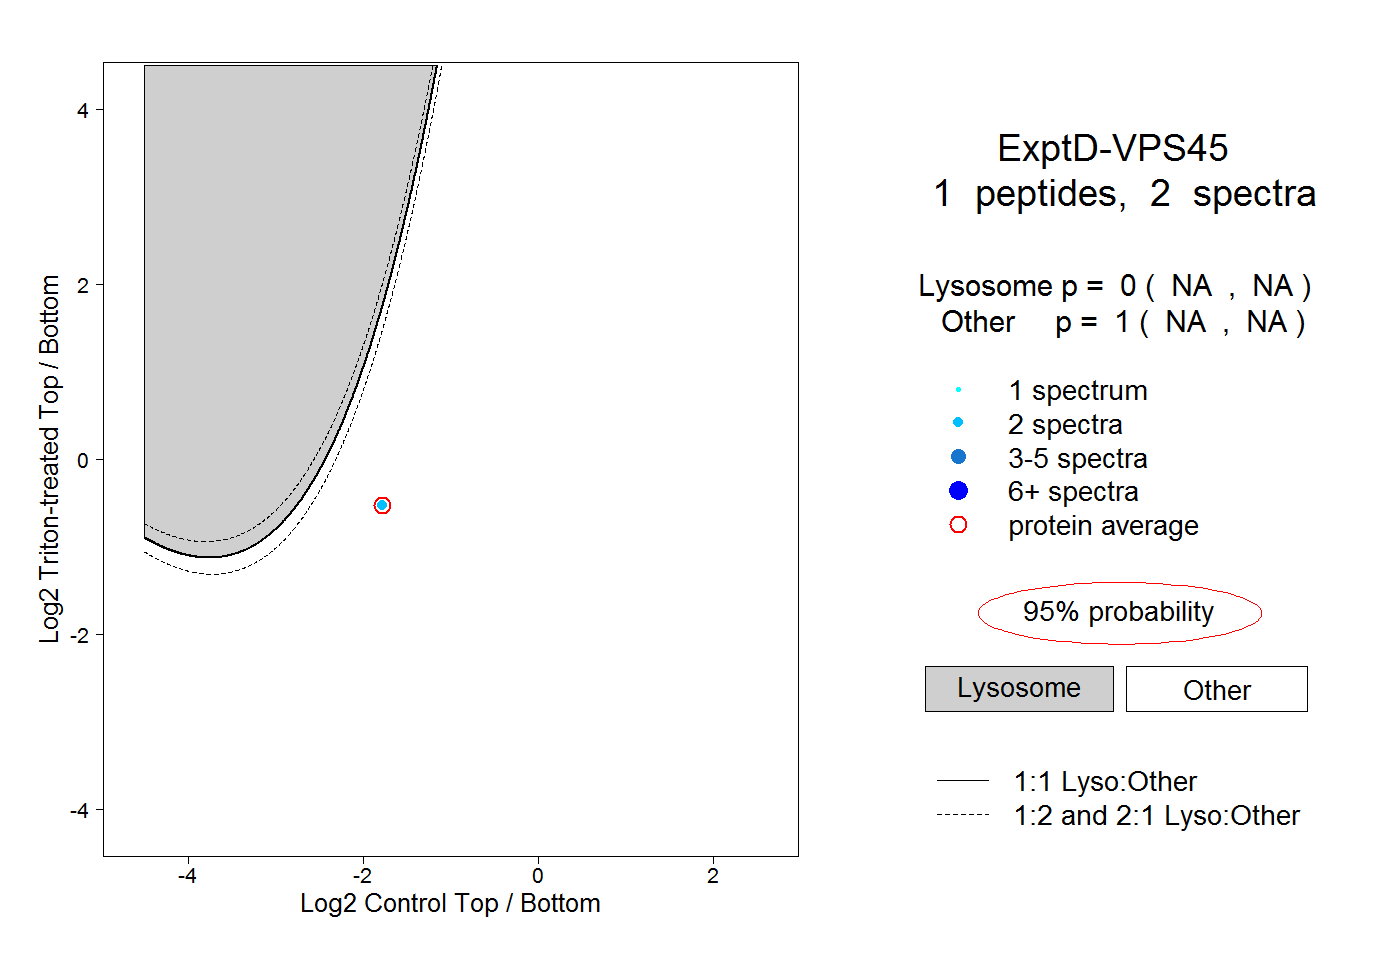
|
Lyso |
|
|
|
|
|
|
|
Other |
| Expt D |
1
peptide |
2
spectra |
 |
|
0.000
NA | NA |
|
|
|
|
|
|
|
1.000
NA | NA |