 10
10peptides
spectra
0.000 | 0.000
0.000 | 0.000
0.140 | 0.171
0.078 | 0.140
0.522 | 0.584
0.000 | 0.014
0.158 | 0.185
0.000 | 0.000
| Plot | Mito | Lyso | Perox | ER | Golgi | PM | Cytosol | Nucleus | |||||
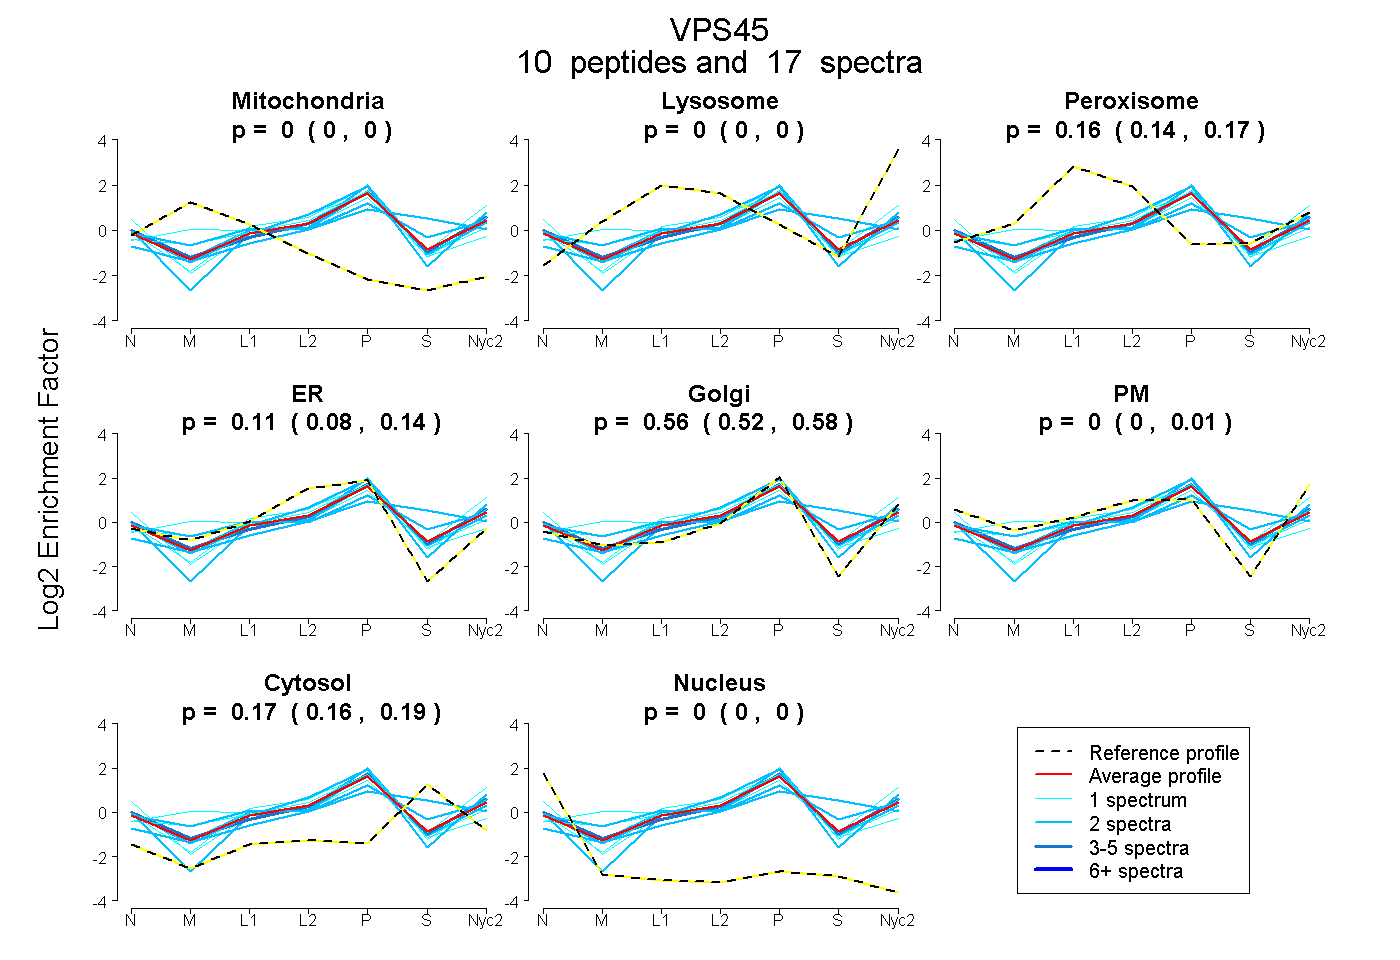
| Expt A |
10 peptides |
17 spectra |
|
0.000 0.000 | 0.000 |
0.000 0.000 | 0.000 |
0.158 0.140 | 0.171 |
0.110 0.078 | 0.140 |
0.559 0.522 | 0.584 |
0.000 0.000 | 0.014 |
0.172 0.158 | 0.185 |
0.000 0.000 | 0.000 |
| 2 spectra, VTEFDAVR | 0.000 | 0.055 | 0.087 | 0.125 | 0.259 | 0.000 | 0.475 | 0.000 | ||
| 1 spectrum, AFVENYPQFK | 0.065 | 0.000 | 0.246 | 0.023 | 0.586 | 0.000 | 0.080 | 0.000 | ||
| 2 spectra, ENVDSLIQELR | 0.000 | 0.000 | 0.183 | 0.000 | 0.690 | 0.001 | 0.126 | 0.000 | ||
| 2 spectra, YQLSSEAAK | 0.000 | 0.000 | 0.274 | 0.000 | 0.510 | 0.000 | 0.215 | 0.000 | ||
| 2 spectra, TEVPPLLLILDR | 0.000 | 0.048 | 0.000 | 0.277 | 0.415 | 0.170 | 0.090 | 0.000 | ||
| 3 spectra, EYELFEFR | 0.000 | 0.000 | 0.100 | 0.083 | 0.540 | 0.110 | 0.167 | 0.000 | ||
| 1 spectrum, VLLMDK | 0.000 | 0.151 | 0.128 | 0.000 | 0.629 | 0.000 | 0.091 | 0.000 | ||
| 2 spectra, ESSQATSR | 0.000 | 0.000 | 0.000 | 0.268 | 0.496 | 0.000 | 0.236 | 0.000 | ||
| 1 spectrum, IVLGGTTIHNTK | 0.000 | 0.000 | 0.127 | 0.244 | 0.516 | 0.000 | 0.113 | 0.000 | ||
| 1 spectrum, AICFLRPTK | 0.000 | 0.000 | 0.000 | 0.618 | 0.040 | 0.092 | 0.238 | 0.011 |
| Plot | Mito | Lyso or Perox | ER | Golgi | PM | Cytosol | Nucleus | ||||||
| Expt B |
3 peptides |
5 spectra |
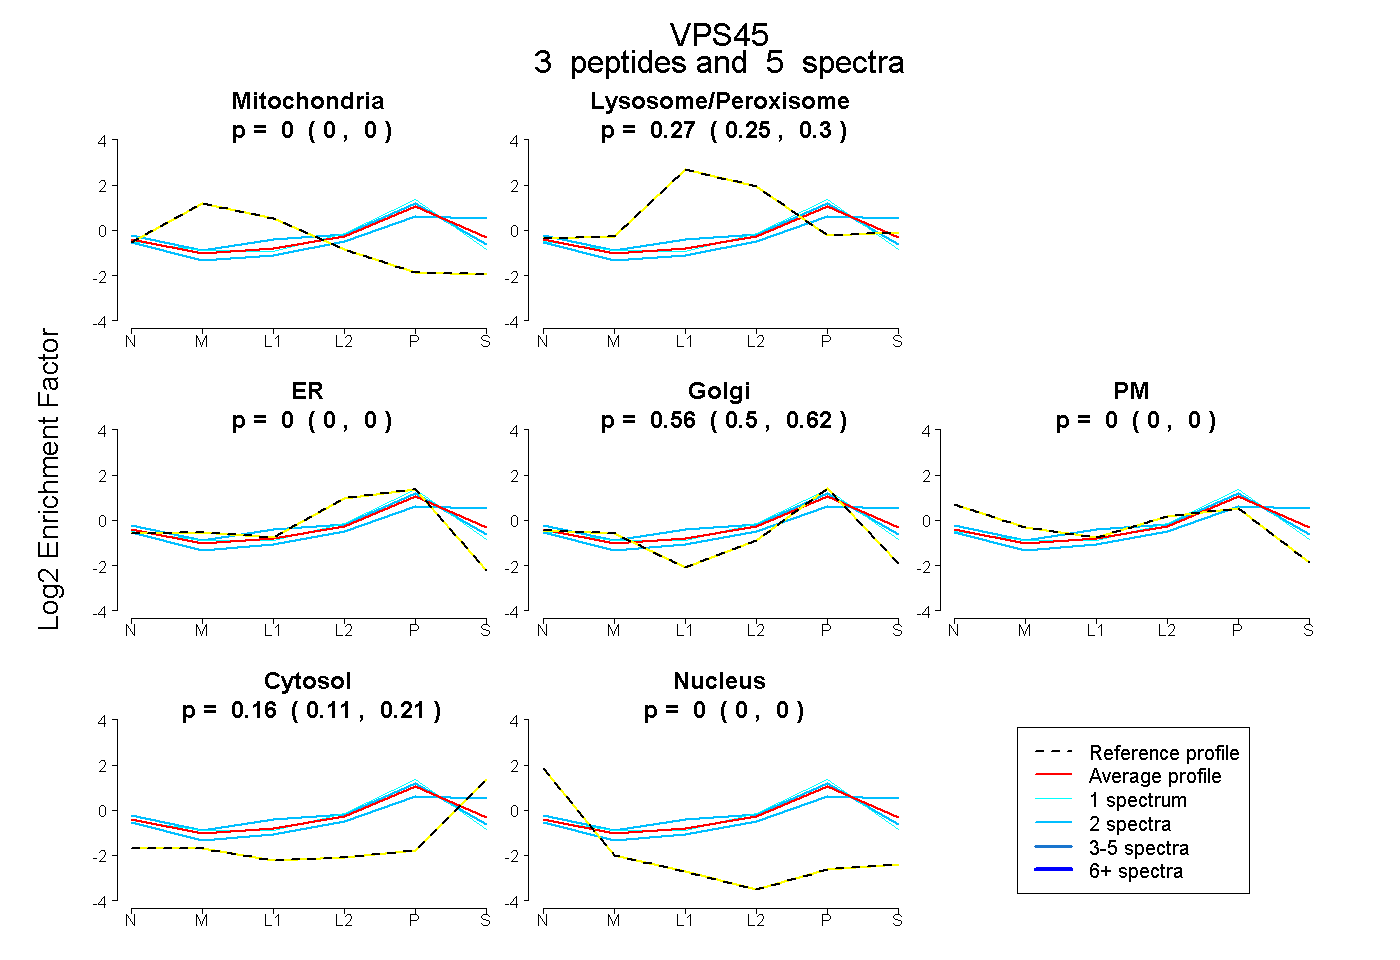 |
0.000 0.000 | 0.000 |
0.275 0.246 | 0.301 |
0.000 0.000 | 0.000 |
0.561 0.496 | 0.616 |
0.000 0.000 | 0.000 |
0.164 0.111 | 0.209 |
0.000 0.000 | 0.000 |
|||
| Plot | Lyso | Other | |||||||||||
| Expt C |
10 peptides |
20 spectra |
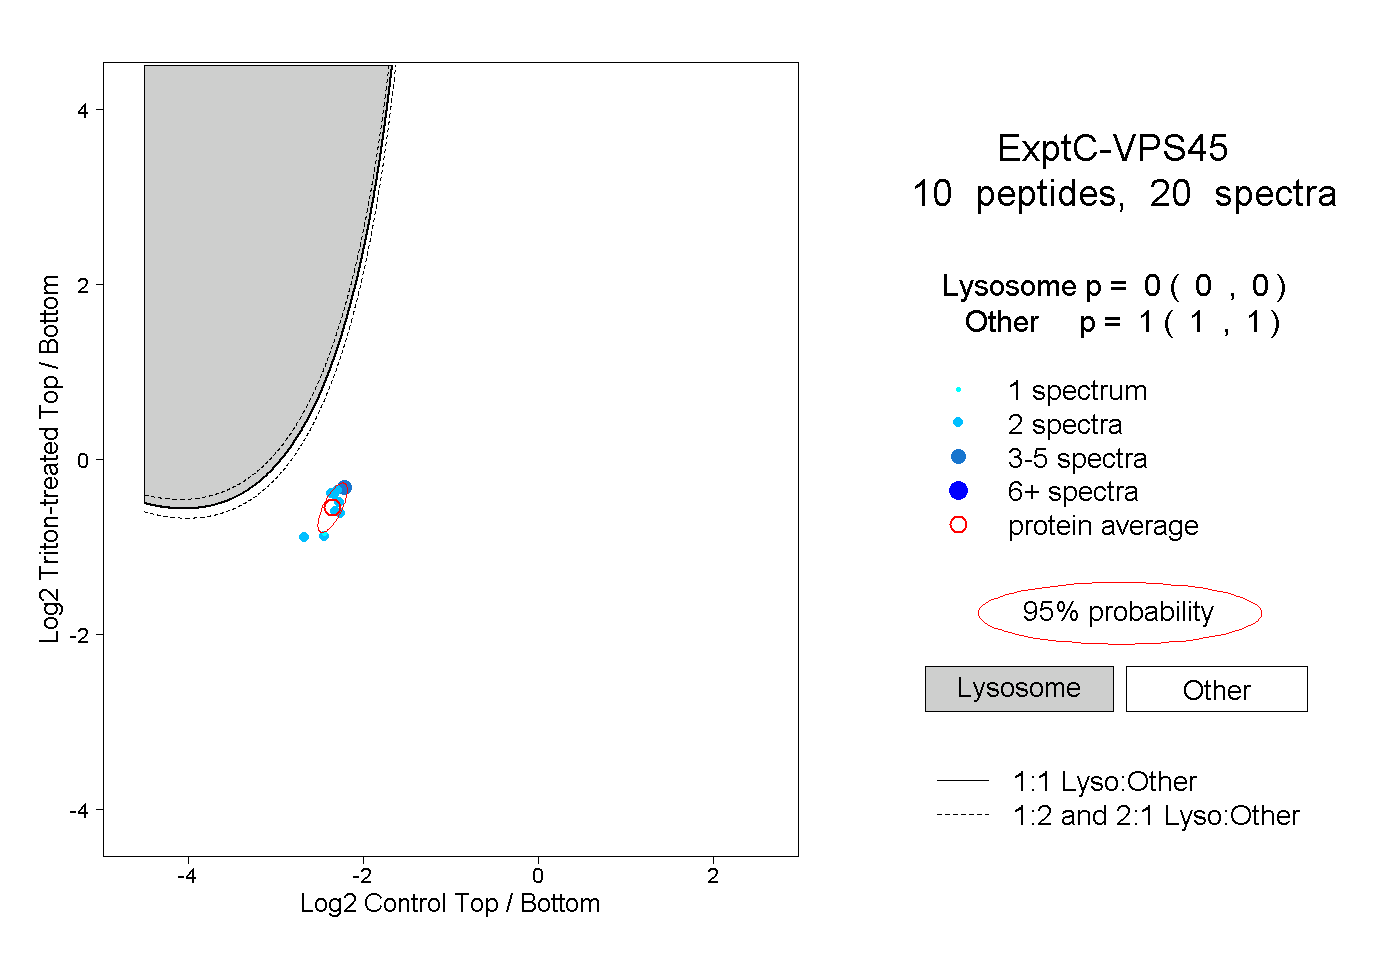 |
0.000 0.000 | 0.000 |
1.000 1.000 | 1.000 |
||||||||
| Plot | Lyso | Other | |||||||||||
| Expt D |
1 peptide |
2 spectra |
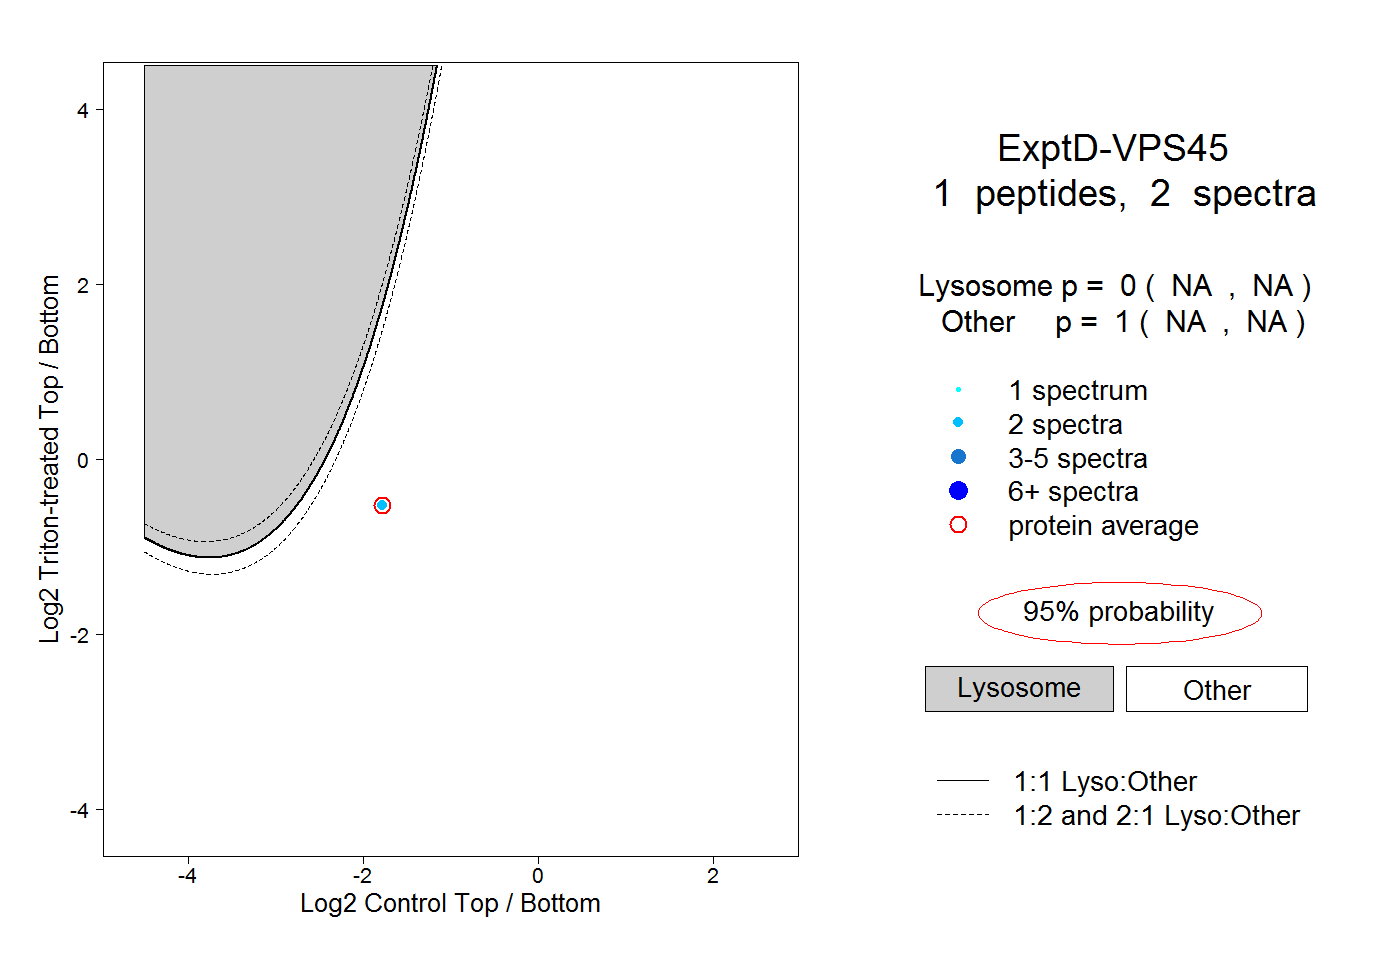 |
0.000 NA | NA |
1.000 NA | NA |