 5
5peptides
spectra
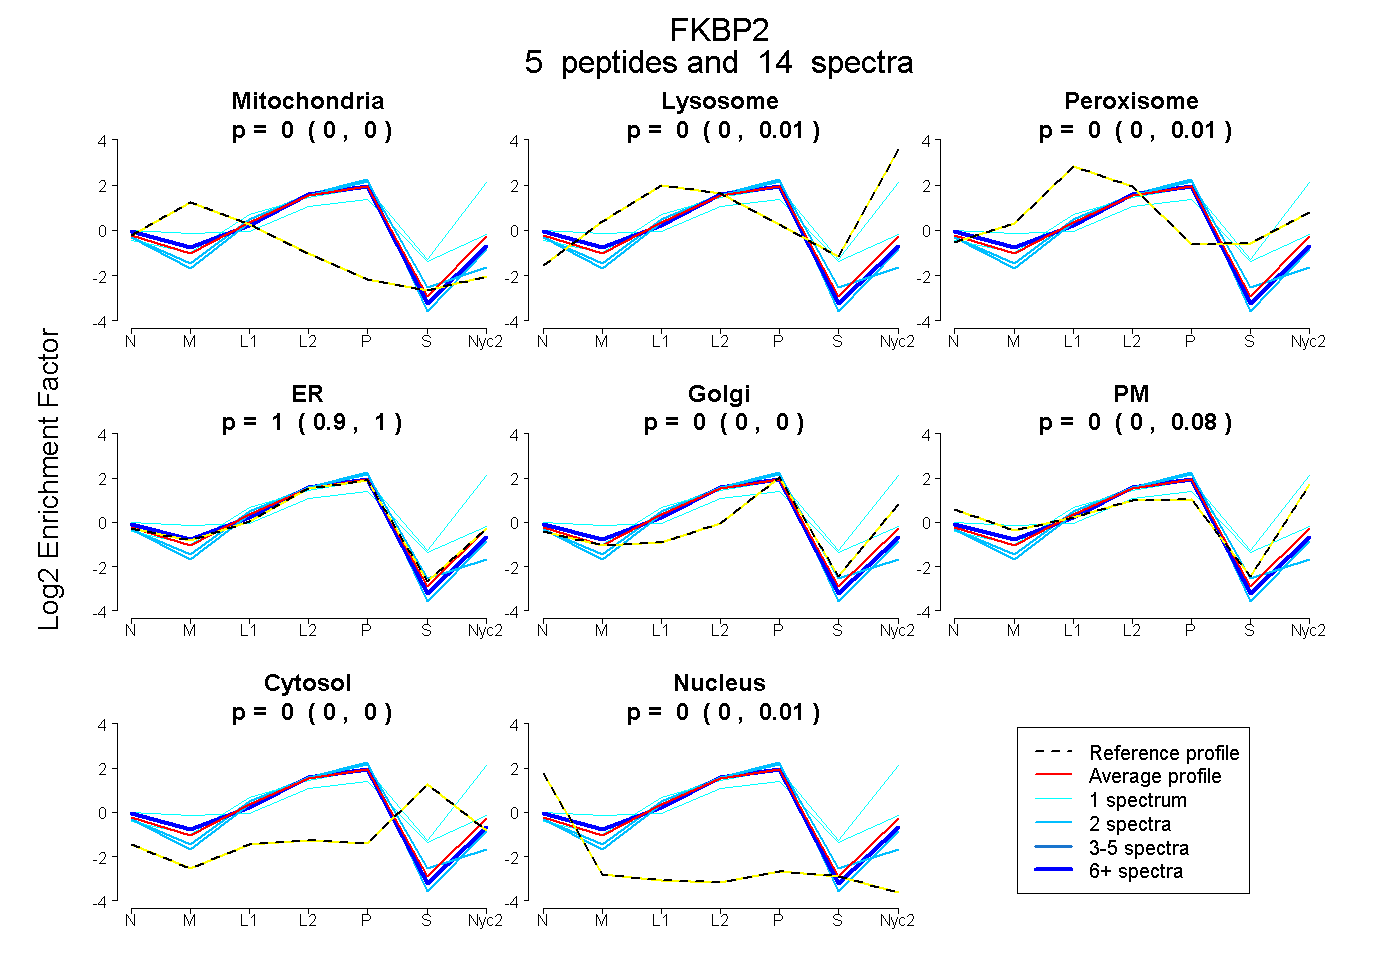
0.000 | 0.000
0.000 | 0.013
0.000 | 0.009
0.902 | 1.000
0.000 | 0.000
0.000 | 0.077
0.000 | 0.000
0.000 | 0.010
3peptides
spectra
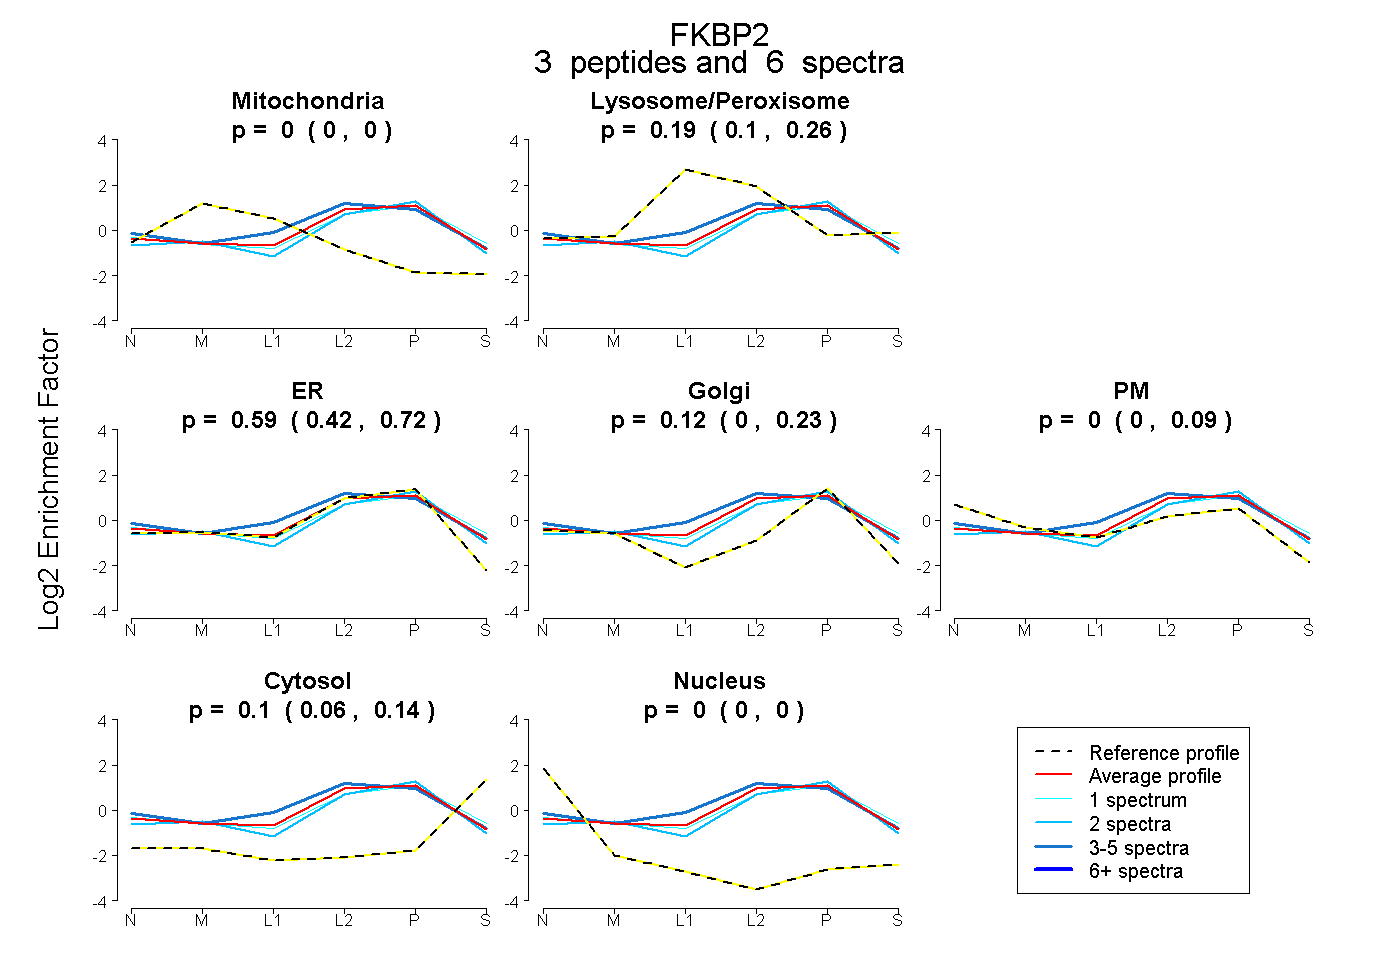
0.000 | 0.000
0.101 | 0.261
0.419 | 0.716
0.000 | 0.228
0.000 | 0.087
0.059 | 0.143
0.000 | 0.000
4peptides
spectra
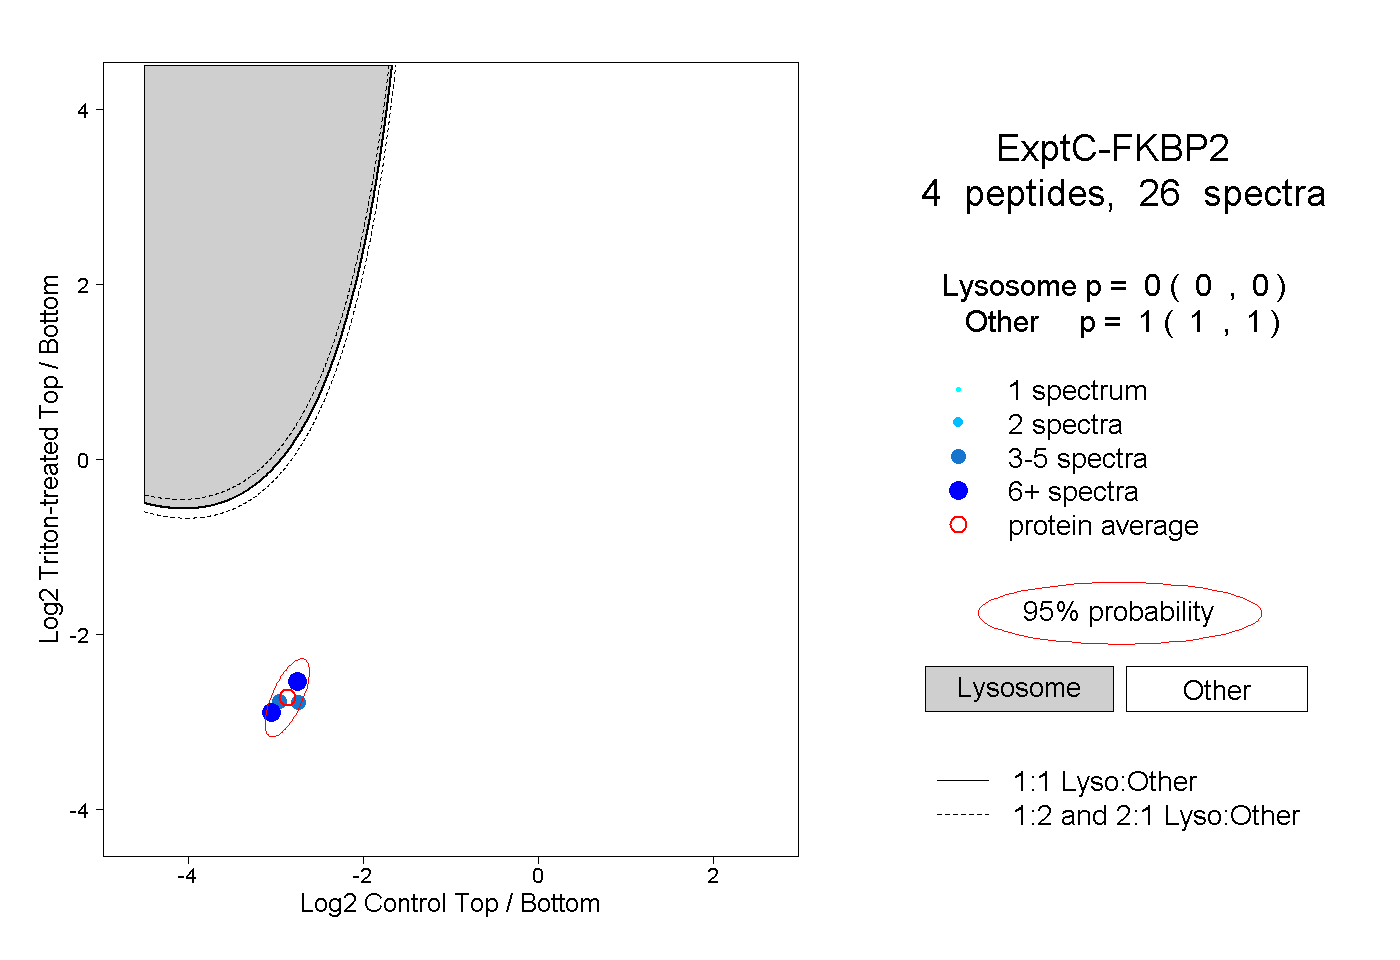
0.000 | 0.000
1.000 | 1.000
1peptide
spectra
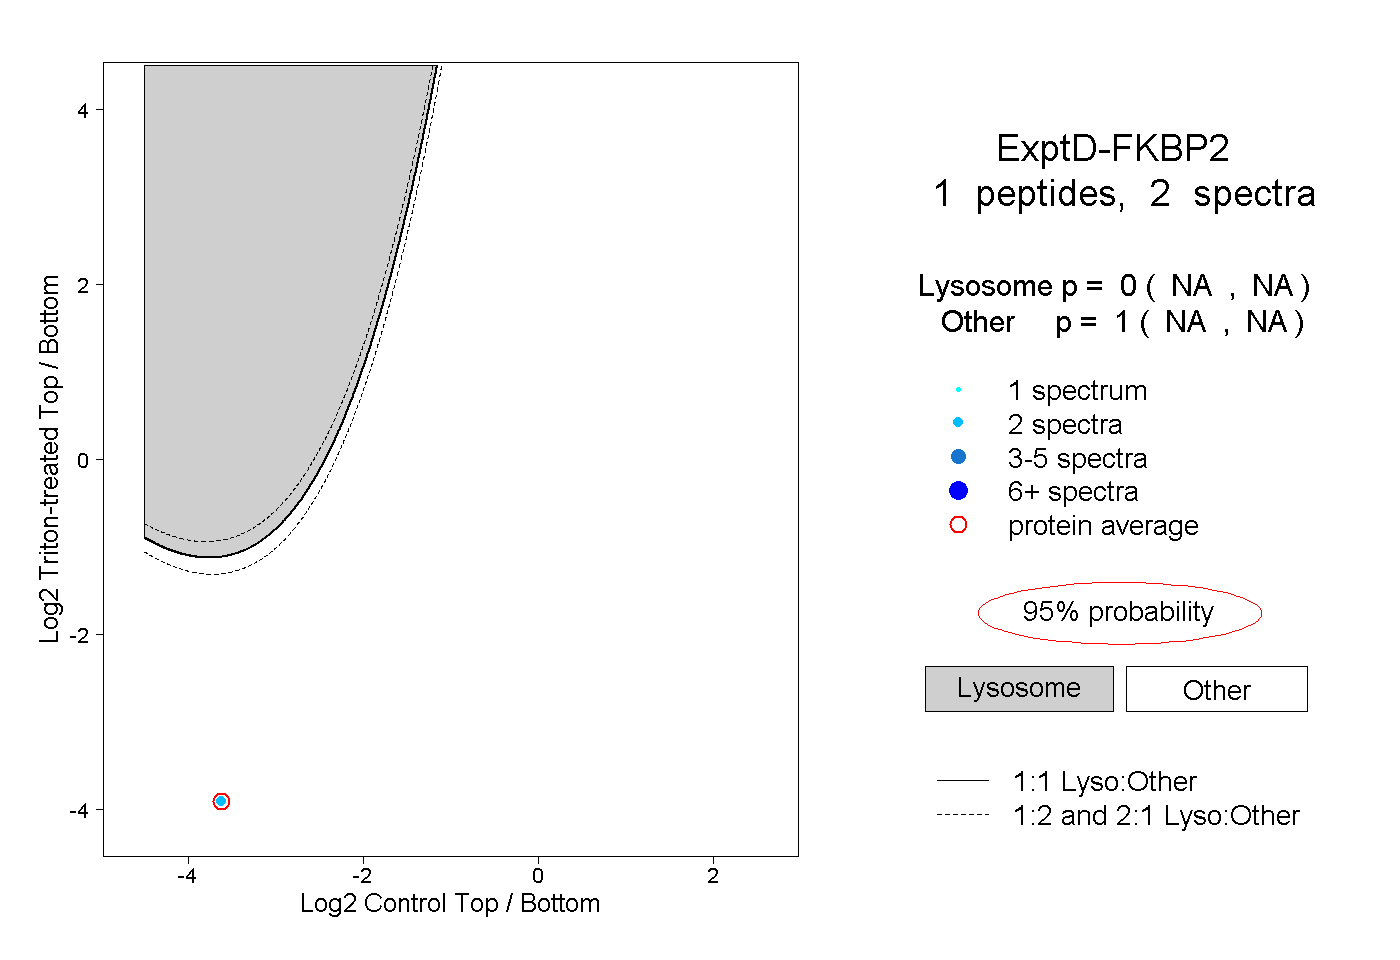
NA | NA
NA | NA