 5
5peptides
spectra
0.000 | 0.000
0.000 | 0.013
0.000 | 0.009
0.902 | 1.000
0.000 | 0.000
0.000 | 0.077
0.000 | 0.000
0.000 | 0.010
| Plot | Mito | Lyso | Perox | ER | Golgi | PM | Cytosol | Nucleus | |||||
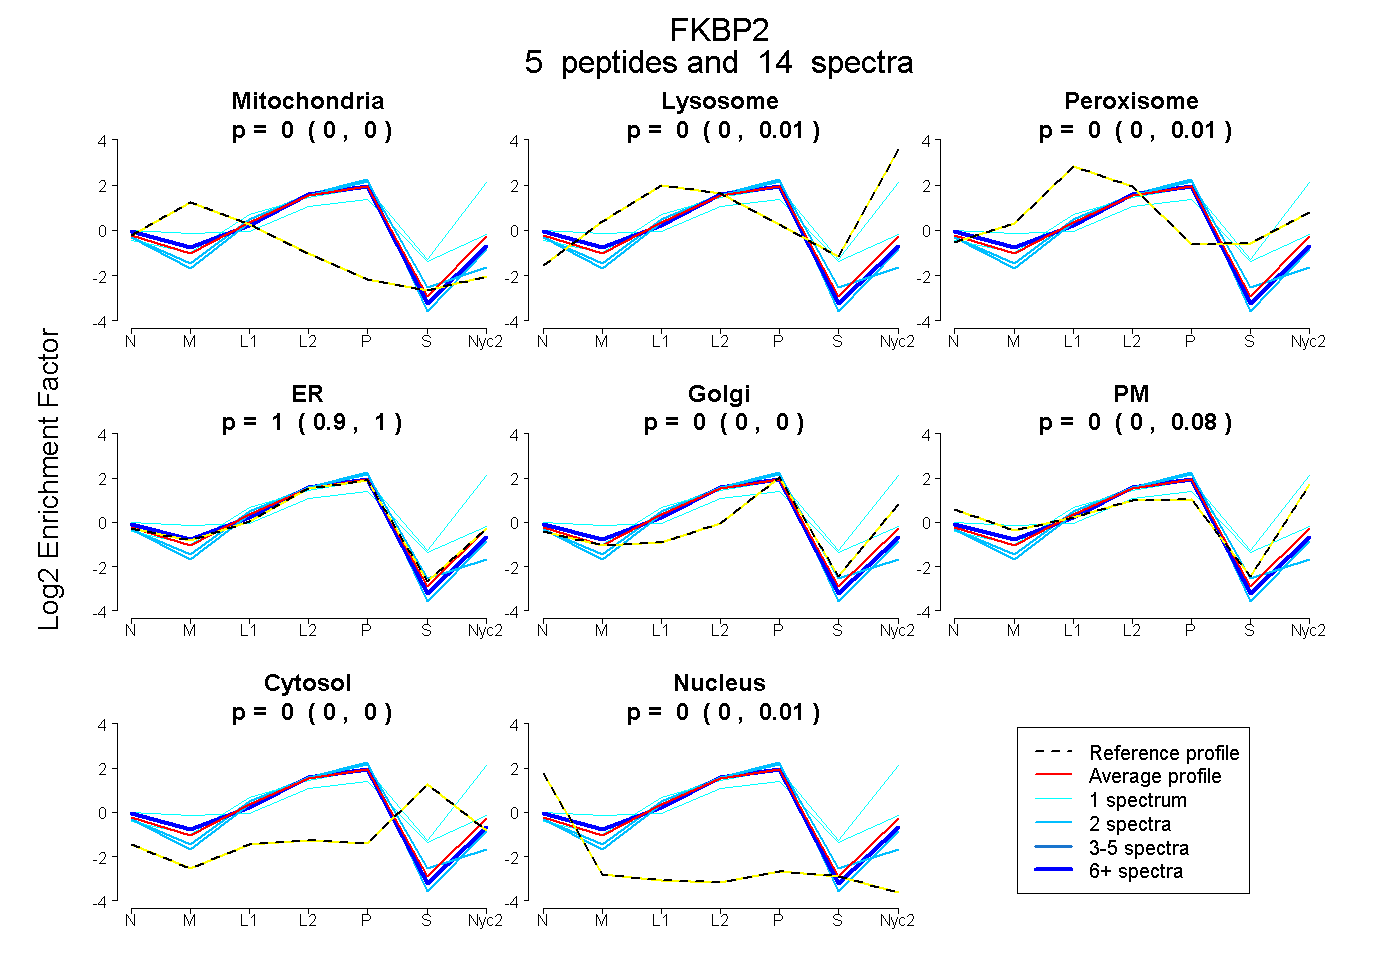
| Expt A |
5 peptides |
14 spectra |
|
0.000 0.000 | 0.000 |
0.000 0.000 | 0.013 |
0.000 0.000 | 0.009 |
1.000 0.902 | 1.000 |
0.000 0.000 | 0.000 |
0.000 0.000 | 0.077 |
0.000 0.000 | 0.000 |
0.000 0.000 | 0.010 |
| 2 spectra, GWDQGLLGMCEGEK | 0.000 | 0.000 | 0.000 | 0.993 | 0.000 | 0.000 | 0.000 | 0.007 | ||
| 2 spectra, VDHCPIK | 0.000 | 0.000 | 0.000 | 0.941 | 0.000 | 0.000 | 0.000 | 0.059 | ||
| 8 spectra, LVIPSELGYGER | 0.009 | 0.000 | 0.000 | 0.979 | 0.000 | 0.000 | 0.000 | 0.012 | ||
| 1 spectrum, IPGGATLVFEVELLK | 0.033 | 0.000 | 0.130 | 0.567 | 0.074 | 0.091 | 0.106 | 0.000 | ||
| 1 spectrum, LQIGVK | 0.000 | 0.424 | 0.000 | 0.222 | 0.297 | 0.057 | 0.000 | 0.000 |
| Plot | Mito | Lyso or Perox | ER | Golgi | PM | Cytosol | Nucleus | ||||||
| Expt B |
3 peptides |
6 spectra |
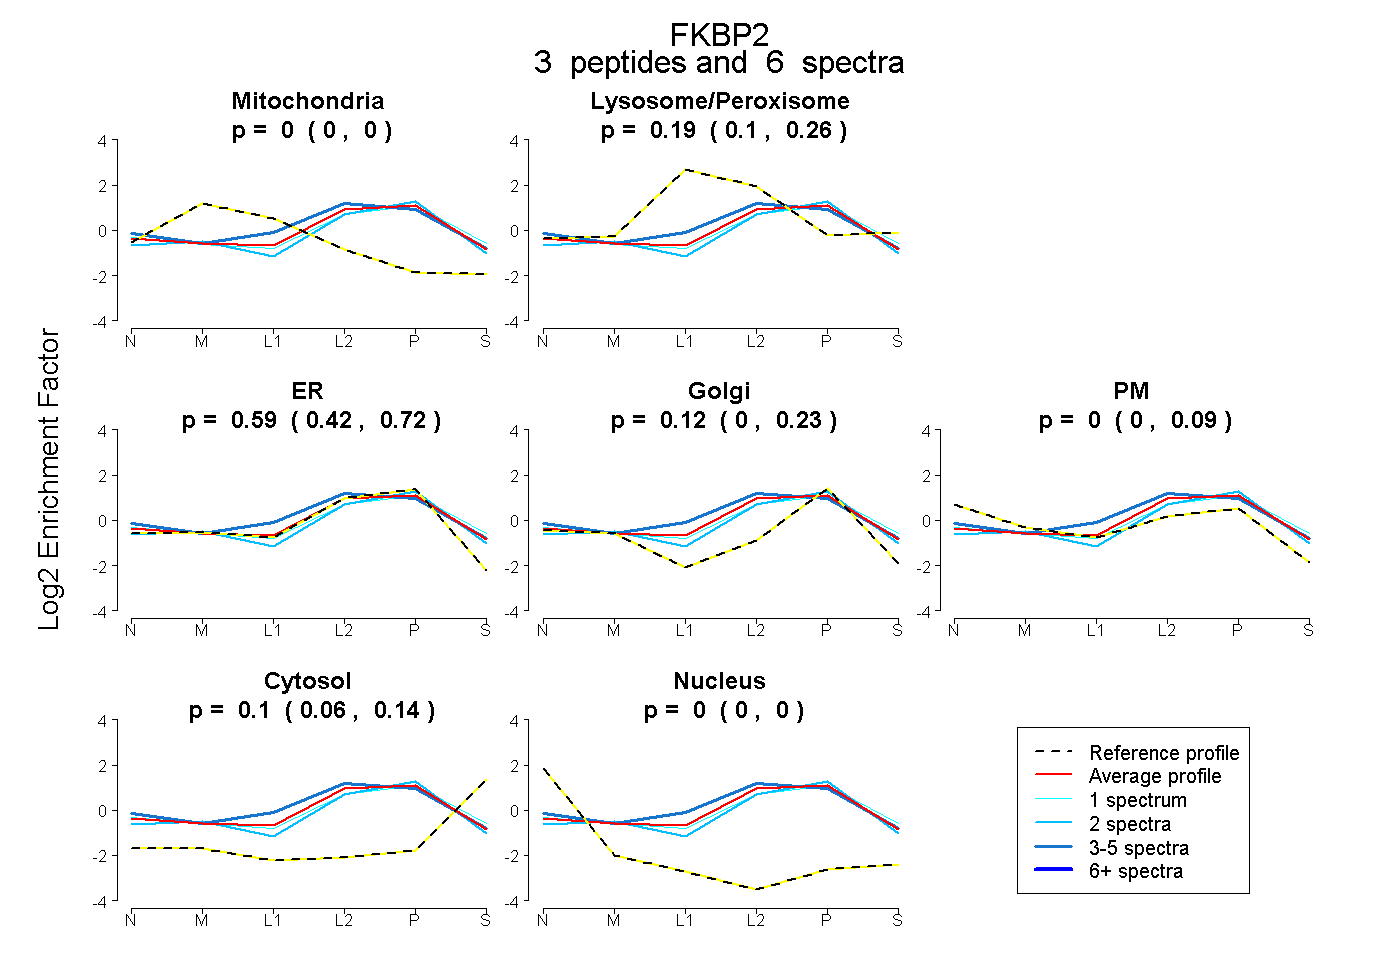 |
0.000 0.000 | 0.000 |
0.193 0.101 | 0.261 |
0.586 0.419 | 0.716 |
0.117 0.000 | 0.228 |
0.000 0.000 | 0.087 |
0.104 0.059 | 0.143 |
0.000 0.000 | 0.000 |
|||
| Plot | Lyso | Other | |||||||||||
| Expt C |
4 peptides |
26 spectra |
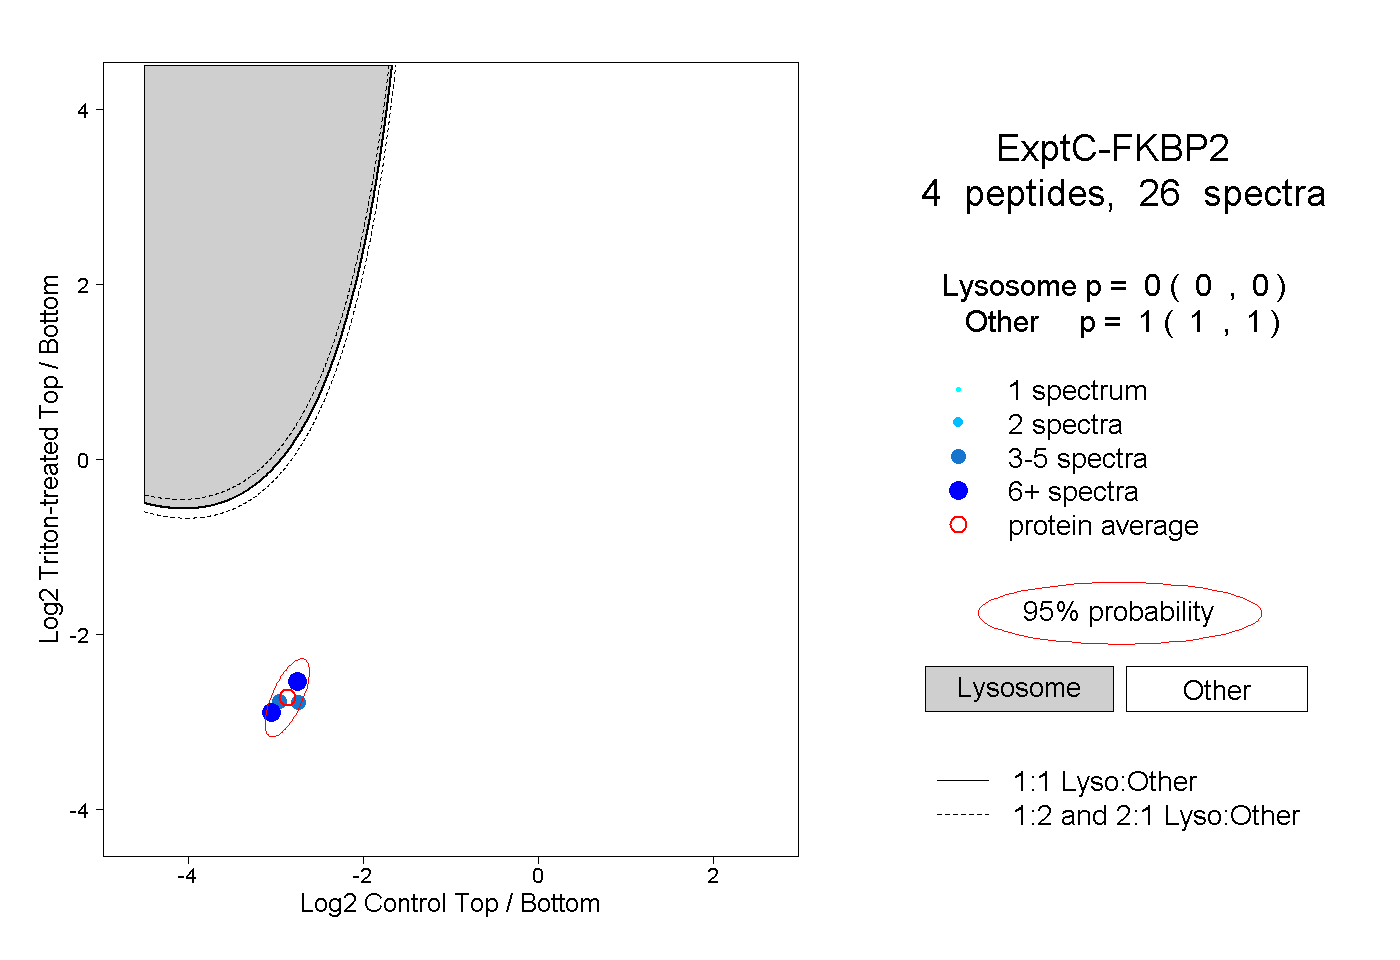 |
0.000 0.000 | 0.000 |
1.000 1.000 | 1.000 |
||||||||
| Plot | Lyso | Other | |||||||||||
| Expt D |
1 peptide |
2 spectra |
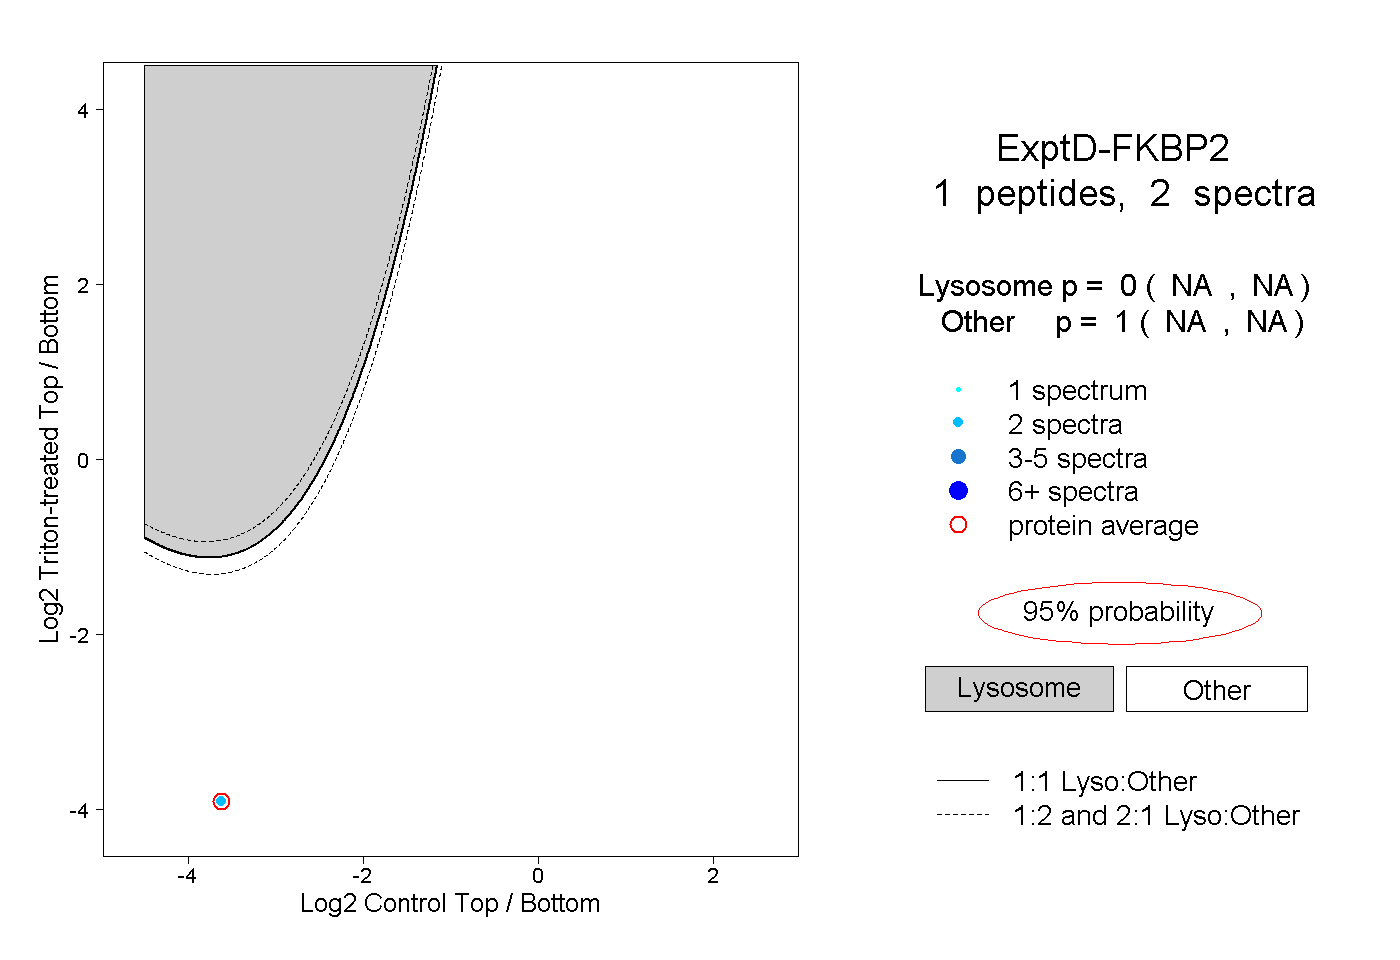 |
0.000 NA | NA |
1.000 NA | NA |