FKBP2
[ENSRNOP00000028725]
Main page
| | | Plot |
Mito |
Lyso |
|
Perox |
ER |
Golgi |
PM |
Cytosol |
Nucleus |
|
| Expt A |
 5
5
peptides |
14
spectra |
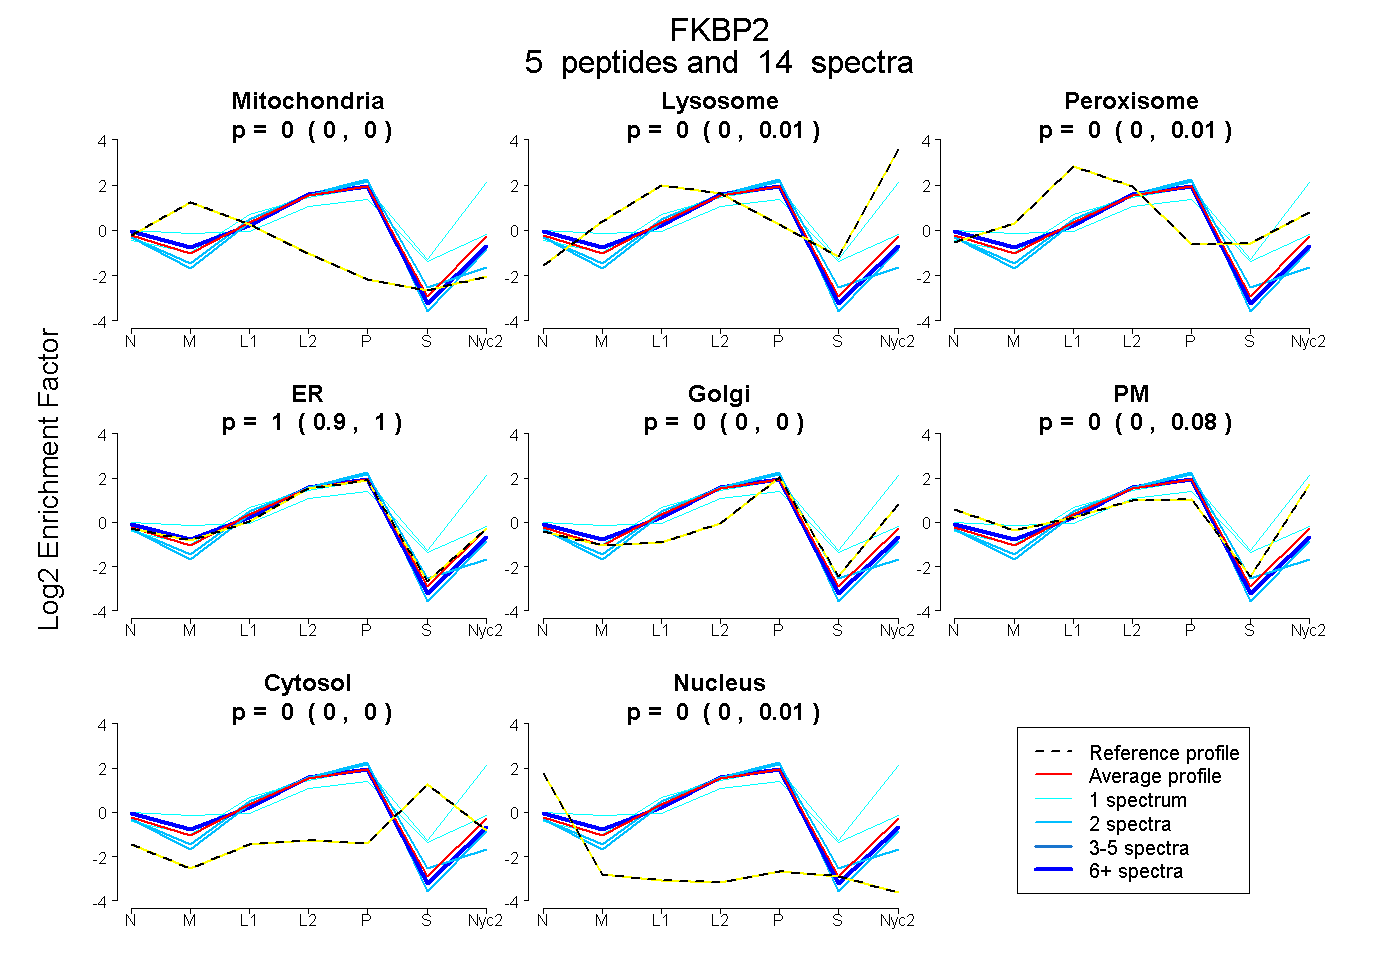 |
0.000
0.000 | 0.000 |
0.000
0.000 | 0.013 |
|
0.000
0.000 | 0.009 |
1.000
0.902 | 1.000 |
0.000
0.000 | 0.000 |
0.000
0.000 | 0.077 |
0.000
0.000 | 0.000 |
0.000
0.000 | 0.010 |
|
| | | Plot |
Mito |
|
Lyso or Perox |
|
ER |
Golgi |
PM |
Cytosol |
Nucleus |
|
| Expt B |
3
peptides |
6
spectra |
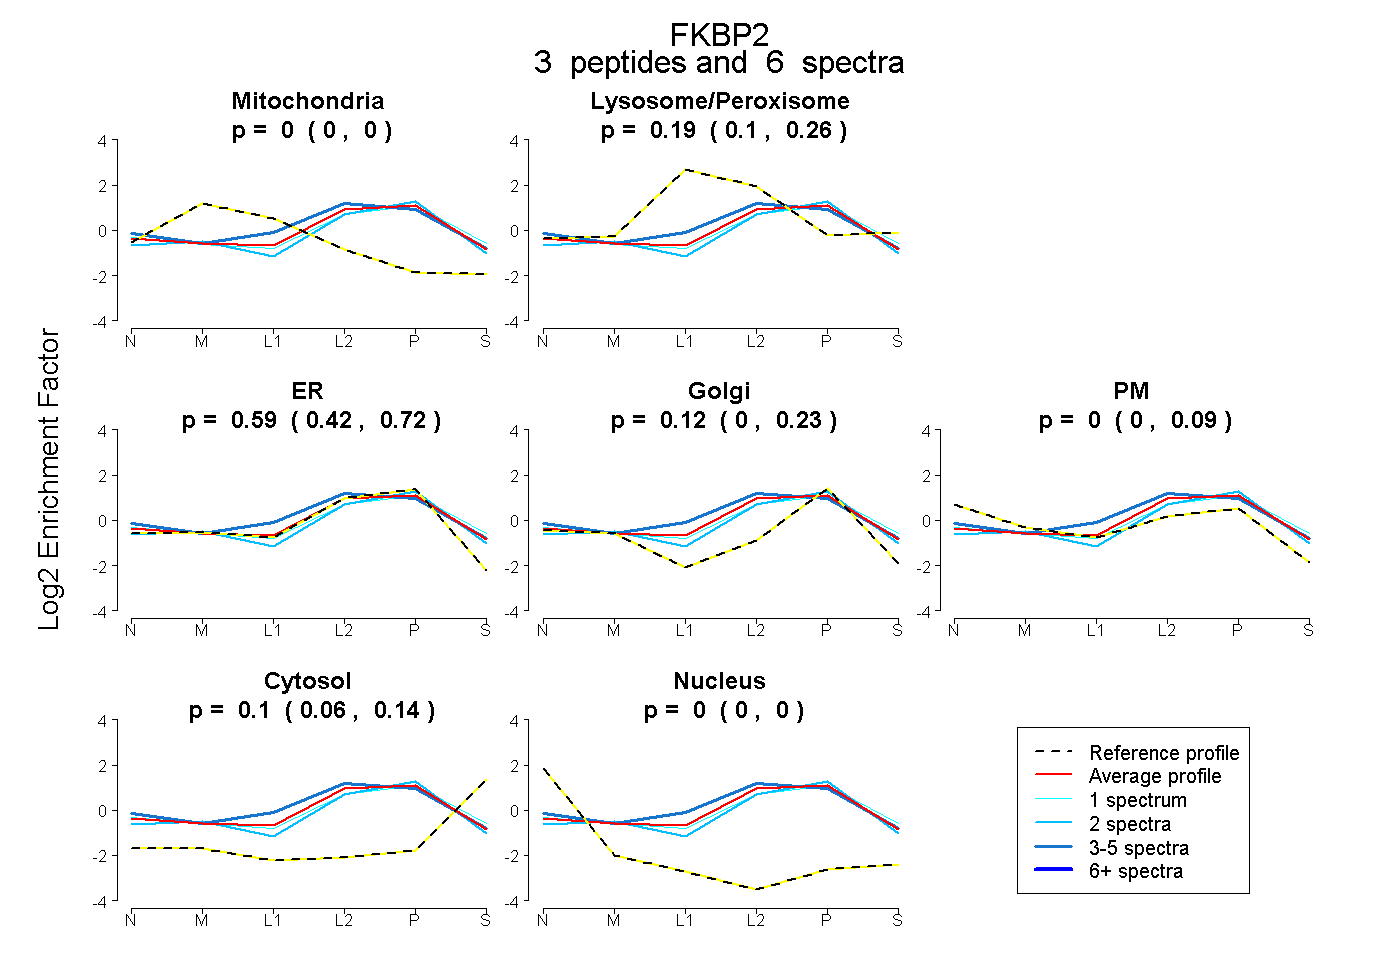 |
0.000
0.000 | 0.000 |
|
0.193
0.101 | 0.261 |
|
0.586
0.419 | 0.716 |
0.117
0.000 | 0.228 |
0.000
0.000 | 0.087 |
0.104
0.059 | 0.143 |
0.000
0.000 | 0.000 |
|
| 3 spectra, VDHCPIK |
0.000 |
|
0.295 |
|
0.495 |
0.027 |
0.117 |
0.066 |
0.000 |
|
| 2 spectra, LVIPSELGYGER |
0.000 |
|
0.052 |
|
0.710 |
0.108 |
0.000 |
0.131 |
0.000 |
|
| 1 spectrum, LQIGVK |
0.000 |
|
0.231 |
|
0.377 |
0.281 |
0.000 |
0.111 |
0.000 |
|
| | | Plot |
|
Lyso |
|
|
|
|
|
|
|
Other |
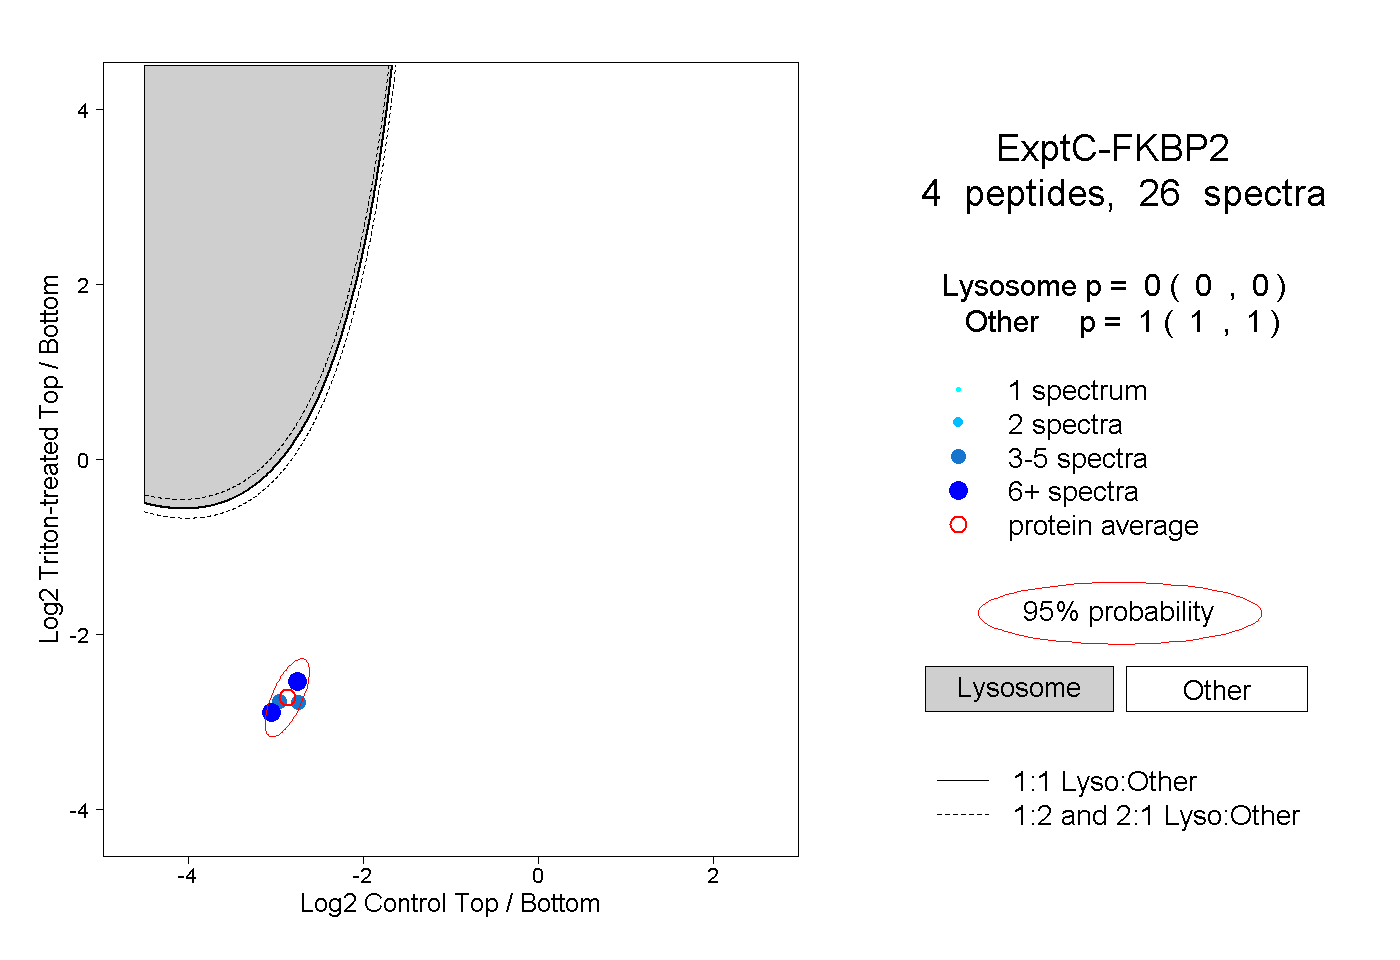
| Expt C |
4
peptides |
26
spectra |
 |
|
0.000
0.000 | 0.000 |
|
|
|
|
|
|
|
1.000
1.000 | 1.000 |
| | | Plot |
|
Lyso |
|
|
|
|
|
|
|
Other |
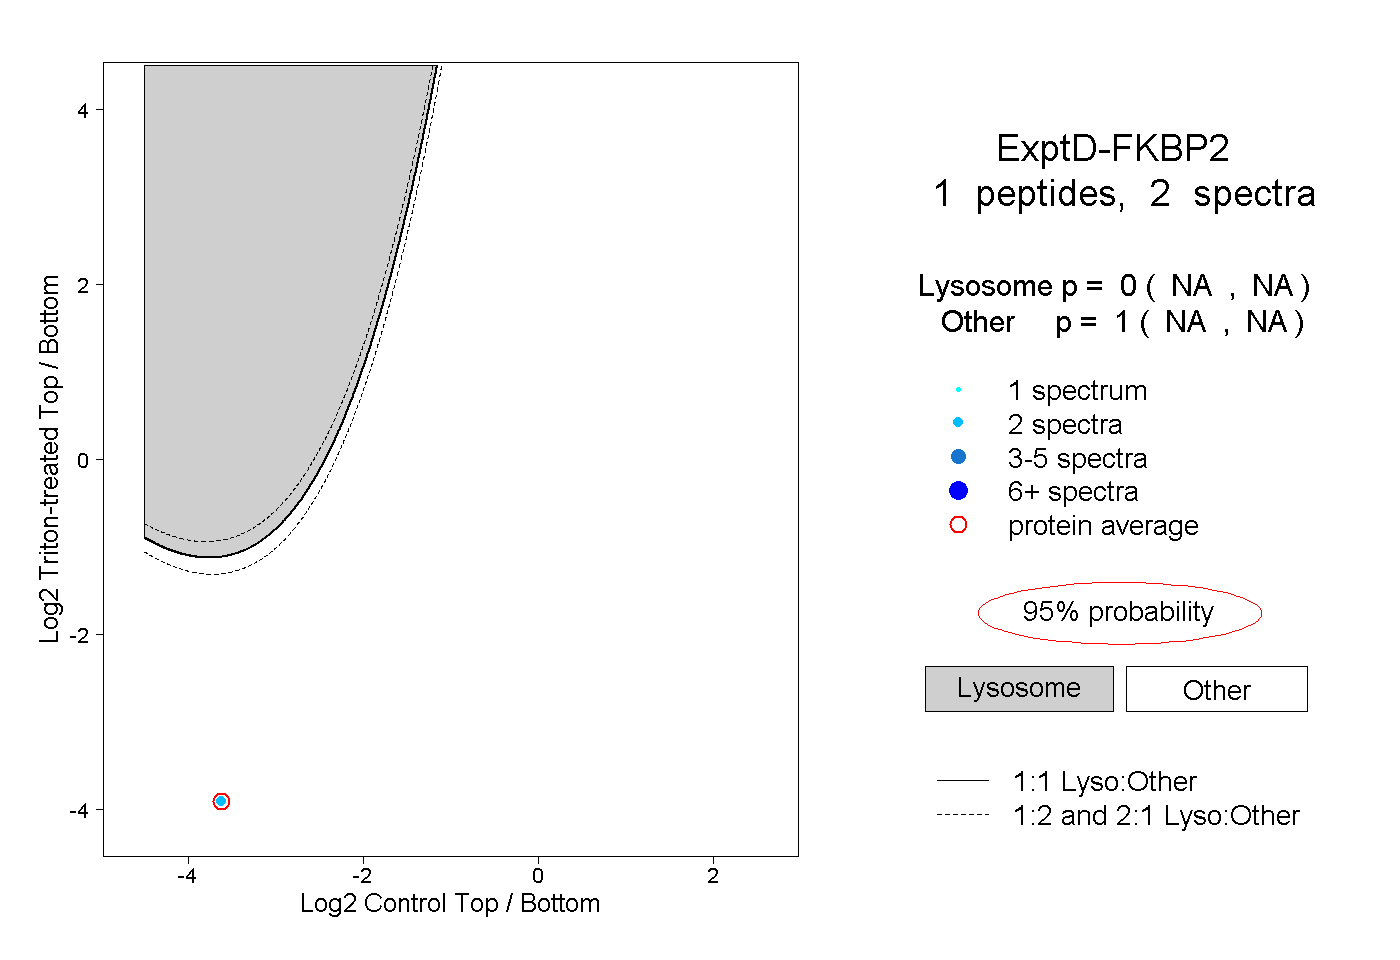
| Expt D |
1
peptide |
2
spectra |
 |
|
0.000
NA | NA |
|
|
|
|
|
|
|
1.000
NA | NA |