 11
11peptides
spectra
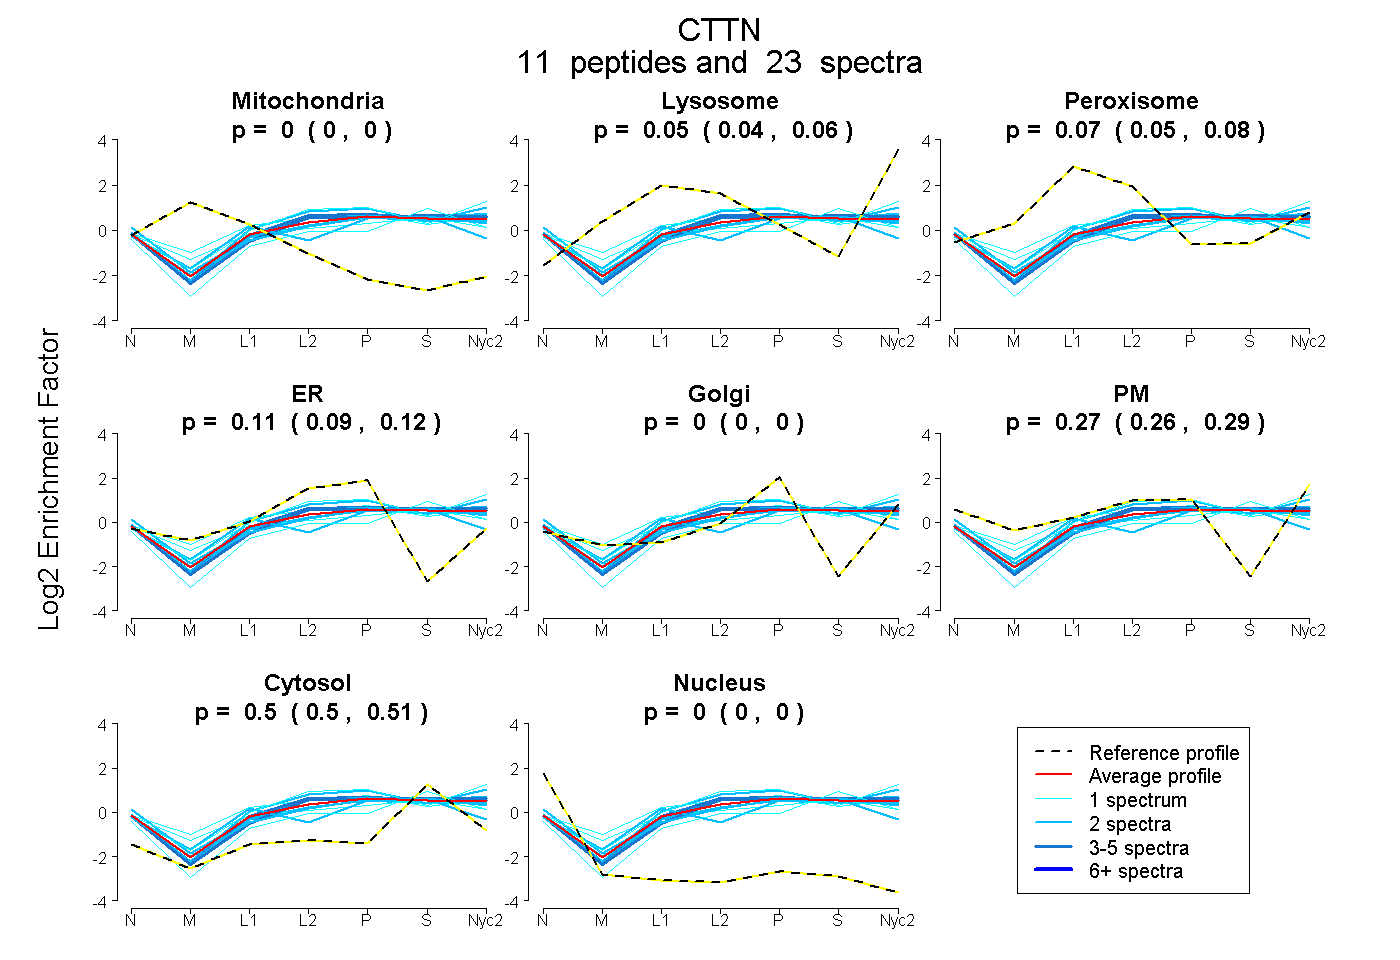
0.000 | 0.000
0.038 | 0.063
0.050 | 0.078
0.093 | 0.124
0.000 | 0.000
0.256 | 0.286
0.496 | 0.508
0.000 | 0.000
5peptides
spectra
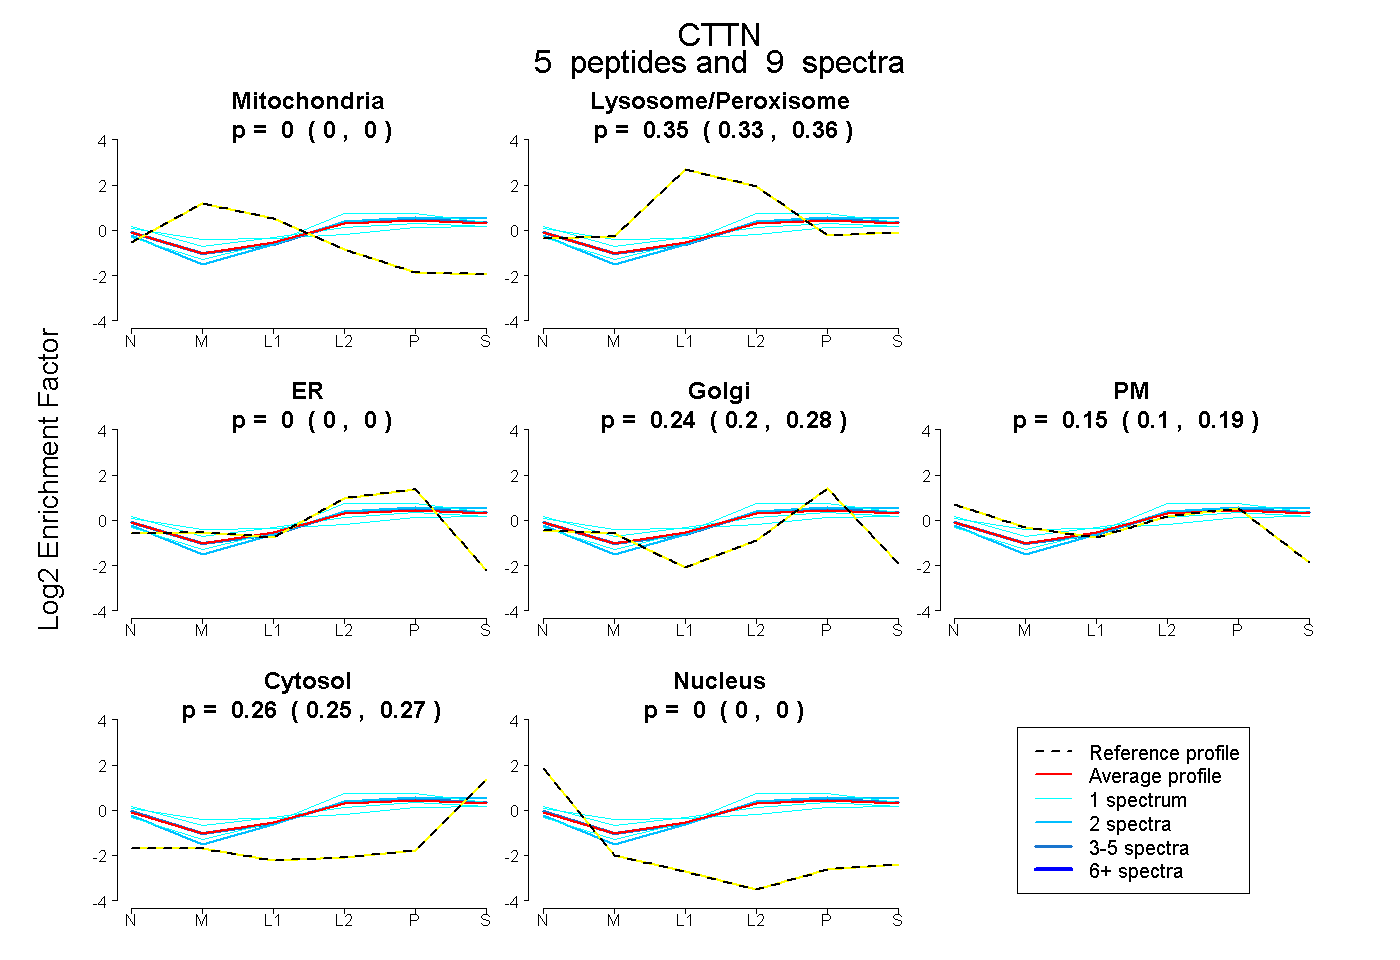
0.000 | 0.000
0.330 | 0.363
0.000 | 0.002
0.195 | 0.276
0.102 | 0.191
0.245 | 0.272
0.000 | 0.000
14peptides
spectra
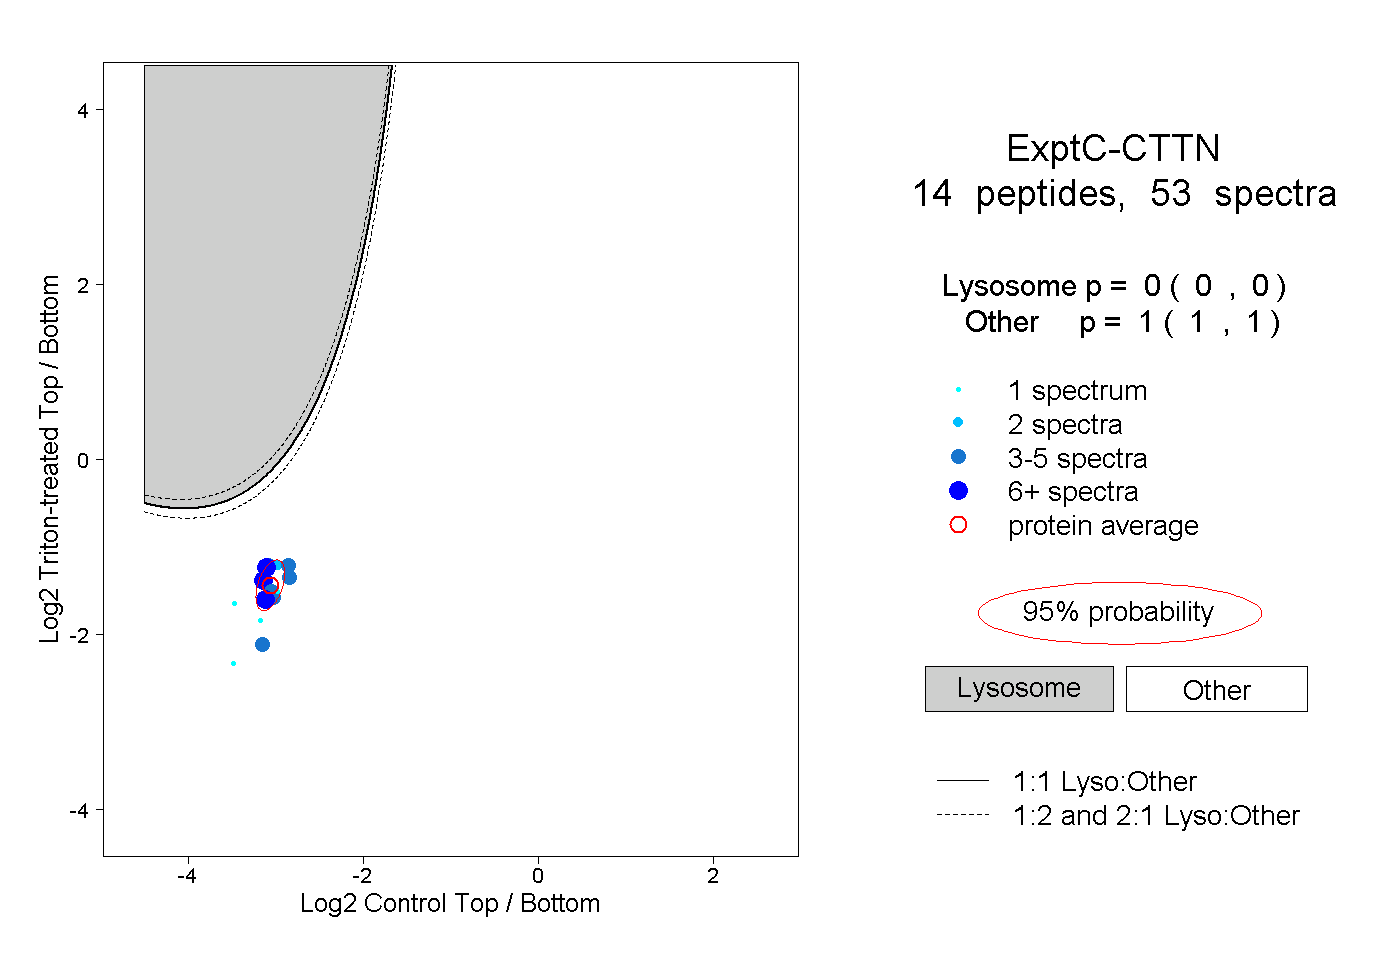
0.000 | 0.000
1.000 | 1.000
4peptides
spectra
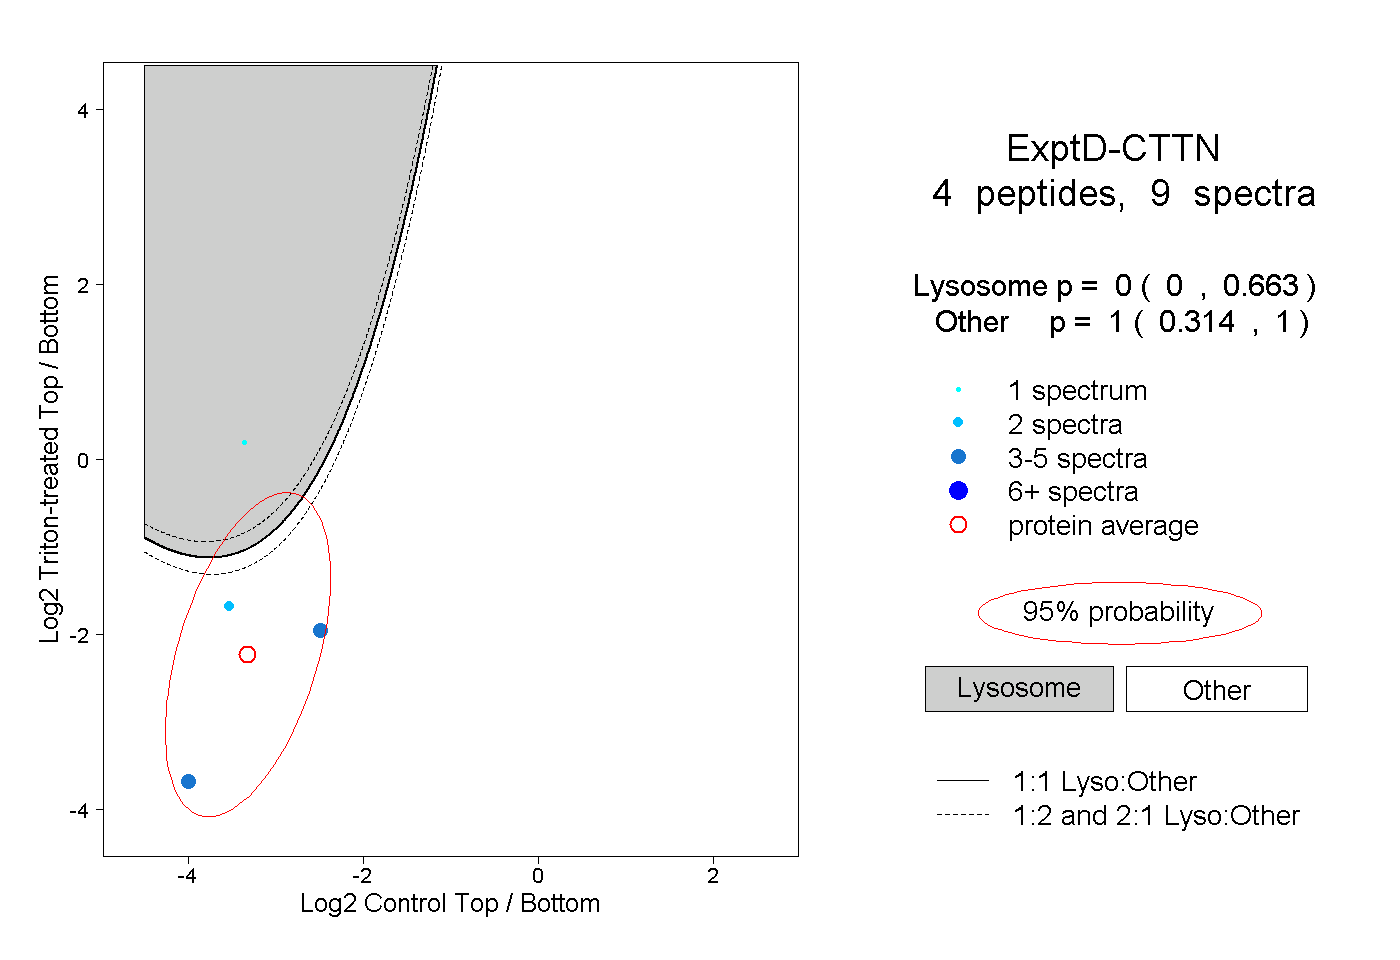
0.000 | 0.663
0.314 | 1.000