CTTN
[ENSRNOP00000028283]
Main page
| | | Plot |
Mito |
Lyso |
|
Perox |
ER |
Golgi |
PM |
Cytosol |
Nucleus |
|
| Expt A |
 11
11
peptides |
23
spectra |
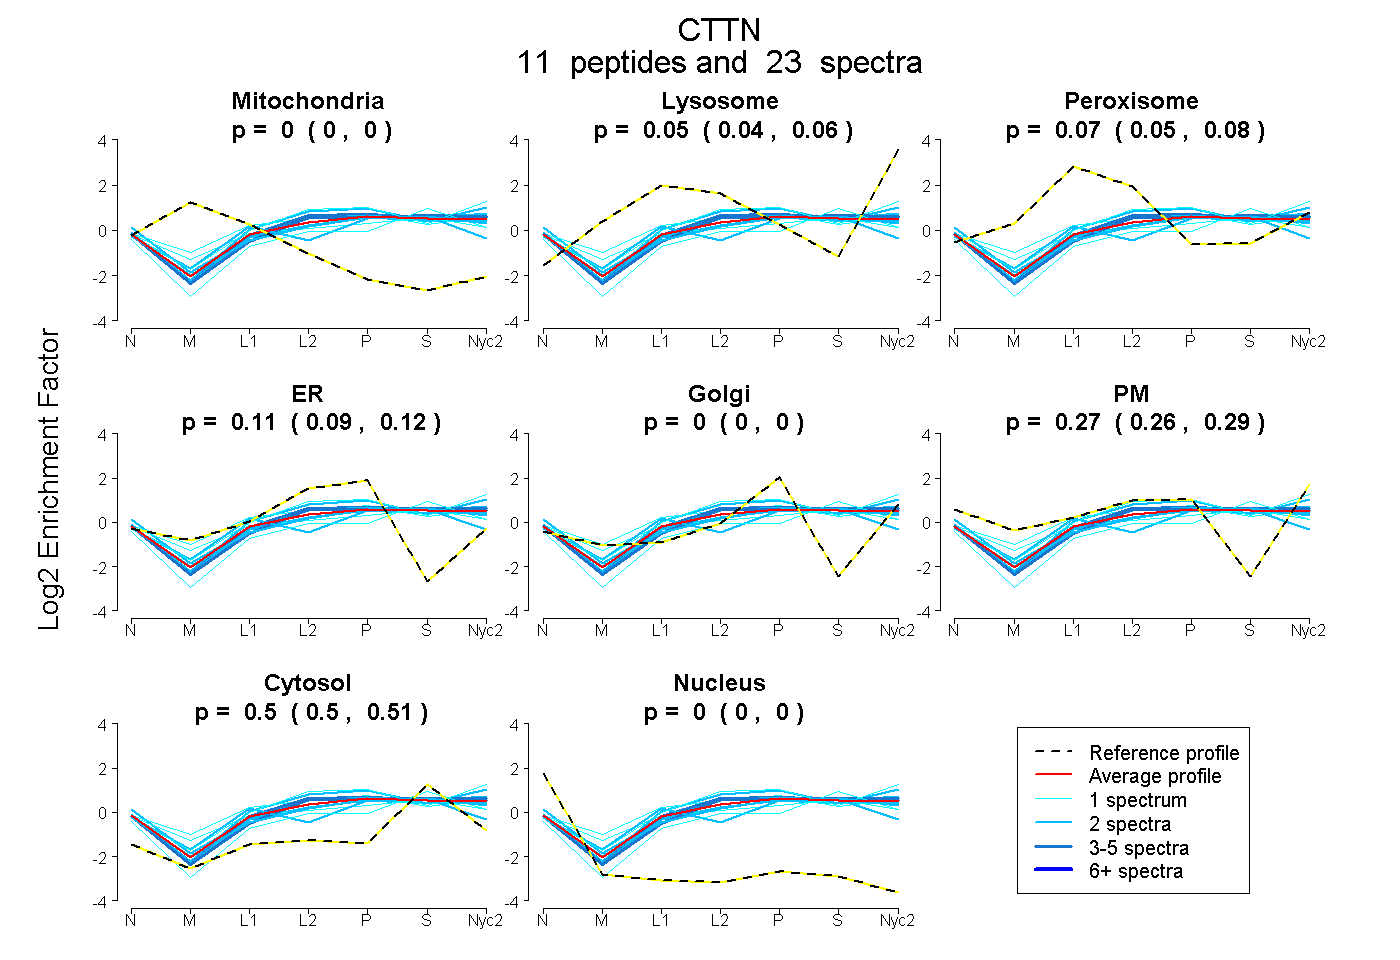 |
0.000
0.000 | 0.000 |
0.051
0.038 | 0.063 |
|
0.065
0.050 | 0.078 |
0.110
0.093 | 0.124 |
0.000
0.000 | 0.000 |
0.271
0.256 | 0.286 |
0.502
0.496 | 0.508 |
0.000
0.000 | 0.000 |
|
| | | Plot |
Mito |
|
Lyso or Perox |
|
ER |
Golgi |
PM |
Cytosol |
Nucleus |
|
| Expt B |
5
peptides |
9
spectra |
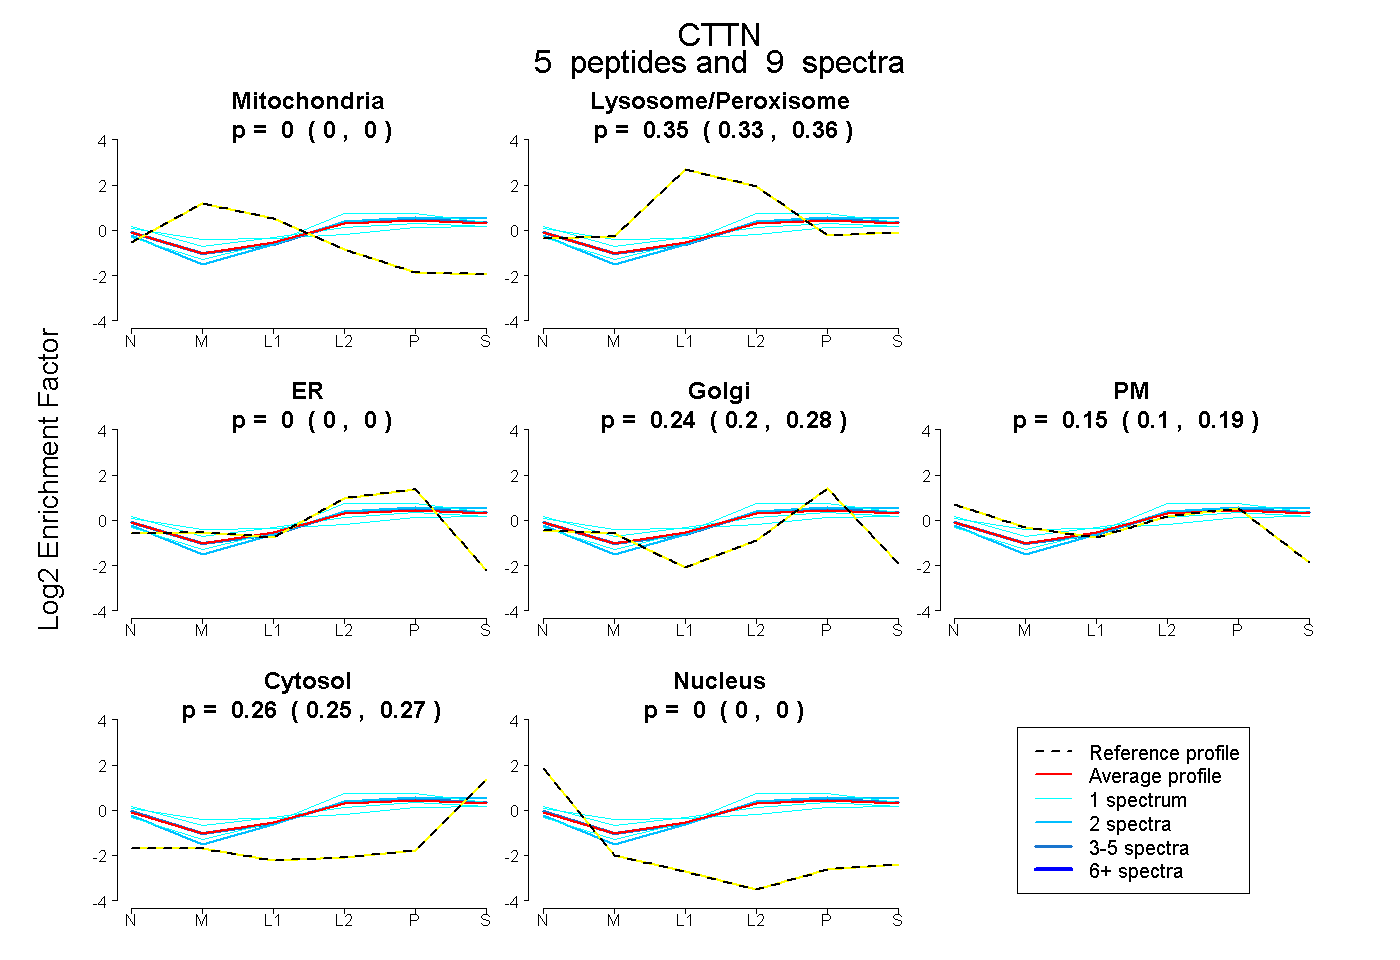 |
0.000
0.000 | 0.000 |
|
0.348
0.330 | 0.363 |
|
0.000
0.000 | 0.002 |
0.241
0.195 | 0.276 |
0.150
0.102 | 0.191 |
0.260
0.245 | 0.272 |
0.000
0.000 | 0.000 |
|
| 1 spectrum, YGLFPANYVELR |
0.000 |
|
0.299 |
|
0.367 |
0.047 |
0.000 |
0.287 |
0.000 |
|
| 2 spectra, FGVQTDR |
0.000 |
|
0.324 |
|
0.177 |
0.178 |
0.000 |
0.321 |
0.000 |
|
| 1 spectrum, SAVGFEYQGK |
0.000 |
|
0.304 |
|
0.000 |
0.081 |
0.367 |
0.249 |
0.000 |
|
| 1 spectrum, ELETGPK |
0.000 |
|
0.271 |
|
0.000 |
0.037 |
0.402 |
0.291 |
0.000 |
|
| 4 spectra, FGVEQDR |
0.000 |
|
0.346 |
|
0.000 |
0.242 |
0.151 |
0.261 |
0.000 |
|
| | | Plot |
|
Lyso |
|
|
|
|
|
|
|
Other |
| Expt C |
14
peptides |
53
spectra |
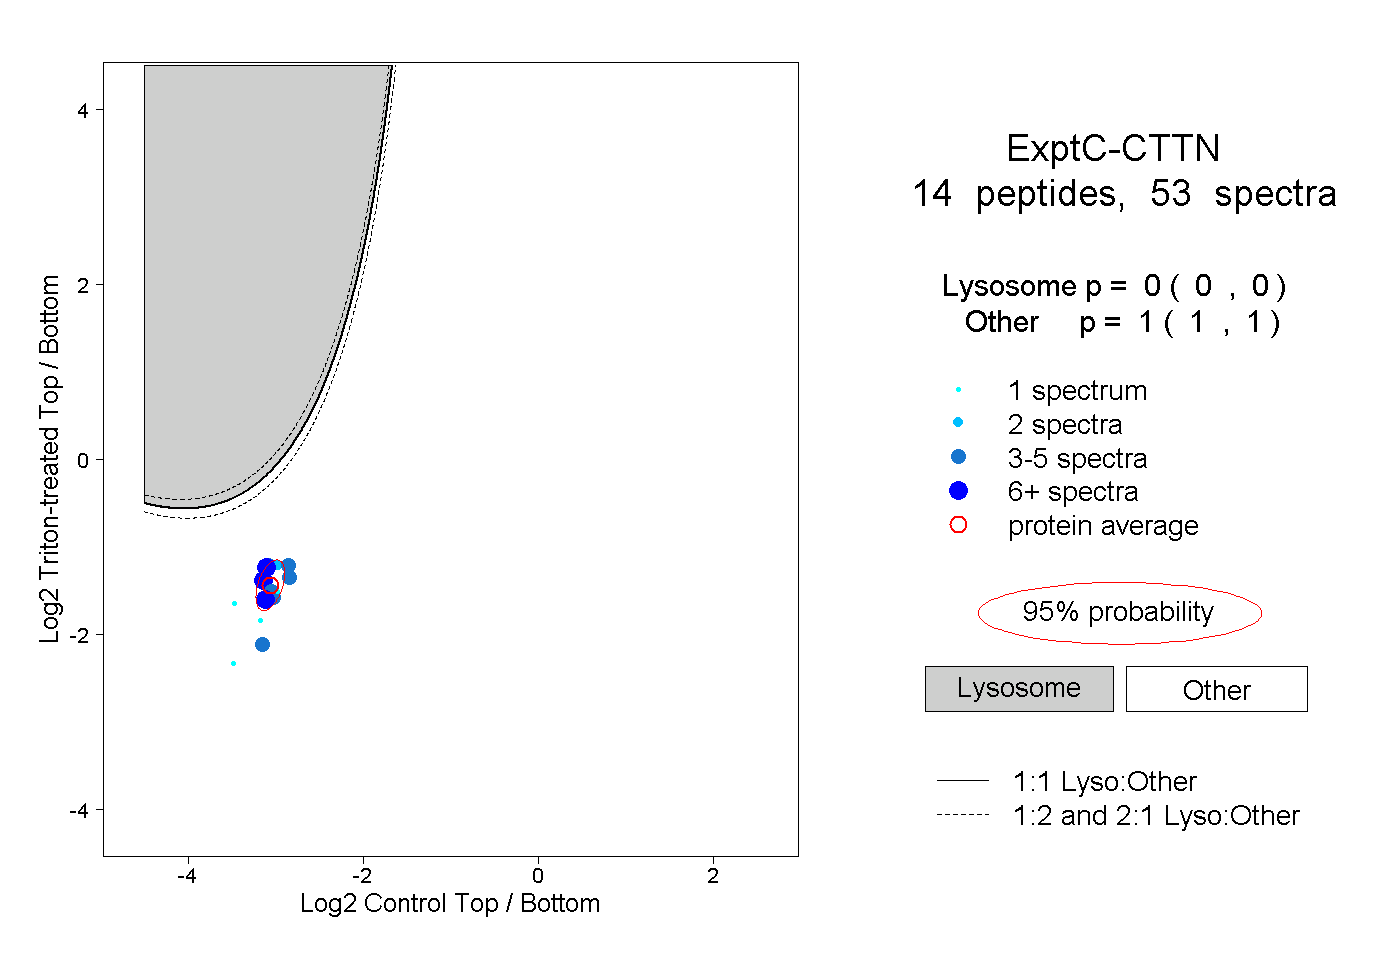 |
|
0.000
0.000 | 0.000 |
|
|
|
|
|
|
|
1.000
1.000 | 1.000 |
| | | Plot |
|
Lyso |
|
|
|
|
|
|
|
Other |
| Expt D |
4
peptides |
9
spectra |
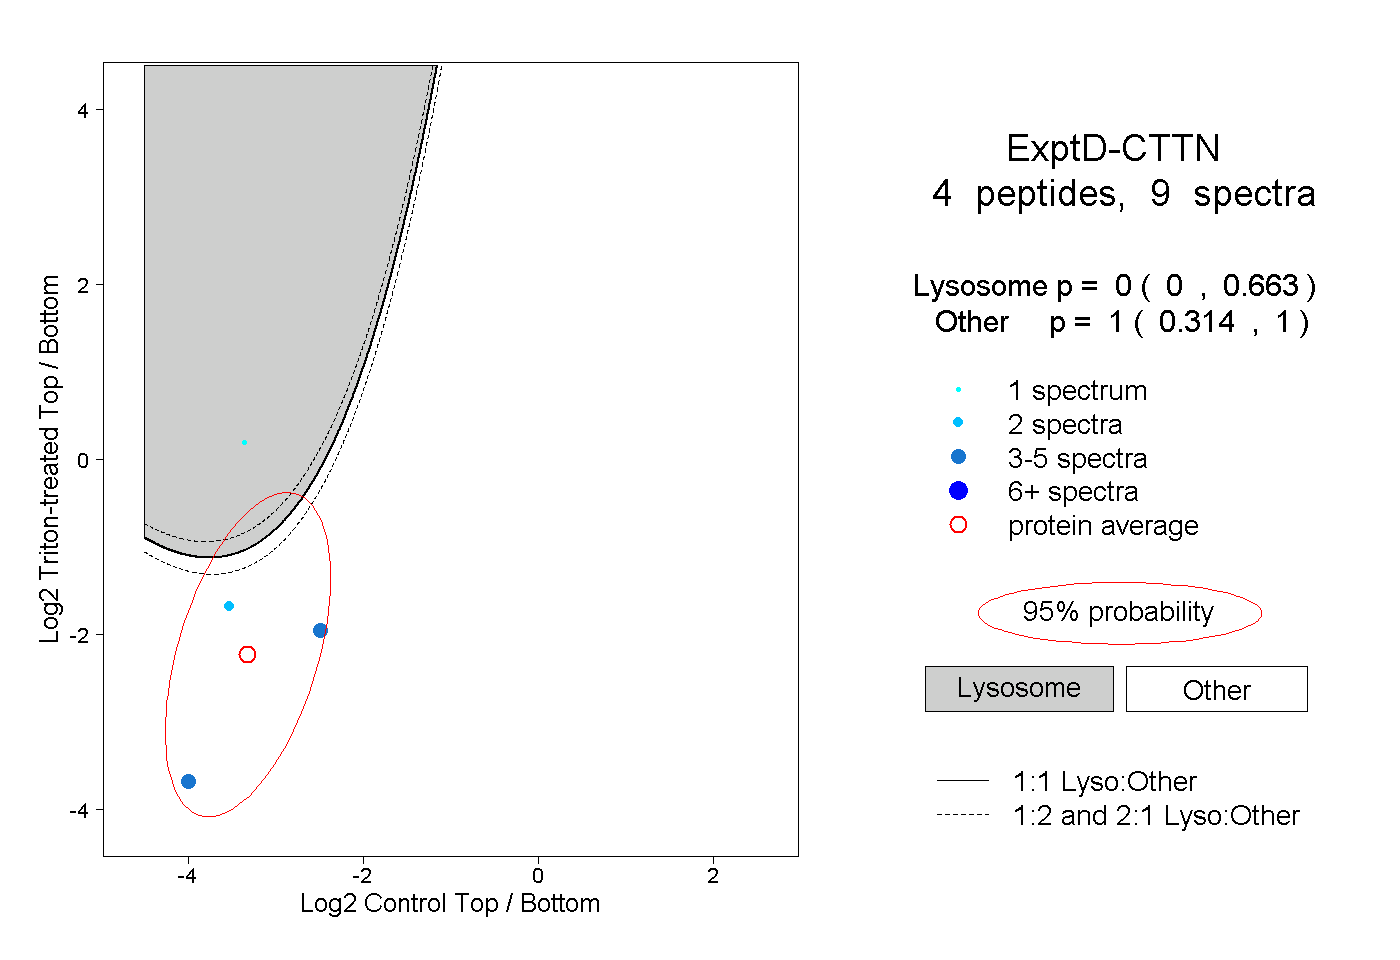 |
|
0.000
0.000 | 0.663 |
|
|
|
|
|
|
|
1.000
0.314 | 1.000 |