 11
11peptides
spectra
0.000 | 0.000
0.038 | 0.063
0.050 | 0.078
0.093 | 0.124
0.000 | 0.000
0.256 | 0.286
0.496 | 0.508
0.000 | 0.000
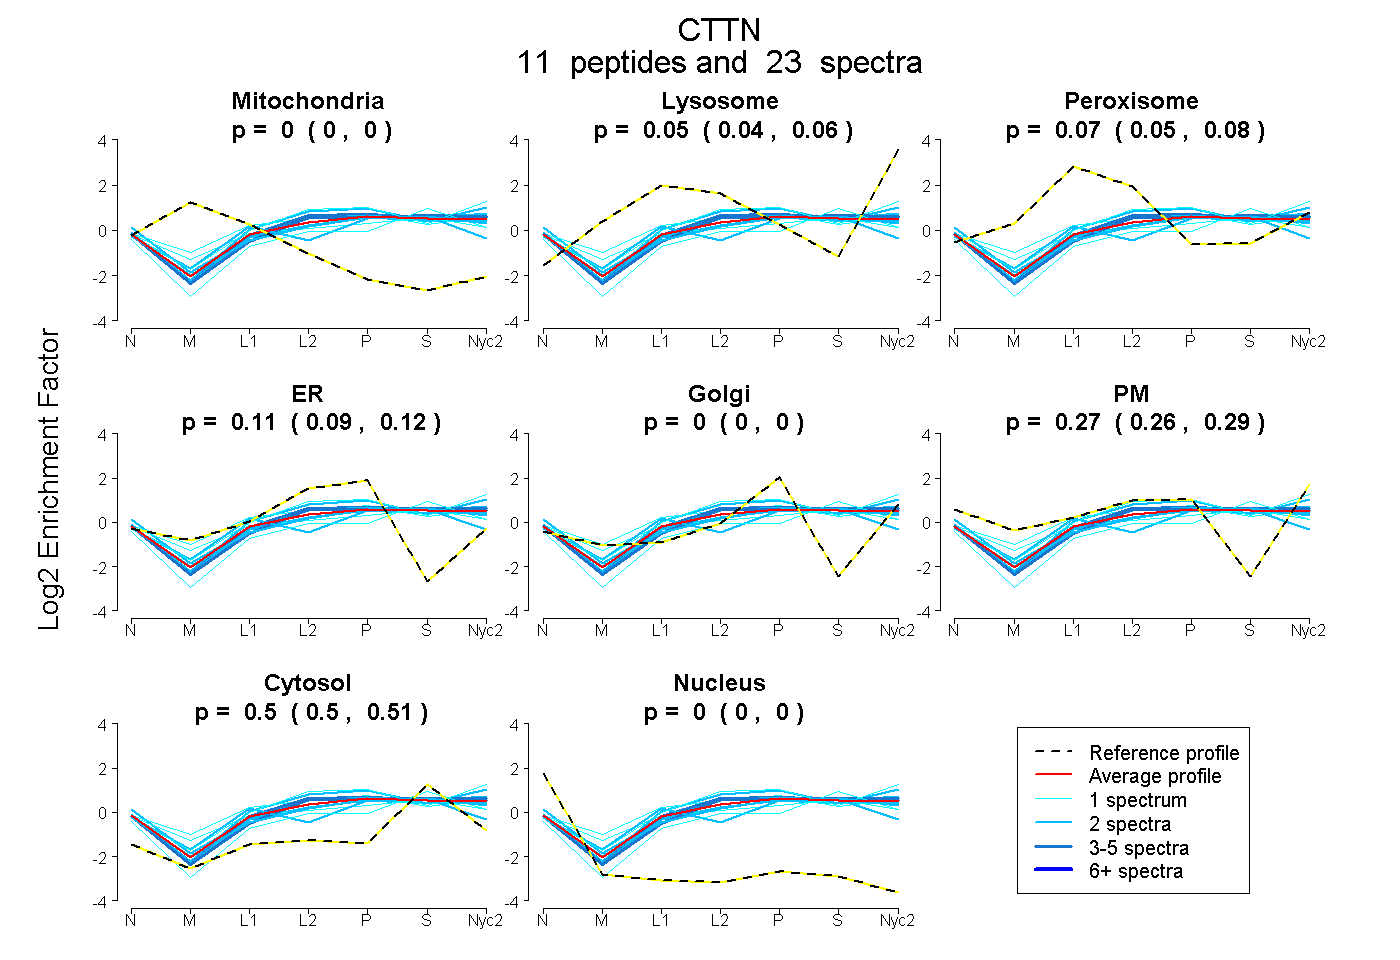
| Plot | Mito | Lyso | Perox | ER | Golgi | PM | Cytosol | Nucleus | |||||
| Expt A |
11 peptides |
23 spectra |
|
0.000 0.000 | 0.000 |
0.051 0.038 | 0.063 |
0.065 0.050 | 0.078 |
0.110 0.093 | 0.124 |
0.000 0.000 | 0.000 |
0.271 0.256 | 0.286 |
0.502 0.496 | 0.508 |
0.000 0.000 | 0.000 |
| 2 spectra, ELETGPK | 0.000 | 0.183 | 0.000 | 0.172 | 0.000 | 0.229 | 0.416 | 0.000 | ||
| 1 spectrum, ENVFQEHQTLK | 0.000 | 0.008 | 0.293 | 0.000 | 0.211 | 0.170 | 0.318 | 0.000 | ||
| 1 spectrum, YGLFPANYVELR | 0.000 | 0.012 | 0.003 | 0.048 | 0.000 | 0.222 | 0.714 | 0.000 | ||
| 4 spectra, FGVQTDR | 0.000 | 0.084 | 0.000 | 0.120 | 0.000 | 0.262 | 0.534 | 0.000 | ||
| 2 spectra, HCSQVDSVR | 0.000 | 0.000 | 0.225 | 0.053 | 0.214 | 0.000 | 0.507 | 0.000 | ||
| 2 spectra, YGVQADR | 0.000 | 0.036 | 0.030 | 0.120 | 0.000 | 0.266 | 0.548 | 0.000 | ||
| 2 spectra, ASHGYGGK | 0.000 | 0.000 | 0.063 | 0.054 | 0.000 | 0.387 | 0.497 | 0.000 | ||
| 1 spectrum, SAVGFEYQGK | 0.000 | 0.235 | 0.000 | 0.145 | 0.000 | 0.249 | 0.372 | 0.000 | ||
| 1 spectrum, DYSSGFGGK | 0.000 | 0.000 | 0.223 | 0.008 | 0.120 | 0.168 | 0.480 | 0.000 | ||
| 2 spectra, FGVQMDR | 0.000 | 0.089 | 0.000 | 0.099 | 0.000 | 0.308 | 0.504 | 0.000 | ||
| 5 spectra, FGVEQDR | 0.000 | 0.091 | 0.036 | 0.179 | 0.000 | 0.197 | 0.497 | 0.000 |
| Plot | Mito | Lyso or Perox | ER | Golgi | PM | Cytosol | Nucleus | ||||||
| Expt B |
5 peptides |
9 spectra |
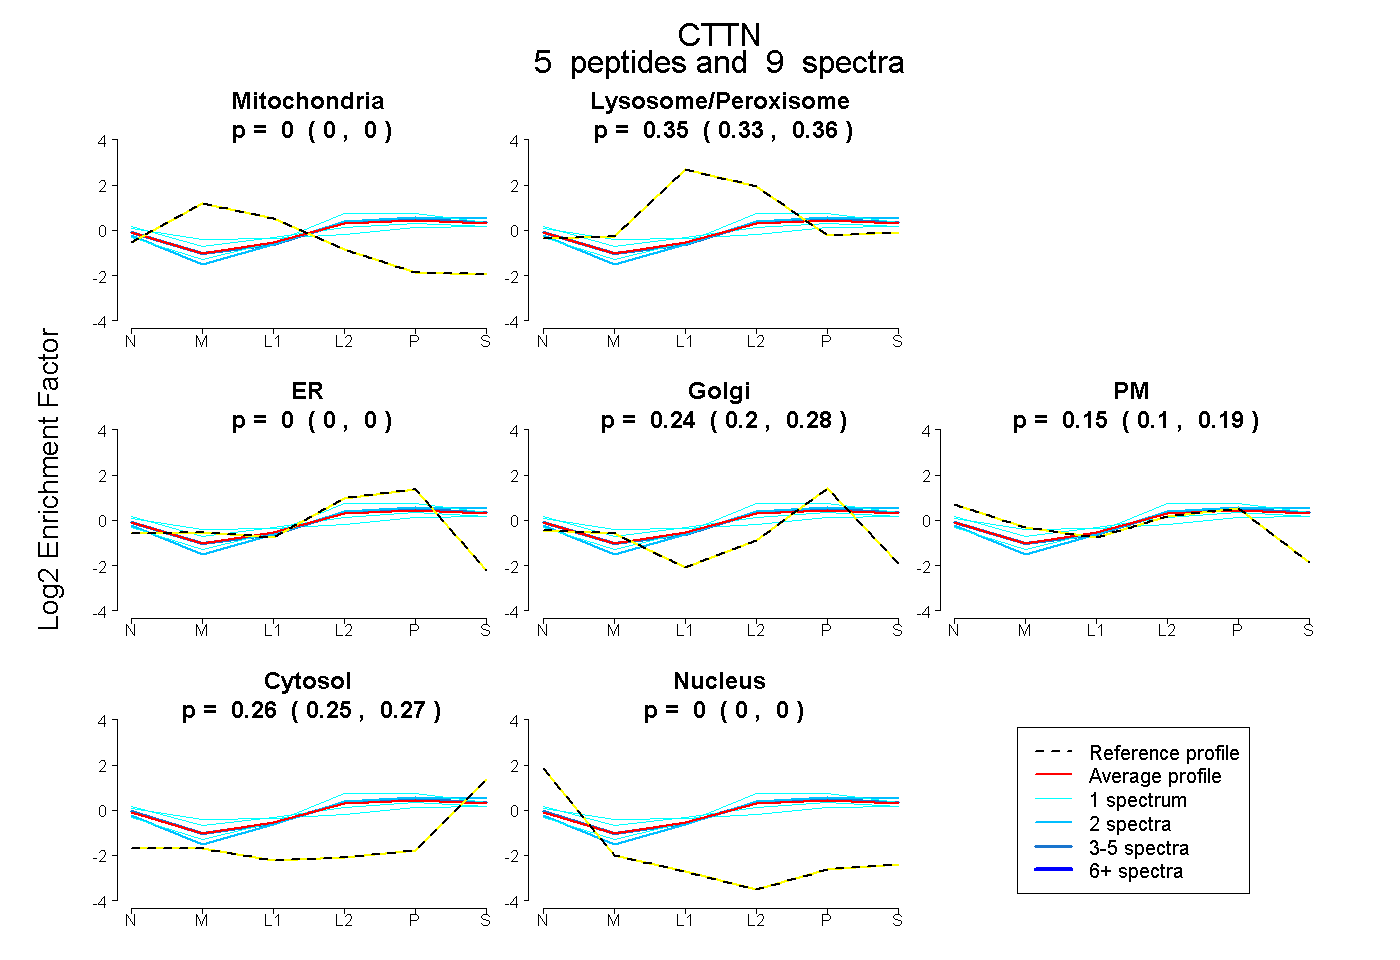 |
0.000 0.000 | 0.000 |
0.348 0.330 | 0.363 |
0.000 0.000 | 0.002 |
0.241 0.195 | 0.276 |
0.150 0.102 | 0.191 |
0.260 0.245 | 0.272 |
0.000 0.000 | 0.000 |
|||
| Plot | Lyso | Other | |||||||||||
| Expt C |
14 peptides |
53 spectra |
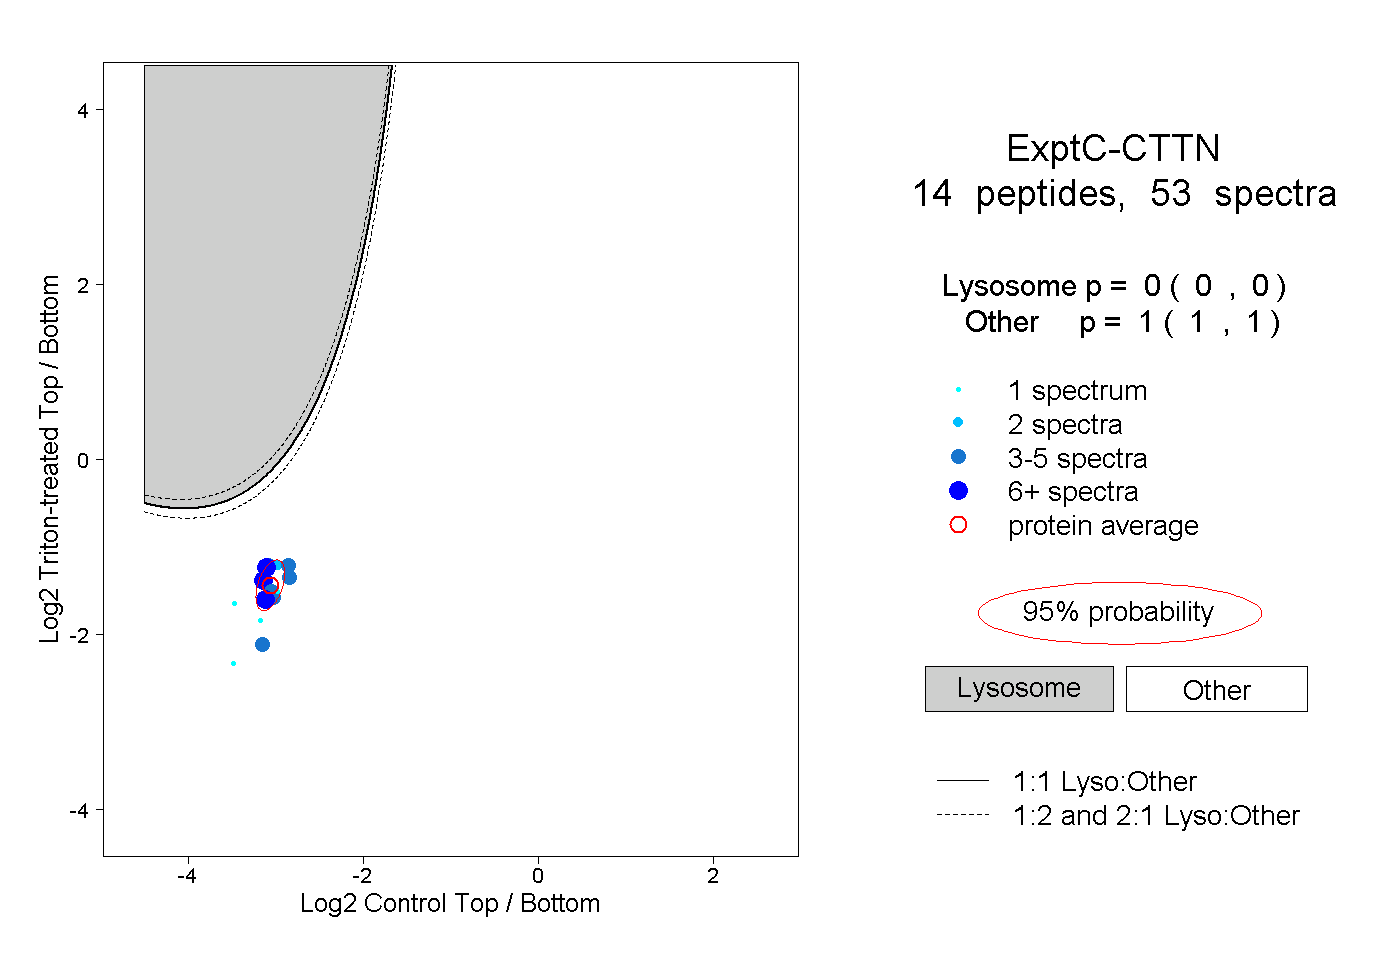 |
0.000 0.000 | 0.000 |
1.000 1.000 | 1.000 |
||||||||
| Plot | Lyso | Other | |||||||||||
| Expt D |
4 peptides |
9 spectra |
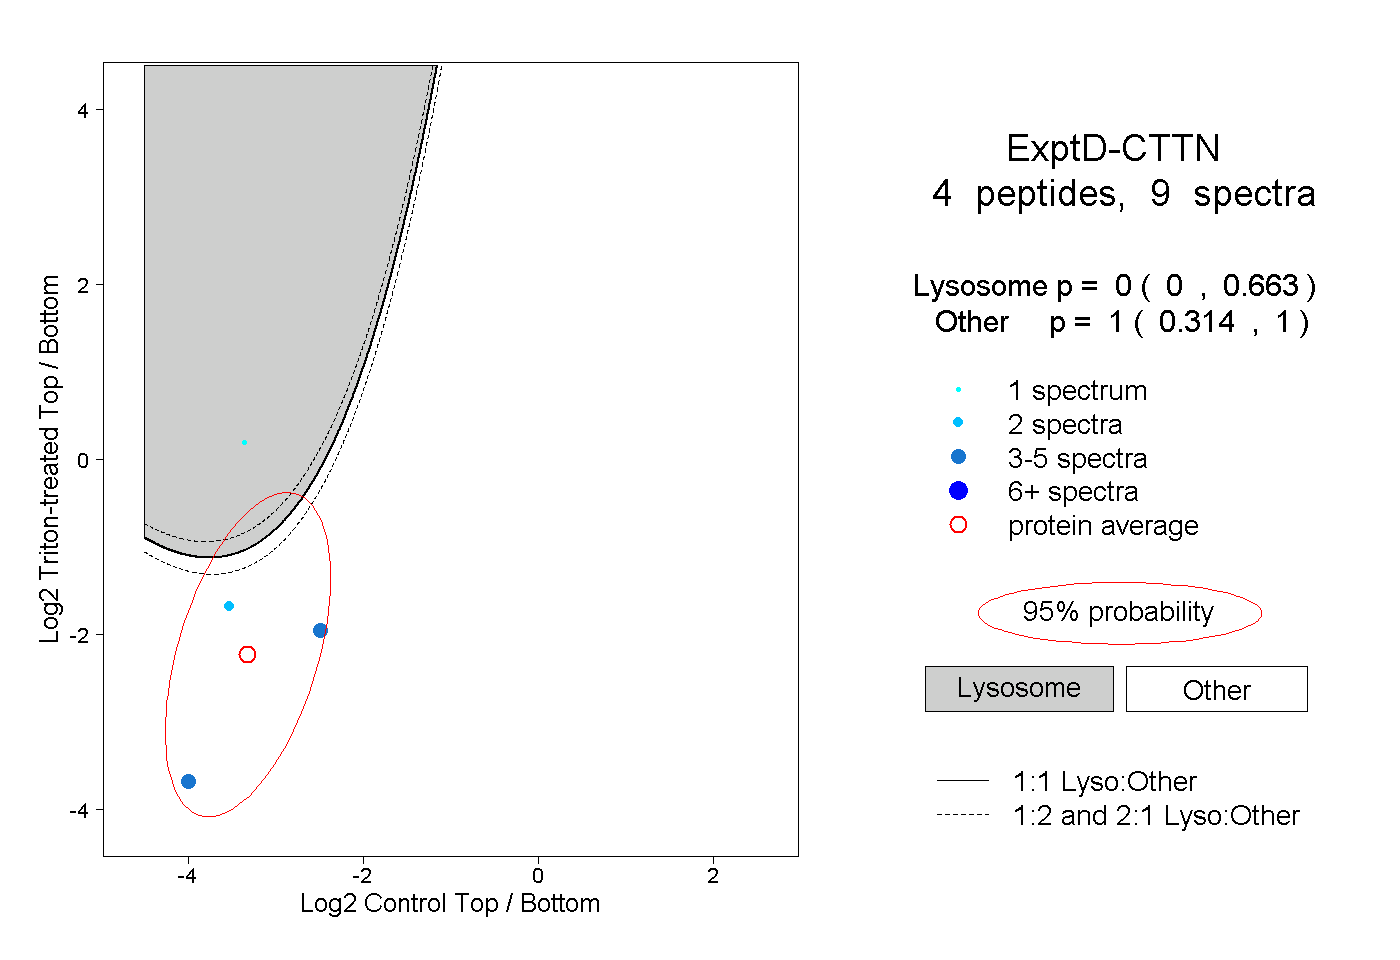 |
0.000 0.000 | 0.663 |
1.000 0.314 | 1.000 |