 3
3peptides
spectra
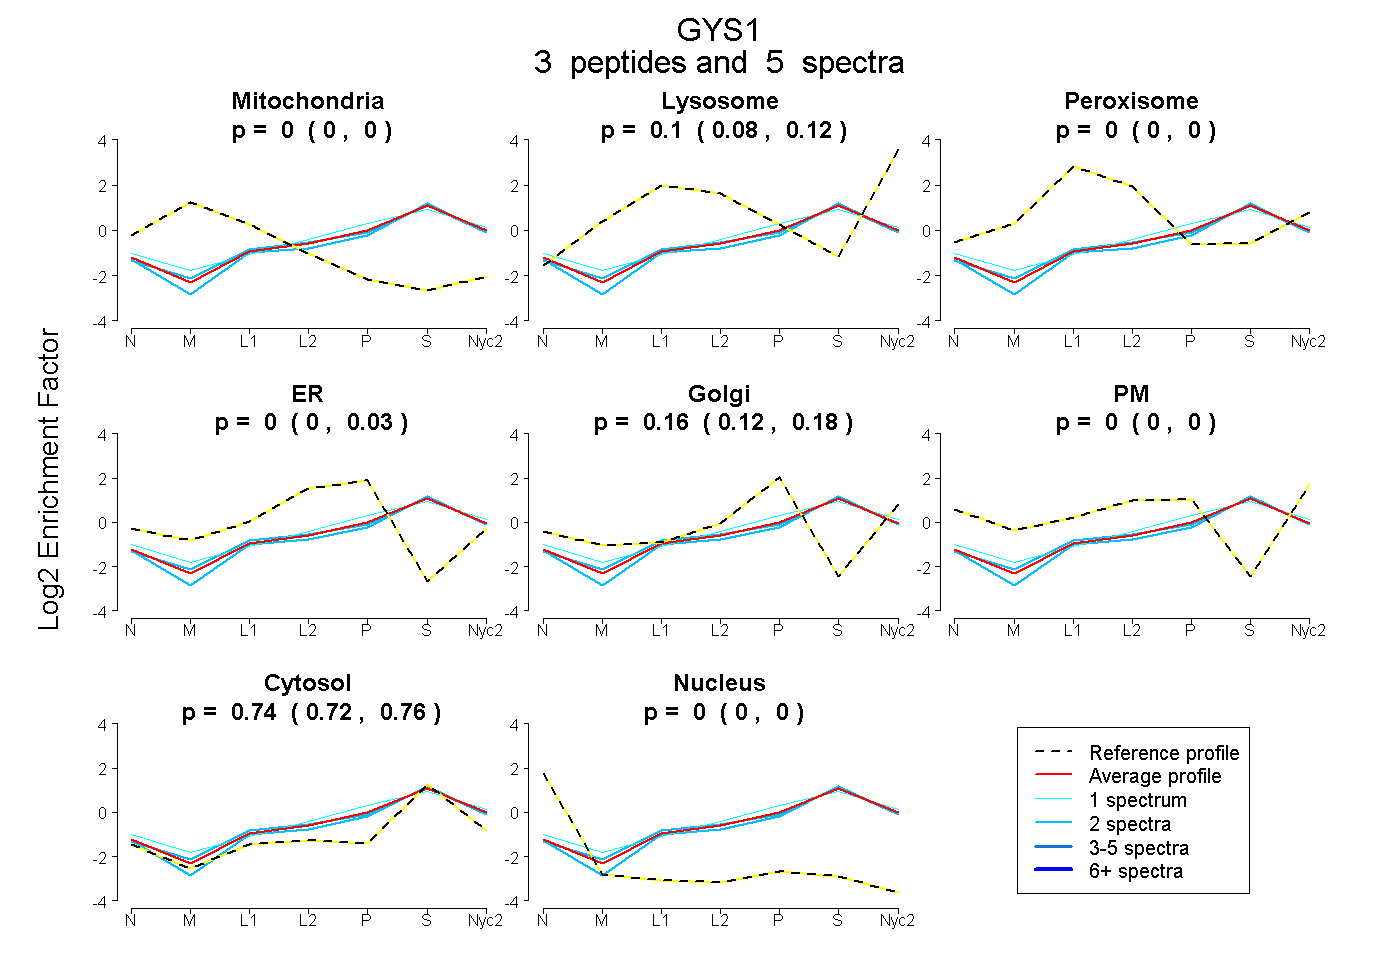
0.000 | 0.000
0.079 | 0.116
0.000 | 0.000
0.000 | 0.030
0.117 | 0.179
0.000 | 0.000
0.721 | 0.757
0.000 | 0.000
3peptides
spectra
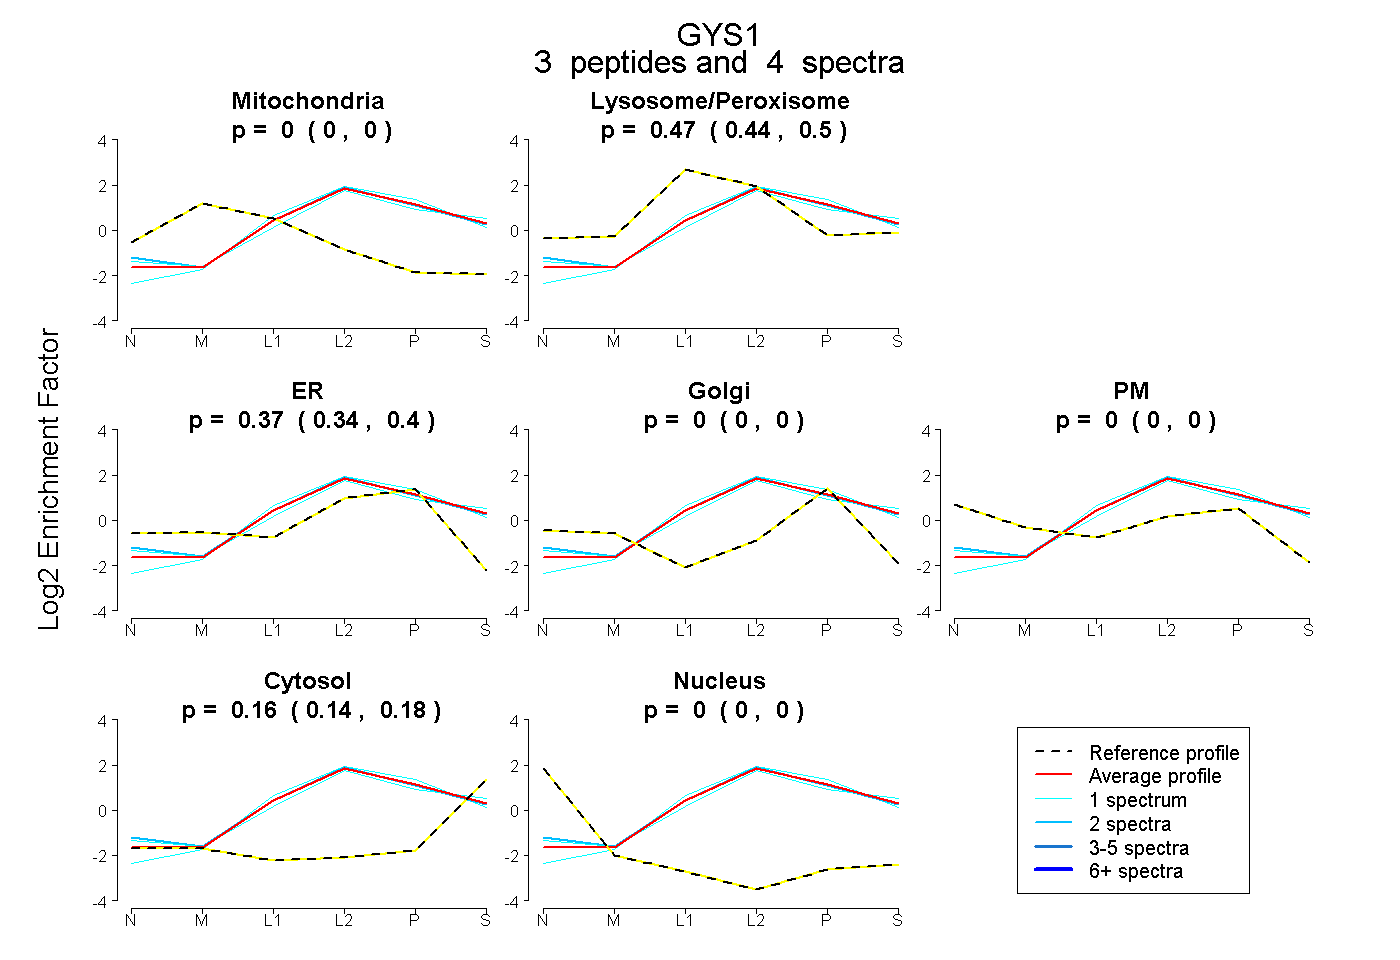
0.000 | 0.000
0.439 | 0.496
0.336 | 0.395
0.000 | 0.000
0.000 | 0.000
0.139 | 0.178
0.000 | 0.000
4peptides
spectra
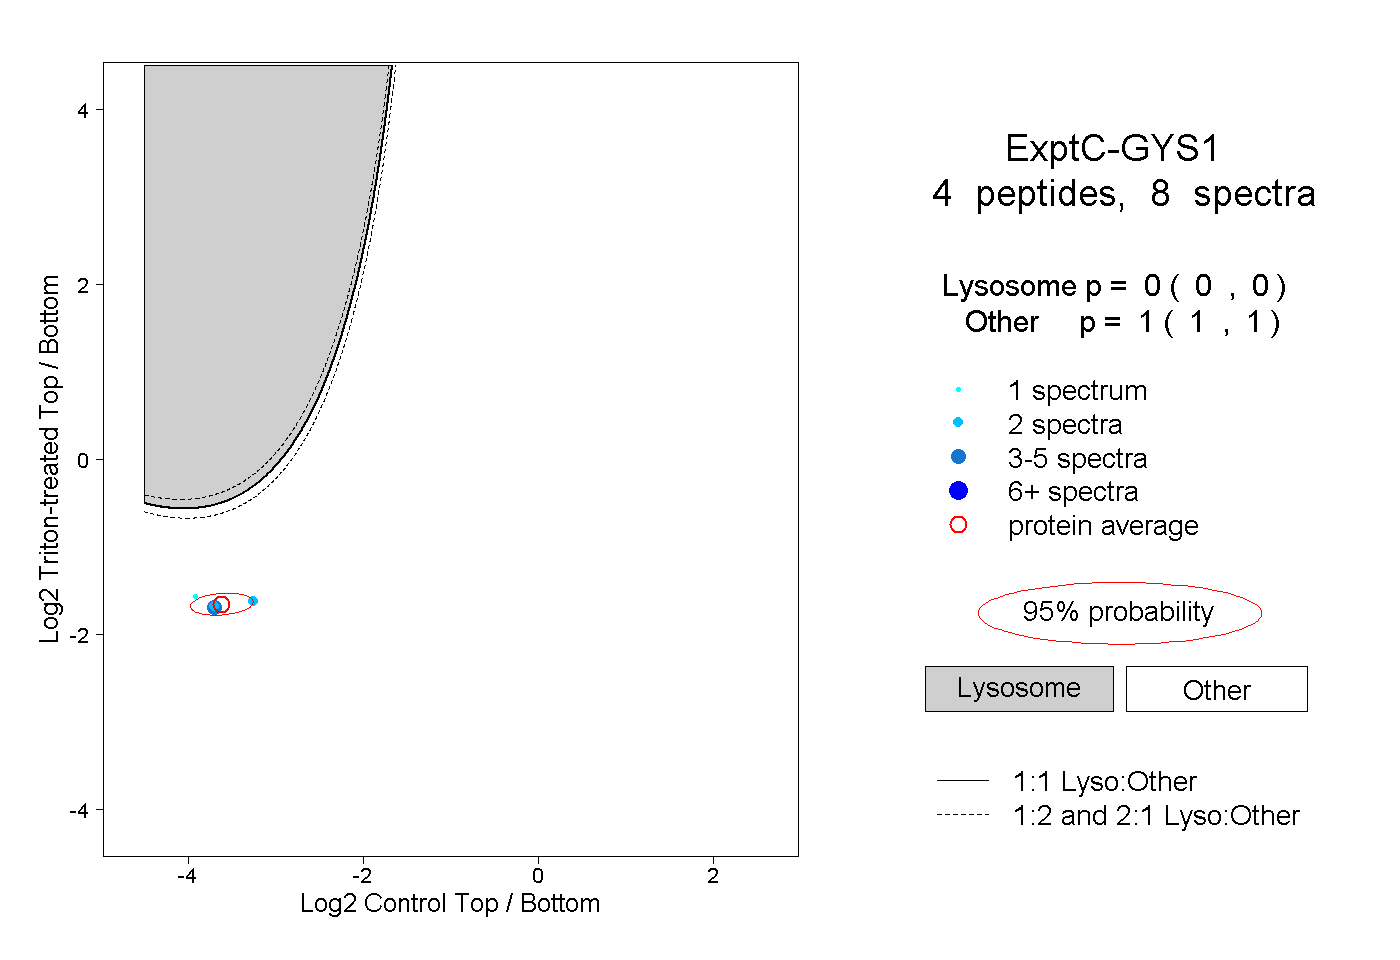
0.000 | 0.000
1.000 | 1.000